
Every year, once the dust settles on the MLB playoffs, we try to make sense of what just happened. It’s only human, but there’s folly in the pursuit as well. In this year’s World Series, Game 7 itself might have turned on a step not taken off the bag at third, or a pitch location missed by inches — small moments that could lead to the wrong takeaways.
And some of the lessons change from year to year. As tempting as it might be to make this year’s Los Angeles Dodgers title about payroll, we also had the Texas Rangers and Arizona Diamondbacks in the World Series just a couple of years ago.
But postseason baseball is still baseball, played at the highest level, so perhaps there are some insights we can glean from how these playoffs unfolded on the field.
It’s still about homers, but simply making hard contact isn’t bad
Hit homers, win games. Teams that out-homered their opponents had a near 90 percent win percentage this postseason, in line with previous years.
so far this postseason:
– Teams to score first are 27-19
– Teams to out-homer opponents are 29-5 (23-8 in ‘24 PS)
– 44.8% of runs have been scored via HR (was 41.1% in ’25 RS, 47.0% in ’24 PS)
— Sarah Langs (@SlangsOnSports) November 1, 2025
Homers are good, duh, but there’s still some intrigue here. Where do those homers come from? Who hits the most home runs in the postseason? Is it just the teams that hit the most home runs during the regular season? The Toronto Blue Jays made the most contact during the regular season. There’s some evidence that contact rates are slightly more important in the postseason than in the regular season, but in the postseason, the Jays also swung harder and hit more homers than anyone else.
Because postseason numbers are usually a collection of small samples, the correlation between regular-season numbers and postseason numbers is not strong. That said, if you look at those numbers during the Statcast era, a trend emerges. Regular-season home run rates are very bad at predicting postseason home run rates. The correlation isn’t significant, and the R-squared value is around .01 — regular-season home run totals for a team are not super helpful when prognosticating the playoffs.
There are two stats best correlated with postseason homers and slugging. Barrel Rate, which is a quality of contact statistic provided by Baseball Savant, is one. The Dodgers were fourth-best in Barrels this season, and the Blue Jays were 12th. The San Diego Padres, Cleveland Guardians, Milwaukee Brewers and Cincinnati Reds were the worst playoff teams in that statistic, so they made the dance on contact — but being good at Barrels is a reliable way to succeed once you get to the playoffs.
The other statistic with an interesting correlation was strikeout rate for hitters. Perhaps surprisingly, the relationship between regular-season team strikeout rate and postseason home run rate and slugging percentage was fairly strong relative to other metrics. In other words, the fewer strikeouts a team’s lineup produced during the regular season, the more likely they were to hit for power in the postseason.
So the homer is still king. But you have to make contact at all before you can make game-winning contact. The best teams combine contact and Barrels, and that’s likely to continue happening.
Teams are getting more aggressive on the base paths
If it seemed like this postseason there were more TOOTBLANs (Thrown Out On The Bases Like A Nincompoop) than normal, you weren’t imagining things. It looks like teams are getting more aggressive when sending runners.
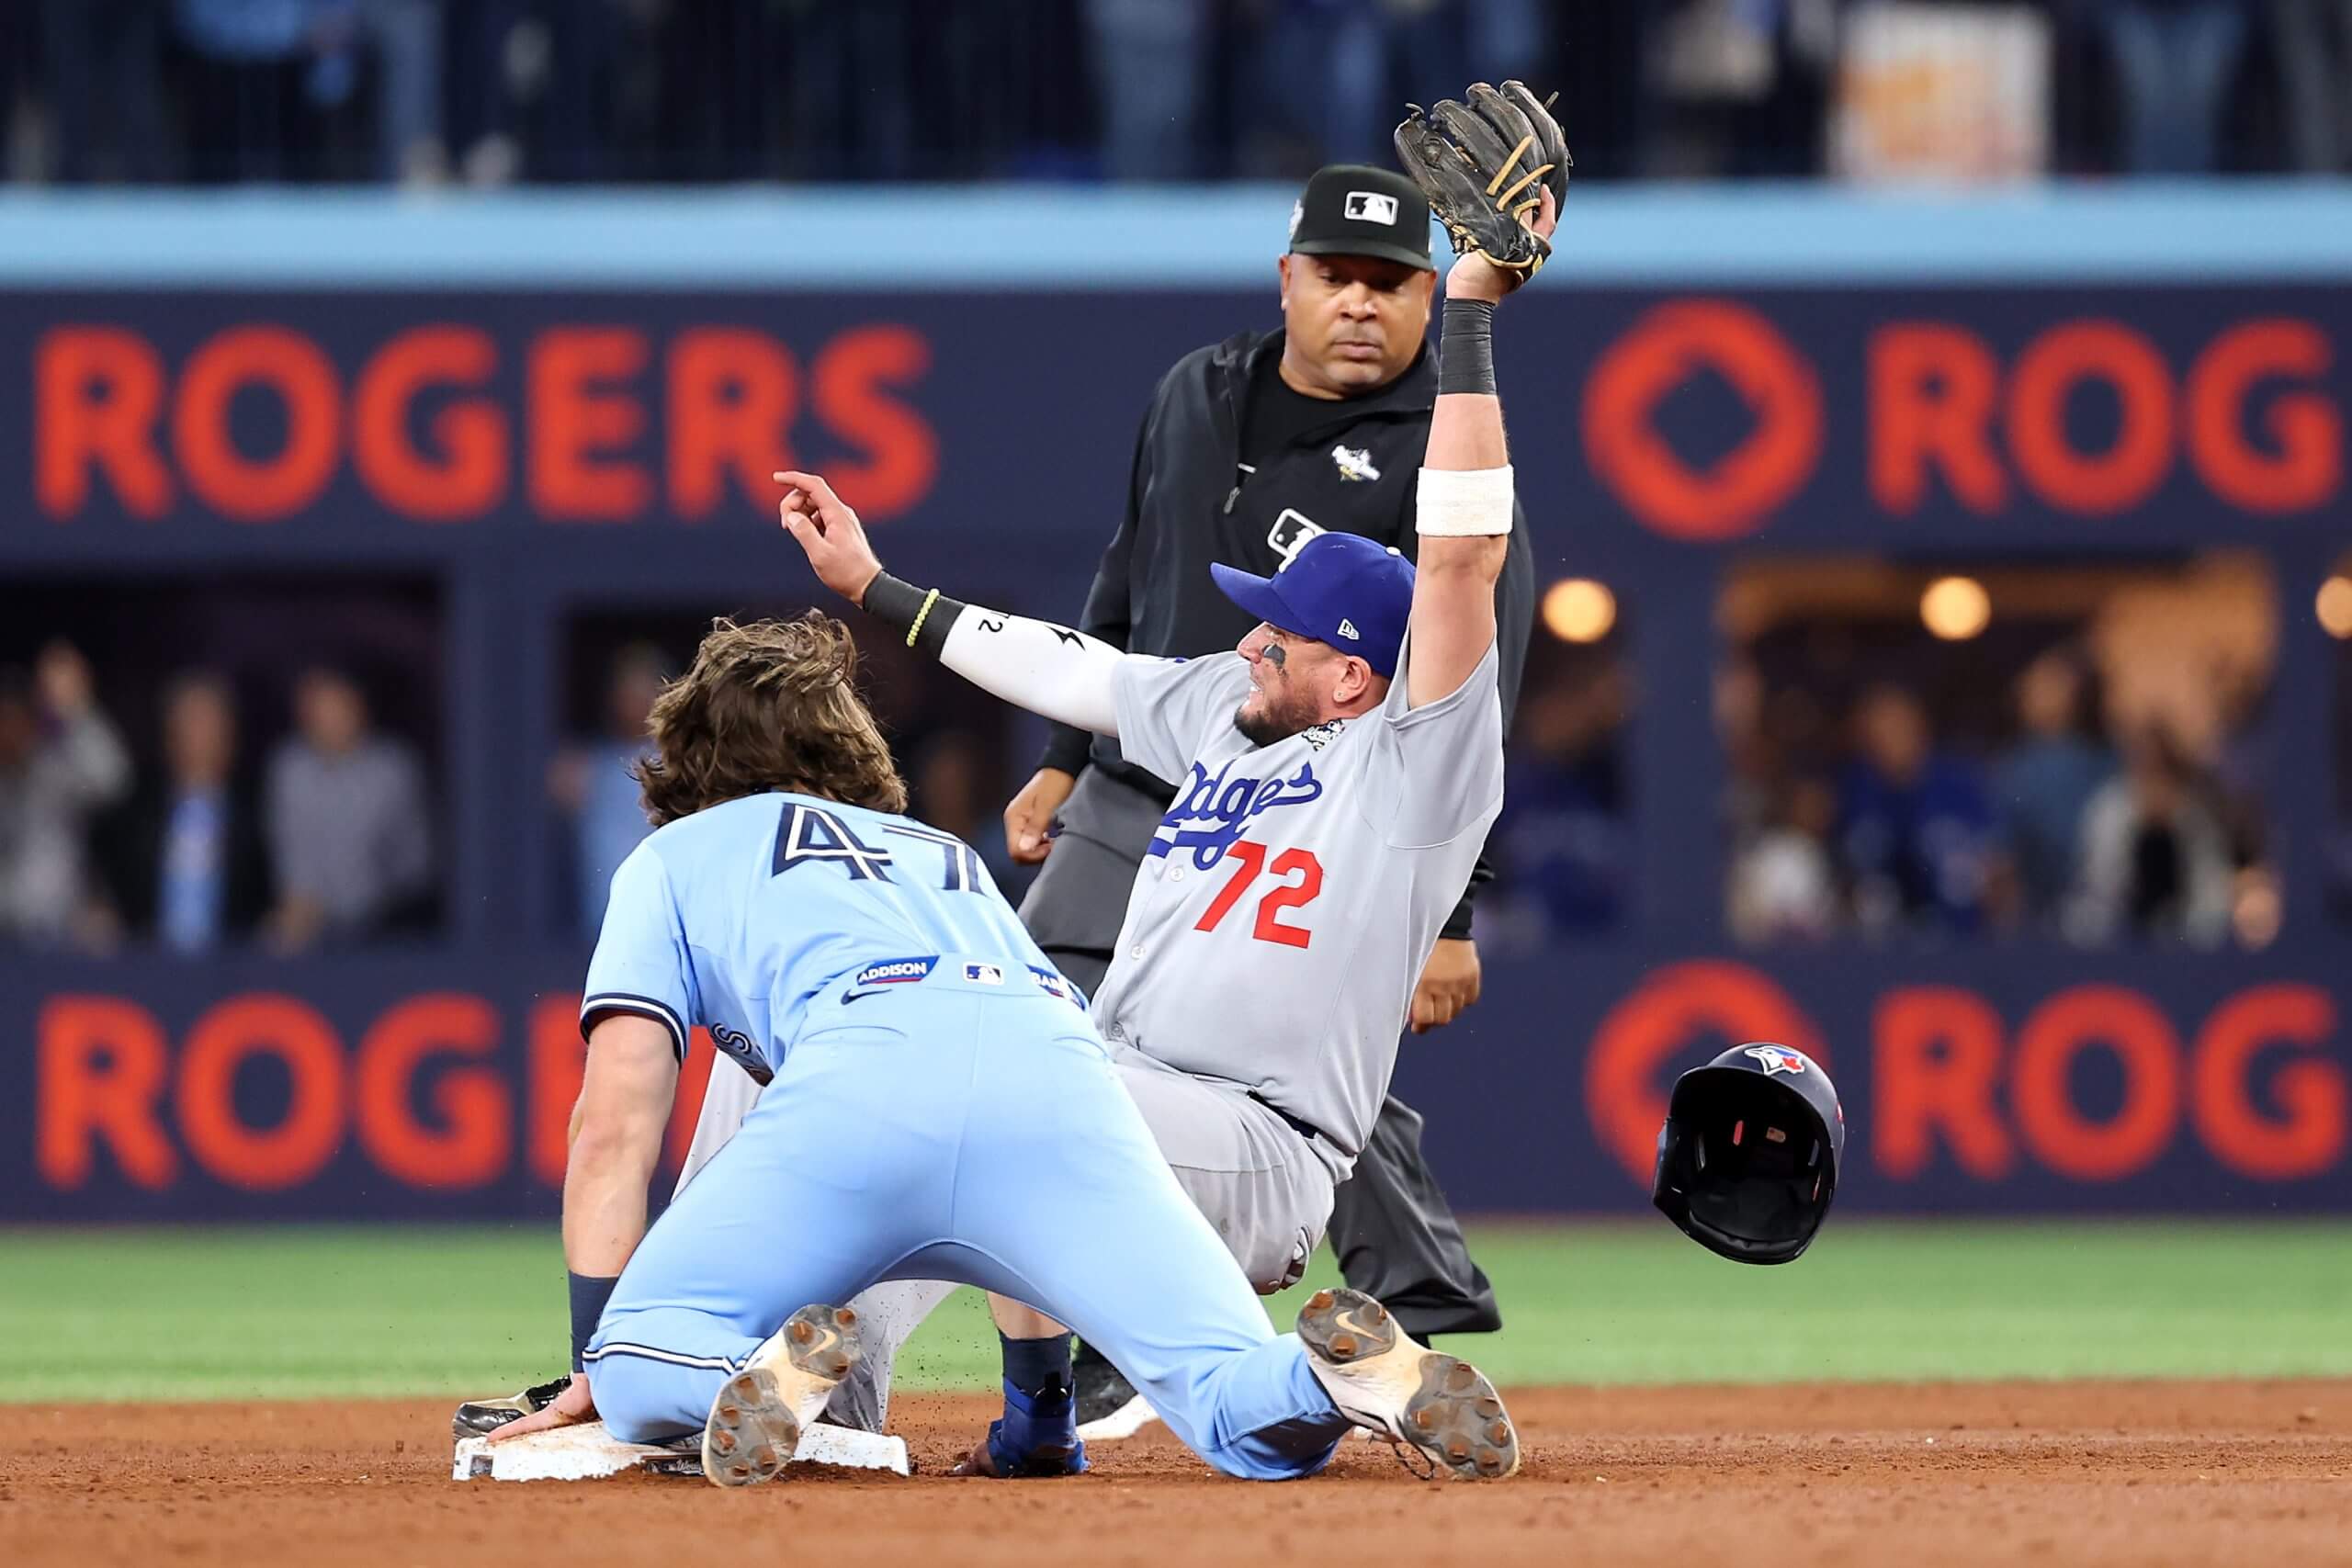
Addison Barger was caught too far off second base on a shallow flyball that resulted in a double-play to end Game 6 of the World Series. (Emilee Chinn / Getty Images)
According to STATS Perform, there were only three postseasons in the history of baseball in which more baserunners made outs on the bases in non-force situations than this year. The 2025 postseason featured the most TOOTBLANs in the expanded playoff format, too, so it’s not a function of simply playing more games. And never before have more runners been caught between third and home! There were 11 ducks on the pond that never made it home from third base while attempting to score.
Of course, one of the highest profile moments in Game 7 came on a force out at home that might have been caused by too short a lead off third, so that’s the memory we might leave with in terms of narrative. But in terms of numbers, whether it’s because of the new rules or a shift in coaching philosophy, we are seeing a more aggressive form of base-running in the big leagues.
And it’s had some significant consequences.
Using starters heavily works, but at a cost
During the World Series Game 7, traditional relievers only got 13 of the 66 outs. Part of that is the nature of a World Series Game 7 — there was no tomorrow, so there was no need to save any starters for the next game. But part of that was also by design, as both teams invested more in terms of payroll into their rotations and trusted their starting pitchers more in the postseason.
Is it a design that can work for teams moving forward? For one, they’ll have to spend some cash, as the Dodgers’ rotation was famously expensive and the Blue Jays’ rotation cost them nearly $90 million in 2025. And then there’s the fact that starting pitchers are not normally themselves when used on less than usual rest. Stuff+ is a metric that sums up the physical qualities of their pitches, and most of the starters this postseason showed lesser stuff when used on short rest or in-between starts.
Short rest means lesser stuff
The reason the heavy usage still worked for so many of the starters is that they started with great stuff and were still good options even in a lesser state. Unfortunately for copycats, stuff is more expensive than command on the open market.
It’s a plan, and it worked, but it’s a hard one to follow. Just watch how expensive the few good starting pitchers on the market will be this offseason.
The more you throw a pitch, the better hitters will be against it
Every year, pitchers throw fewer fastballs. Every year, pitchers throw more sliders and sweepers and splitters. The more often a pitcher throws a batter a particular pitch, the better the batter gets at hitting it. See how the league has hit these secondaries better with every season that they have been thrown more often:
That trend continued in the postseason. Splitters, sliders and sweepers all saw the five-year highest or second-highest slugging percentages in this postseason. In Game 7, all four homers came on sliders and splitters. It’s going to happen when they are thrown so often. Less than a third of all pitches thrown in Game 7 were four-seam fastballs.
How will this spin forward? There’s been a resurgence of the sinker and the cutter in order to give pitchers other hard options than the four-seam fastball. You may see slider and sweeper usage trends start to slow. And you may see the rise of a new secondary offering…
Expect to see more splitters
While the slugging was up on the split-finger over the last few years, it was still only .250 for the postseason. This postseason saw by far the most splitters in the history of pitch tracking and the postseason. It’s worth graphing just to see the scale of it.
There’s a chance this is selection bias, of course. There were more splitters thrown this postseason because the Dodgers and Blue Jays made it to the World Series and threw Kevin Gausman, Yoshinobu Yamamoto, Trey Yesavage, Shohei Ohtani and Jeff Hoffman — all of whom have plus splitters. Yamamoto threw more splitters than fastballs three starts in a row for the first time in his career. Gausman threw more splitters than fastballs in a couple of his starts. Maybe it was just this crew in this postseason, and things will return to normal.
But maybe not. Our understanding of how the seams create movement took a step forward with Seam-Shifted Wake, and that’s part of why Yesavage’s splitter is so effective. So teams can create better splitters more effectively now than they could in past years. And as those other teams look at how resilient splitter outcomes have been for pitchers, even in the face of added usage, this becomes a trend that’s likely to be copied. Even during the regular season, this year’s 3.3 percent splitter usage was an all-time high. Seems like we can expect more over the coming years.