
The theoretical framework for the quasi-bound flat bands in the continuum
We start with a one-dimensional (1D) silicon PhC slab, as shown in Fig. 2a, with the system parameters detailed in the figure caption. Figure 2b presents the calculated band structure of TE-like modes, with the colormap representing the corresponding Q-factors. We find that an isolated BIC with infinite Q-factor is identified at the center of momentum space, while other Bloch modes located within the light cone (the white region), experience a rapid decrease in Q-factor as their k-vectors deviate from the BIC. In addition, Bloch modes below the light line are non-radiative, exhibiting infinite Q-factors. Now, we construct a supercell with thirteen fundamental units (A = 13\({a}_{0}\)) by adding mirror-symmetric disorder. Then, the supercell is repeated in periodic direction to construct an infinite photonic crystal slab. Specifically, as depicted in Fig. 2c, the widths of silicon pillars within each supercell are randomly assigned within the range of [W−δ, W+δ], where W is the original width and δ/W characterizes disorder strength. We emphasize that that the mirror symmetry of each supercell is essential for constructing the quasi-BFIC, which is fully discussed later. To maintain the mirror-symmetry of each supercell, pairs of silicon pillars positioned symmetrically about the mirror plane share the same width. We mention that the proposed structure is different from the chirped system with gradually varying structural modulations and exhibit local rather than global periodicity57,58,59. The disorder adopted in the random design breaks the local periodicity but preserves the global periodicity, as the supercell is periodically repeated to form the final structure.
Fig. 2: Theoretical results of quasi-bound flat bands in the continuum.
a Schematic diagram of the 1D silicon PhC slab. The lattice constant, slab thickness and silicon width are denoted as a0 = 380 nm, and D = 250 nm and W = 243 nm, respectively. The refractive indexes of background and silicon grating are nb = 1.45 and nSi = 3.33. b The calculated TE-like band structure of a 1D silicon PhC slab, with the colormap representing the Q-factors of Bloch modes. c Schematic diagram of a supercell in the 1D silicon PhC slab, with mirror-symmetric disorder on W within each supercell. Each silicon grating is centered within a fundamental unit, and the widths of the pillars are randomly assigned in the range [W−δ, W+δ], where δ/W characterizes the disorder strength. The color of each pillar indicates its width after introducing disorder. d Statistical distributions of bandwidths and averaged Q-factors of a targeted TE-like band for perturbed structures with δ/W equaling to 0.05, 0.15, and 0.4. Structures with high-Q flat bands are enclosed in the blue shaded areas. e Probability of generating random structures with high-Q flat bands (dots in the blue blocks) as a function of disorder strength. f Calculated band structure of a randomly generated PhC slab, as marked by the green star in (d). Two flat bands are highlighted, and the colormap represents their Q-factors. Other Bloch modes are shown as gray lines. \({\Gamma }_{n}\) with \(n=0,\pm 1\) represent the \(\Gamma\)-point in Brillouin zones of different orders. g Upper: Eigen-field profiles at the Γ point for quasi-BFIC; lower: Eigen-field profiles at the Γ point for low-Q flat band. h Calculated amplitude distributions of Fourier coefficients for flat-band eigen-fields in k-space \(u\left({k}_{x}\right)\) for the high-Q flat band at 1520 nm. i The enlarged distribution of \(u\left({k}_{x}\right)\) for the high-Q flat band at 1520 nm. j Multiple topological charges related to zero points of \(u\left({k}_{x}\right)\), which are marked by characters of \({{{\rm{\alpha }}}}\), \({{{\rm{\beta }}}}\), \({{{\rm{\gamma }}}}\), and \({{{\rm{\delta }}}}\) in (i). k The enlarged distribution of \(u\left({k}_{x}\right)\) for the low-Q flat band at 1935 nm.
To assess the impact of mirror-symmetric disorder with different strengths, we randomly generate 800 different structures at each value of δ/W, ranging from 0.05 to 0.4. We then calculate the bandwidth and averaged Q-factor of the first TE-like band above the low-frequency bandgap (marked by the dash lines in Fig. 2b) of these structures. Notably, our considered band is isolated from other TE-like bands due to band folding and coupling induced by the structural disorder within each supercell (Supplementary Note 1). The bandwidth is defined as the difference between the maximum and minimum eigen-frequencies of the targeted band (Supplementary Note 2). And, the averaged Q-factor is calculated as the mean of the Q-factors for all Bloch modes within the band. We present three typical statistical distributions with disorder strengths being δ/W = 0.05, 0.15 and 0.4 (Fig. 2d). When δ/W = 0.05, most randomly created structures exhibit high averaged Q-factors of the targeted band, but also relatively large band dispersions. As δ/W increases to 0.15, contrary to conventional expectations that disorder would reduce the Q-factors, we observe that some randomly generated structures can exhibit both high averaged Q-factors and narrow bandwidths, as indicated by discrete points within the blue region. However, when the disorder strength is further increased to δ/W = 0.4, the averaged Q-factors of all generated structures drop significantly. The probability of generating PhC slabs with high Q-factor flat bands (dots in the blue region) reaches maximum at δ/W = 0.15 (Fig. 2e).
Because when δ/W is relatively small, the eigenmodes of these randomly generated structures always exhibit weak localization within each supercell, accompanied by significant band dispersion. Conversely, if the disorder strength is too large, the strongly localized eigenmodes within each supercell can induce the substantial far-field radiation. Therefore, the optimal strength of structural disorder is determined by balancing the disorder-induced modal localization and band flatness, as well as the amplitude of Fourier coefficients above the light line (the far-field leakage) of the localized eigenmodes (see details below).
To further illustrate the disorder-induced high-Q flat bands, we calculate the band structure of a randomly generated PhC slab with δ/W = 0.15 (marked by the green star in Fig. 2d) sustaining the high-Q flat band (Fig. 2f). Notably, two flat bands are highlighted in the eigen-spectrum, with the colormap representing their Q-factors. Other dispersive Bloch modes are plotted by gray lines. Remarkably, flat band at 1520 nm exhibit exceptionally high Q-factors, reaching up to 200000 throughout the entire k-space, respectively. We emphasize that such angle-insensitive Q-factors can substantially enhance robustness against scattering losses from fabrication defects (Supplementary Note 3). Another flat band at 1935 nm has the relatively low Q-factor (about 8000). Both flat-band eigenmodes exhibit strong localization within the supercell (Fig. 2g). These spatially localized eigenstates induce the formation of the flat-band dispersions.
To analyze the origin for the high Q-factors of flat bands, we calculate the amplitude distribution of Fourier coefficients for flat-band eigen-fields in momentum space19. It is defined as
$${u}_{n}\left({\widetilde{k}}_{x}\right)=|\frac{1}{A}{\int }_{A}{{{\bf{E}}}}\left({\widetilde{k}}_{x},x,y\right){e}^{i{k}_{x}x}{dx}|$$
(1)
with \({k}_{x}={\widetilde{k}}_{x}+n\frac{2\pi }{A}\) \((n=0,\pm 1,\ldots )\). \({{{\bf{E}}}}({\widetilde{k}}_{x},x,y)\) represents the flat-band eigenmode at the Bloch wavevector \({\widetilde{k}}_{x}\in [-\frac{\pi }{A},\frac{\pi }{A}]\) within a supercell out of the slab. For simplicity, we denote the set of \({u}_{n}\left({\widetilde{k}}_{x}\right)\) for all permissible values of n as \(u\left({k}_{x}\right)\). Here, we set the integral plane of Eq. (1) in the near-field region, making both radiative and non-radiative components of flat-band eigenfields in k-space can be obtained. If the integral plane is set in the far-field region, Eq. (1) only quantifies the far-field radiation amplitude19 (Supplementary Note 4). Details on the calculation of \(u\left({k}_{x}\right)\) using the finite element method is presented in the Methods section. It is shown that, for the high-Q flat band at 1520 nm the dominate components of \(u\left({k}_{x}\right)\) are concentrated in the non-radiative region, with extremely low values of \(u\left({k}_{x}\right)\) appearing in the radiative domain (Fig. 2h). This suggests that only a small portion of the Fourier coefficients for the flat-band eigenmode is able to radiate away from the PhC slab.
Additionally, the suppression of radiative components above the light cone is further enhanced by the presence of multiple zero points of \(u\left({k}_{x}\right)\). When we magnify the view of \(u\left({k}_{x}\right)\) in the radiative area (Fig. 2i), multiple zero-amplitude points (labeled as \({{{\rm{\alpha }}}}\), \({{{\rm{\beta }}}}\), \({{{\rm{\gamma }}}}\), and \({{{\rm{\delta }}}}\)) are observed at discrete \(k\) points. These zero points are characterized by ill-defined far-field polarization, corresponding to the polarization singularities with topological charges equaling to \(\pm 1\) (Fig. 2j). The robustness of the topological charges is proved by their evolution under continuous parameter variation (Supplementary Note 5). We note that, beyond preventing leakage at specific wavevectors, topological charges also suppress the radiation of Bloch modes at nearby wavevectors, which explains the low values of \(u\left({k}_{x}\right)\) in the radiative region. In this case, protected by the existence of multiple zero points of \(u\left({k}_{x}\right)\), each Bloch mode within the high-Q flat band can be regarded as a quasi-BIC. Consequently, this high-Q flat band behaves as a quasi-BFIC. For comparison, we further calculate the distribution of \(u\left({k}_{x}\right)\) for the low-Q flat band at 1935 nm, as shown in Fig. 2k with enlarged plot within the radiative region. Unlike the high-Q flat band, there is only one topological charge within the radiative region, resulting in the significantly increased values of \(u\left({k}_{x}\right)\) in this area. Consequently, this flat band possesses a large radiation loss and exhibits a much lower averaged Q-factor.
To further elucidate the above phenomena, we truncate the near-field distribution at y0 = 100 nm for the eigenmode presented in the upper plot of Fig. 2g, as shown by black dots in Fig. 3a. This flat-band eigen-field exhibits an exponentially localized spatial profile combined with an oscillating phase within a supercell, taking the form of \({{{{\bf{E}}}}\left(x,{y}_{0}\right)=E}_{0}{{{{\rm{e}}}}}^{-\alpha {x}^{2}}\sin ({k}_{s}x)\). The mirror-symmetric disorder ensures that the eigen-field is an even or odd function with respective to the mirror plane of the supercell. Here, the fitting parameter \(\alpha\) determines the strength of the spatial localization and \({k}_{s}\) describes the wavevector of the oscillating phase. The red line in Fig. 3a shows the fitted profile of this flat-band eigen-field, with fitting parameters being \(\alpha=4.40\times {10}^{11}\,[1/{m}^{2}]\) and \({k}_{s}=8.44\times {10}^{6}\,[1/m]\). It is shown that the fitted eigenmode reveals an excellent agreement with the numerical counterpart.
Fig. 3: The analytical explanation of quasi-bound flat bands in the continuum in randomly created photonic crystal slabs.
a The numerical (the black dots) and fitting results (the red line) of the near-field distribution of the flat-band eigenmode at y = 100 nm, truncated from the upper plot of Fig. 2g. Here, the fitting parameters \(\alpha\) and \({k}_{s}\) of \({{{{\boldsymbol{E}}}}\left(x\right)=E}_{0}{{{{\rm{e}}}}}^{-\alpha {x}^{2}}\cos ({k}_{s}x)\) are equal to \(\alpha=4.40\times {10}^{11}[1/{m}^{2}]\) and \({k}_{s}=8.44\times {10}^{6}\,[1/m]\), respectively. b The analytical result of the amplitude distribution of Fourier coefficients for the flat-band eigen-field in momentum space \(u\left({k}_{x}\right)\). c The enlarged view of the analytically calculated result of \(u\left({k}_{x}\right)\) above the light line. d Analytical results on the variation in the number of topological charges and the average values of \(u\left({k}_{x}\right)\) above the light line for the flat band as a function of the supercell period A, with fitting parameters α and \({k}_{s}\) identical to those in (a).
Next, we demonstrate how these two fitting parameters play key roles in the generation of quasi-BFICs. It is important to note that the spatial profile of flat-band eigenfields are nearly independent of the Bloch vector due to the strong localization within each supercell. In this context, the amplitude distribution of Fourier coefficients for flat-band eigen-fields in momentum space can be re-expressed as
$${u}_{n}({\widetilde{k}}_{x})=|\frac{1}{A}{\int }_{A}{{{\bf{E}}}}\left(x,{y}_{0}\right){e}^{i({\widetilde{k}}_{x}+n\frac{2\pi }{A})x}{dx}|,$$
(2)
with the out-of-slab eigen-field \({{{\bf{E}}}}\left(x,{y}_{0}\right)\) being independent of the Bloch vector. Figure 3b presents the calculated result of \(u\left({k}_{x}\right)\) using the analytical formula of \({{{\bf{E}}}}\left(x,{y}_{0}\right)\). We find that the analytical results closely align with the numerical findings in Fig. 2h, showing two symmetrically positioned peaks in the non-radiative region. The wavevectors of two peaks match to the fitting parameter \({\pm k}_{s}\), which are located in the non-radiative domain below the light cone. Additionally, the widths of these two peaks are determined by the localization strength α, with larger values of α leading to broader peaks. For the flat band to exist, a sufficiently large α is required, ensuring that the eigenfields are strongly localized. However, if α is too large, two peaks in the non-radiative region broaden significantly, causing a substantial portion of \(u\left({k}_{x}\right)\) to spill into the radiative domain and thereby reducing the Q-factors (Supplementary Note 6). Thus, there exists an optimal range of the localization strength α, which is determined by the disorder strength (as the disorder strength increases, the value of α is also increased), allowing for the coexistence of the flat-band dispersion with localized eigen-modes and narrow peak-widths of \(u\left({k}_{x}\right)\) in the non-radiative domain. To further illustrate the radiative properties, we present an enlarged view of \(u\left({k}_{x}\right)\) around the center of k-space (Fig. 3c). There are multiple equally spaced topological charges within the light cone and zero points of \(u\left({k}_{x}\right)\) in the non-radiative region near the light line, ensuring that the flat band possesses the low-valued radiation loss in the entire k-space. Interestingly, we find that the number of topological charges depends not only on the fitting parameters α, but also on the period A of the supercell. To verify this phenomenon, we calculate the variation in the number of topological charges (within the light cone) and the averaged values of \(u\left({k}_{x}\right)\) above the light line \( < u({k}_{x}){ > }_{\left|{k}_{x}\right| < {k}_{b}}\) (\({k}_{b}\) is the background wavevector) for the flat band as a function of the supercell period A (Fig. 3d), with fitting parameters α and \({k}_{s}\) identical to those in Fig. 3a. The results indicate that the number of topological charges increases with the supercell period, accompanied by a significant reduction in the radiation loss. This suggests that expanding the supercell size could be a viable way to approaching ideal BFICs.
Additionally, we note that besides the spatial profile described by \({E}_{0}{{{{\rm{e}}}}}^{-\alpha {x}^{2}}\sin ({k}_{s}x)\), other types of flat band eigenfields with varied distributions can also be randomly generated with mirror-symmetric disorder within each supercell. It is shown that these different spatial profiles of localized flat-band eigenmodes can also give rise to quasi-BFICs under suitable fitting parameters (Supplementary Note 7). Moreover, the importance of the mirror-symmetry on the emergence of quasi-BFICs is also theoretically verified by considering the flat-band eigen-field without any even or odd symmetry, where no topological charge is found above the light line (Supplementary Note 8).
The experimental evidence for the quasi-bound flat bands in the continuum
In this section, we provide the experimental results, including the angle-resolved transmission spectra, iso-frequency contour, and the direct Q-factor measurement of the quasi-BFIC resonances. To verify our findings, the photonic crystal samples are fabricated according to the theoretical parameters. Figure 4a, b shows a scanning electron microscope image of the fabricated sample, with an enlarged side view in Fig. 4b. A 241-nm-thick silicon layer is firstly deposited on a silica substrate. Then, the 1D PhC slab with mirror-symmetric disorder in each supercell is fabricated in the silicon layer using a combination of electron-beam lithography and reactive ion etching techniques (see Methods section for details). The fabricated PhC slab measures approximately 500 × 500 μm² and contains ~100 supercells with each supercell possessing a length of 4940 nm. Such sample size is sufficient to exhibit the high-Q properties associated with quasi-BFICs (Supplementary Note 9). To create an optically symmetric environment, the fabricated sample is covered with PMMA, which matches the refractive index of the silica substrate.
Fig. 4: The measurement of the angle-resolved transmittance spectra.
a Scanning electron microscope image of the fabricated 1D silicon PhC slab with mirror-symmetric disorder within each supercell. The supercell constant and slab thickness are equal to 4940 nm and 241 nm, respectively. In addition, the disorder strength applied to the width of this silicon grating is equal to δ/W = 0.15. b The enlarged side view of a supercell for the fabricated sample. c The optical setup of the angle-resolved momentum-space imaging spectroscopy. d, e The experimentally measured and numerically stimulated transmission spectra as functions of the incident wavelength and wavevector. The scanning steps for the incident wavelength and wavevector are matched to the experimental resolution limits for these quantities. High-Q flat bands are missing in these results.
At first, we measure the angle-resolved transmission spectra using the optical setup shown in Fig. 4c. Details are provided in Methods section. The result is shown in Fig. 4d where the color map qualifies the strength of transmissivity. In Supplementary Note 10, the line spectra with specific incident angles are presented. The accessible ranges of the incident angle and wavelength in our applied polarization-resolved momentum-space imaging spectroscopy are confined within −40 to 40 degree and 1410 to 1580 nm, respectively. For comparison, we also numerically calculate the transmission spectra of this 1D PhC slab (Fig. 4e). The scanning steps for the incident wavelength and wavevector are matched to their experimental resolution limits. We find that the measured dispersions of Bloch bands agree well with the simulation results, confirming the successful fabrication of the sample with mirror-symmetric disorder within each supercell. Notably, we find that for both the experimental and numerical transmissivities, the high-Q flat band vanish entirely across the full range of incident angles. As a matter of fact, this observation serves as indirect validation for the presence of quasi-BFICs. The disappearance of the entire band shares the same origin as the disappearance of small segment of the band observed in previous BIC studies2,24,25,29,45.
To directly measure the Q-factors of quasi-BFICs, we employ an additional optical setup (Fig. 5a), which enables band structure visualization through iso-frequency contour observation in momentum space. Details are provided in the Methods section. The experimental results of iso-frequency contours at 1520 nm, 1515 nm, and 1510 nm can be obtained through precise control of the incident point (the large bright spot in the upper right corner), where two distinct sets of iso-frequency contours are observed (Fig. 5b–d). The flat-band iso-frequency contours appear as parallel lines that gradually separate with decreasing wavelength. The second set of contours corresponds to the dispersive TM-like mode. For reference, numerical simulations of the iso-frequency contours are displayed in Fig. 5e–g, where gray and red lines represent the eigenmodes of the quasi-BFICs and dispersive bands, respectively. Excellent agreement between experimental results and theoretical predictions confirms the observation of flat bands.
Fig. 5: Direct observation of quasi-BIC flat bands.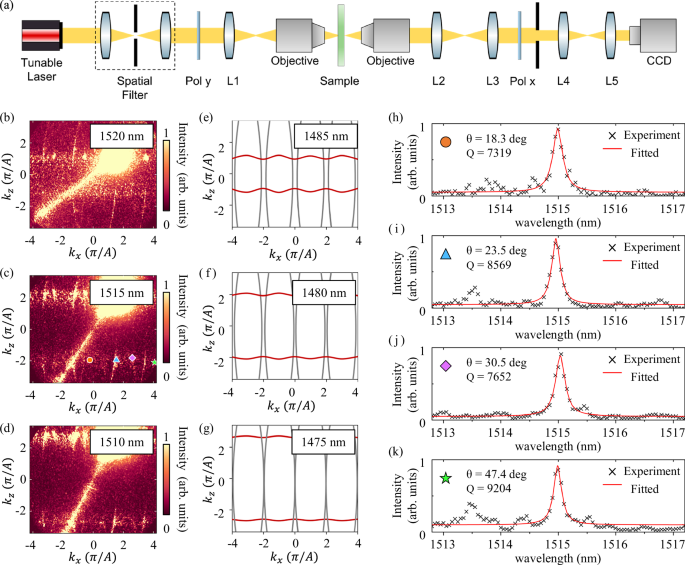
a The schematic of the isofrequency contour imaging system. b–d Experimental iso-frequency contours at 1520 nm, 1515 nm, and 1510 nm, respectively. The high-Q flat bands appear as diverging parallel lines with decreasing wavelength. e–g Corresponding numerical simulations at 1485 nm, 1480 nm, and 1475 nm, respectively, with gray and red lines representing the eigenmodes of high-Q flat bands and dispersive bands. h–k Experimental intensity spectra (dots) with Lorentzian fits (lines) for four resonances at the marked k-points in (b).
The observation of flat bands enables direct extraction of the resonance Q-factor through scattering spectrum linewidth measurements. We select four resonances centered at 1515 nm (marked by colored symbols in Fig. 5c), corresponding to incident angles ranging from 18.3 deg to 47.4 deg. By scanning the incident wavelength from 1513 nm to 1517 nm in 0.05 nm steps, narrow intensity peaks are observed with symmetric Lorentzian line shapes (Fig. 5h–k), where Lorentzian fitting of these scattering spectra yields the Q-factor of the resonances. Remarkably, the Q-factor remains stable at approximately 8000 across the entire angular range. This contrasts sharply with traditional BICs, where the Q-factor drops rapidly to ~1 × 10³ with just 2 deg deviation from normal incidence2. Our proposed quasi-BFIC structure thus demonstrates exceptional angular insensitivity of the high-Q property.
Discussion and outlook
In conclusion, we have introduced an approach to utilizing disorder in PhC slabs to create high-Q flat bands, which we term quasi-BFICs, with each Bloch state within this flat band exhibiting the quasi-BIC characteristics. Contrary to the conventional belief that disorder degrades the performance of photonic BICs, our study demonstrates that structural disorder can, in fact, enhance light-matter interactions. Additionally, we identify an optimal disorder strength that maximizes the probability of generating random quasi-BFICs. Through analytical and numerical analyses, we have shown that these random quasi-BFICs arise from the band folding, mode localization, and the emergence of multiple topological charges induced by disorder. Furthermore, we experimentally confirmed the existence of quasi-BFICs through both angle-resolved transmission spectroscopy and scattering iso-frequency contour imaging, demonstrating nearly uniform Q-factors of ~8000 across a wide angular range (up to 47.4 deg). These findings challenge the traditional understanding of disorder in photonic systems and open up exciting possibilities for designing advanced optical devices with enhanced functionality and responsiveness. Our work paves the way for the future advancements in photonic technologies, with the potential to revolutionize the design and applications of highly efficient, wide-angle response and disorder-tolerant optical systems based on BICs. Additionally, the concept of quasi-BFICs holds promise for extension to other classical wave and condensed matter systems, offering valuable insights for the development of novel functional devices and the exploration of flat-band quantum phenomena with many-body strong interactions7,60.