December 14, 2025
Between December 5 and 9, 2025, Abacus Data surveyed 1,500 Canadian adults, offering a final snapshot of the federal political landscape as Parliament wrapped up for the year and the country entered the holiday season. This is our last federal political tracker of 2025.
This wave captures public response to several key developments: the Carney government’s early November budget, the memorandum of understanding between Alberta and the federal government on a pipeline to the west coast, and the intensifying trade and diplomatic tensions with the United States.
Despite these developments, the results suggest a political landscape that remains deeply competitive and stable with few signs of a major shift in momentum.
Both the Liberals and Conservatives remain locked in a tie, and Canadians continue to express ambivalence about the country’s direction, mixed feelings about their leaders, and sharp divides by generation, region, and policy concern.
Mood: Pessimism Still Dominates, but No New Slippage
Thirty-five percent of Canadians say the country is headed in the right direction, unchanged from late November. A majority, 51 percent, believe Canada is off on the wrong track, while 14 percent are unsure. These results are consistent with what we have seen since the fall, and while there is no further deterioration, there is also no sign of widespread renewal or confidence.
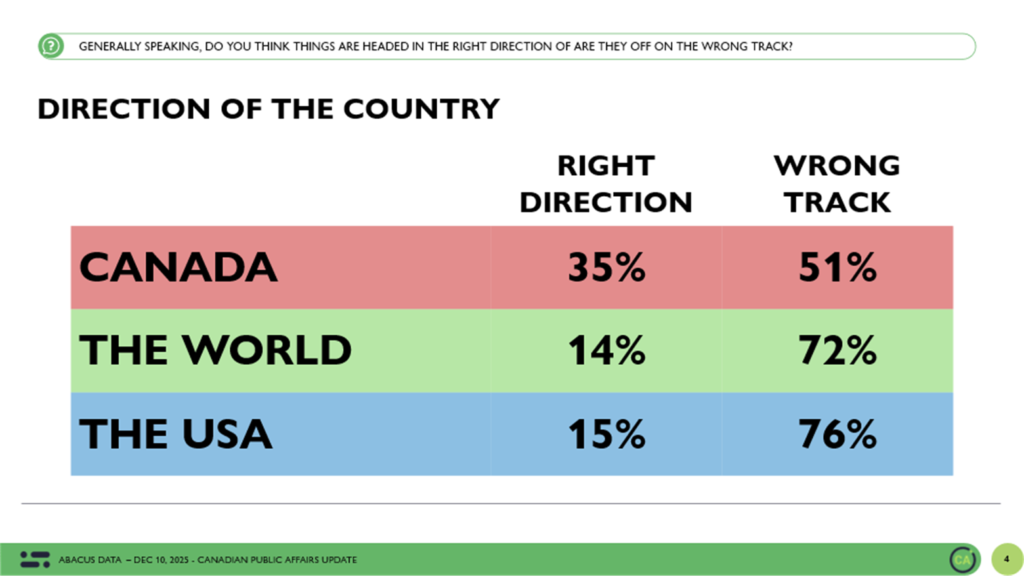
Views of the global context remain overwhelmingly negative. Just 14 percent believe the world is on the right track, and only 15 percent feel that way about the United States. The latter figure reflects entrenched concern about the direction of the U.S. under President Trump, whose policies on trade, energy, and foreign affairs have become a source of friction for Ottawa.
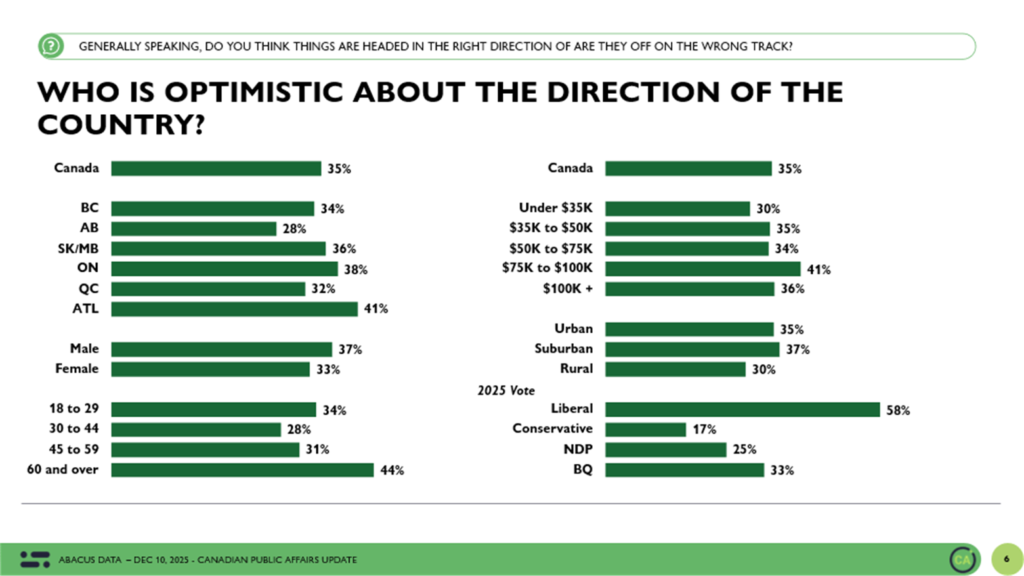
Regionally, optimism is highest in Atlantic Canada and Ontario, where 41 percent and 38 percent respectively believe the country is moving in the right direction. In Alberta and Quebec optimism remains low, with just 28 percent in Alberta and 32 percent in Quebec feeling positive about the country’s trajectory. Among partisans, 58 percent of Liberal voters believe Canada is heading in the right direction compared to just 17 percent of Conservative supporters.
Top Priorities: Cost of Living Dominates with Healthcare and the Economy Behind
This wave, we temporarily changed how we asked Canadians about their top issues. Respondents selected up to three from a slightly revised list and ask what should be the top three priorities of the federal government. This allows us to begin building a richer attitudinal picture of the electorate, which will form the basis of new segmentation work to be released in early 2026. That analysis will help uncover how different voter groups prioritize issues, values, and trade-offs, offering a more granular understanding of where the political battleground truly lies.
Even with the revised approach, the findings remain consistent with what we have tracked throughout the year. The rising cost of living remains the top concern for Canadians, cited by 62 percent. Healthcare comes second at 40 percent, followed by economic growth and jobs at 34 percent.
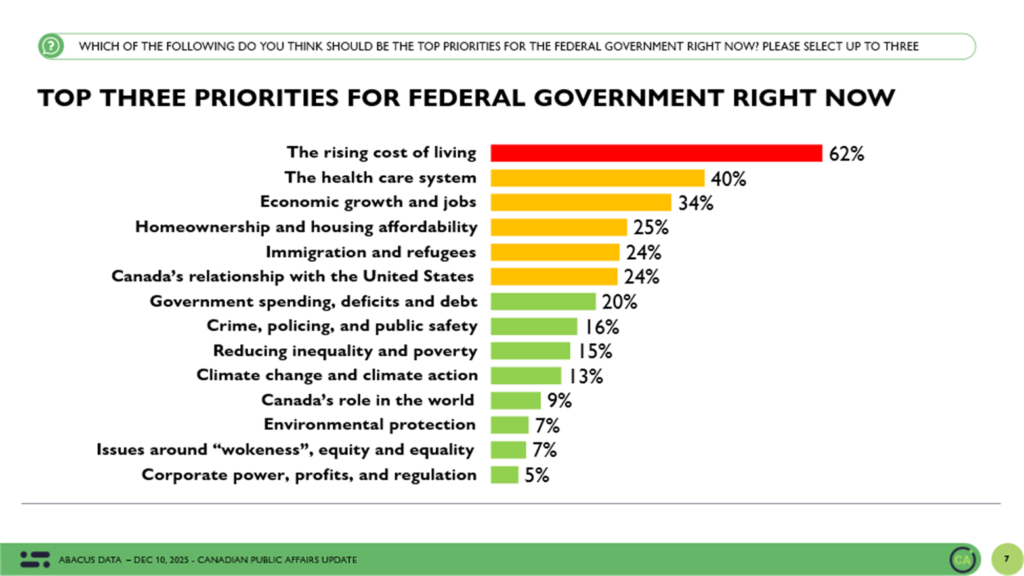
Concern about housing affordability holds steady at 25 percent, while immigration ranks closely behind at 24 percent. Another 24 percent cite Canada’s relationship with the United States as one of the top priorities
Other concerns include government spending (20 percent), crime and public safety (16 percent), inequality (15 percent), and climate change (13 percent). Environmental protection and issues related to equity or corporate power remain important to some, but these rank behind more immediate economic and geopolitical concerns.
Government Approval: A Modest Decline
Approval of the Carney government sits at 47 percent, down one point from the last wave. Disapproval has risen to 35 percent, up three points since late November. The result is a net approval of plus 12, still one of the stronger scores the government has posted in recent months.
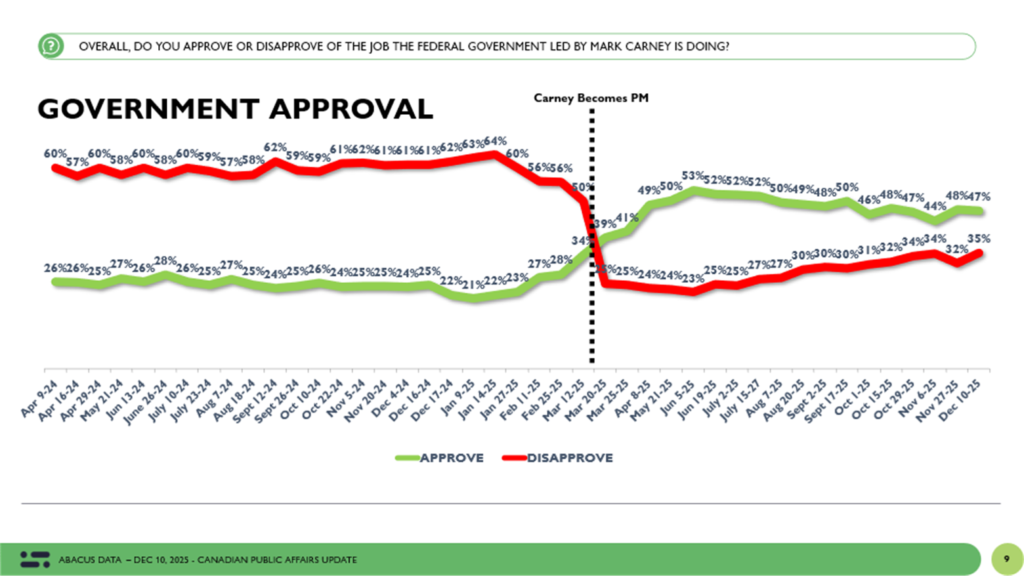
Throughout the fall, approval remained relatively consistent, fluctuating within a narrow band. These numbers suggest Canadians are not moving decisively away from the government, but the political goodwill generated by the budget may now be fading.
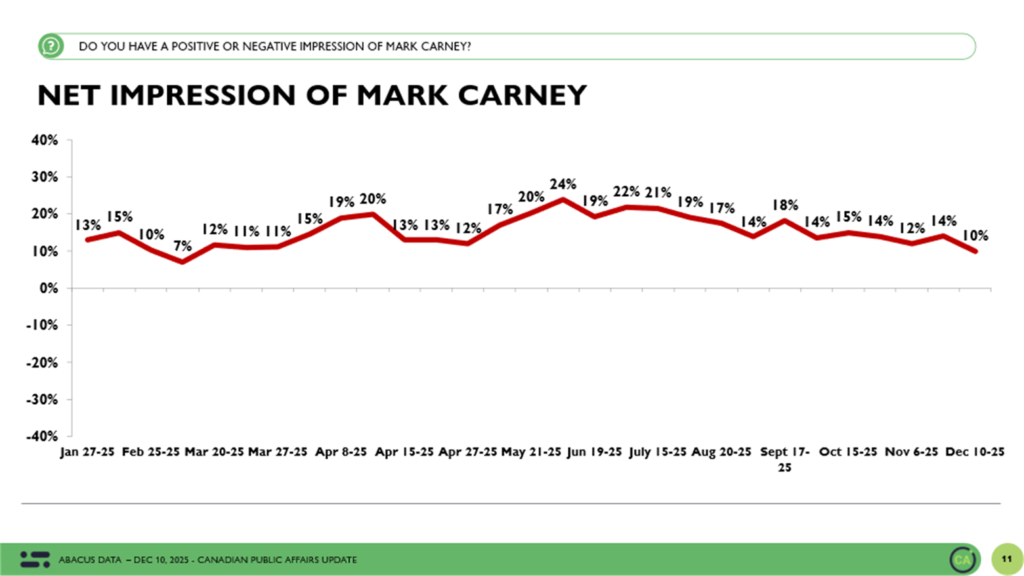
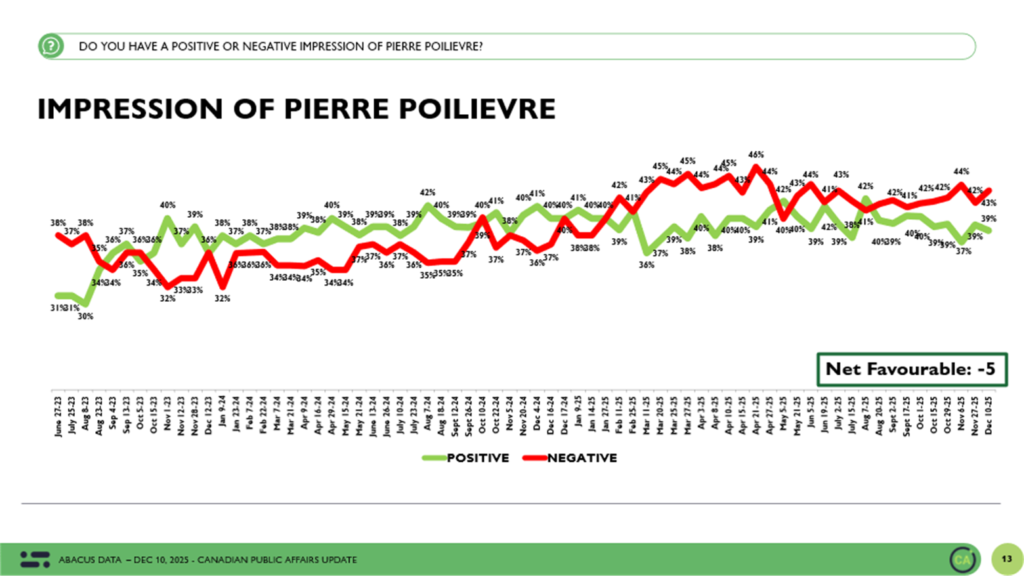
Leader Impressions: Carney’s Negatives Up, Poilievre Static
Mark Carney continues to lead his rivals in overall favourability. Forty-five percent of Canadians view him positively, while 35 percent view him negatively. The four-point increase in his negative impression is significant. It marks the highest level of disapproval for Carney since becoming Prime Minister and narrows his net favourability to plus 10.
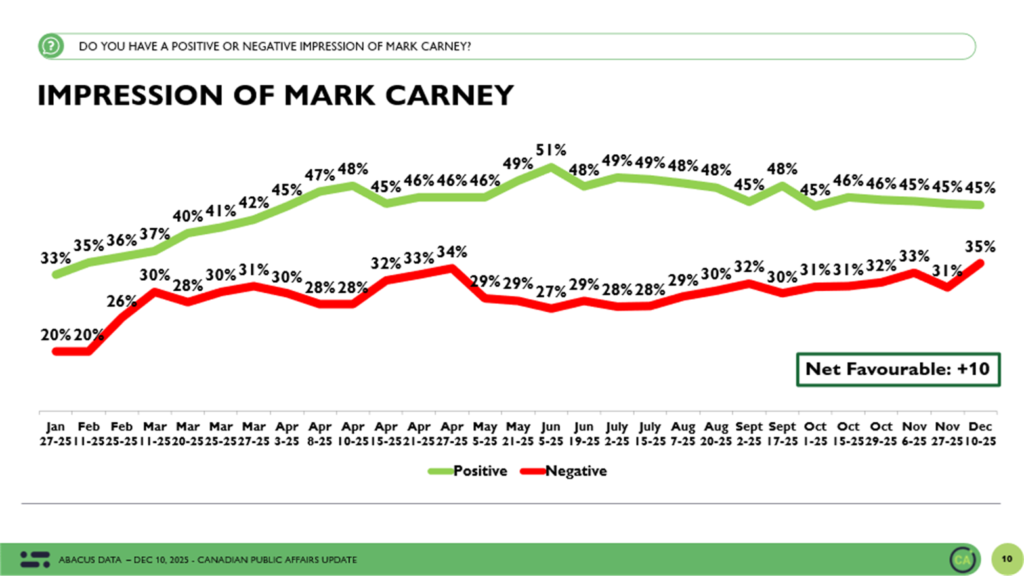
The shift may reflect a mix of heightened partisan friction, economic pressure, or disappointment with recent government actions. While still in net positive territory, this is the first indication in months that public perceptions of Carney may be hardening.
Pierre Poilievre’s ratings remain stable. Thirty nine percent view him favourably and 44 percent view him unfavourably, for a net rating of minus 5. These numbers have held steady for most of the fall, reinforcing the polarized and durable views surrounding his leadership.
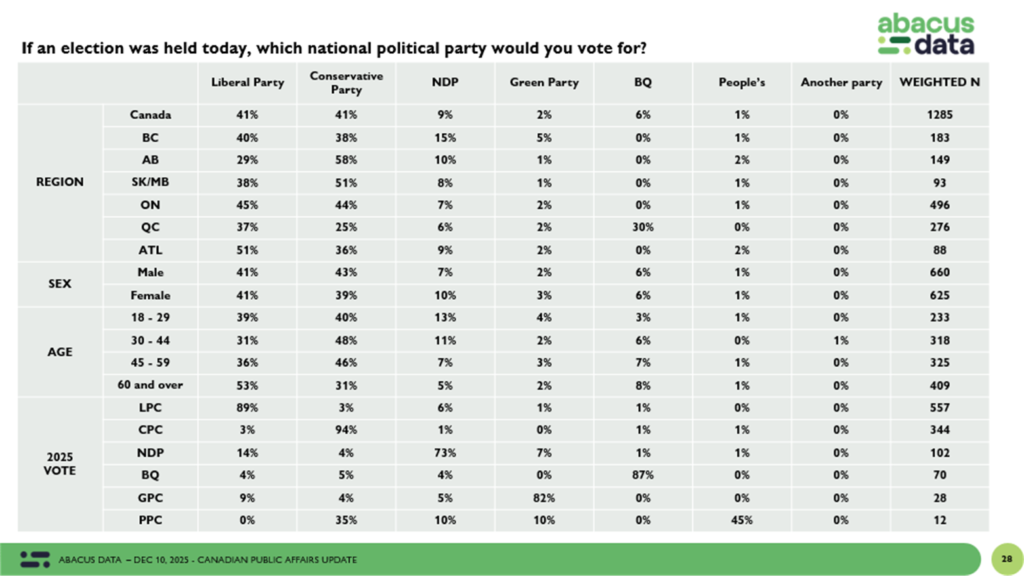
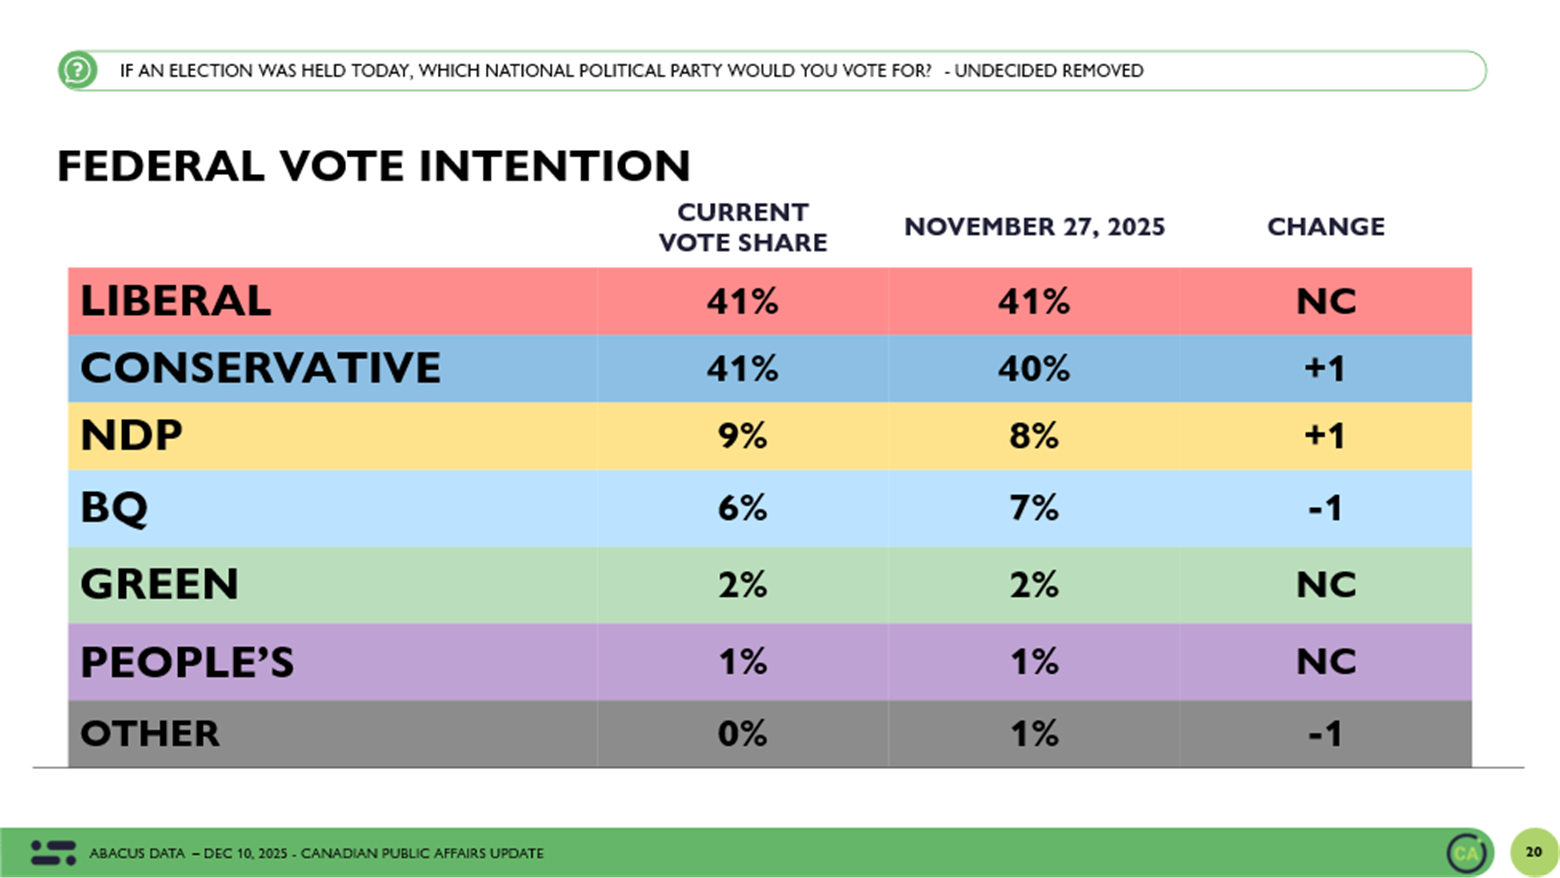
Vote Intention: Deadlocked as the Year Ends
If an election were held today, the Liberals and Conservatives would each receive 41 percent of the vote. That reflects no change for the Liberals and a one-point gain for the Conservatives since the last wave. The NDP is at 9 percent, the Bloc Québécois at 6 percent, the Greens at 2 percent, and the People’s Party at 1 percent.
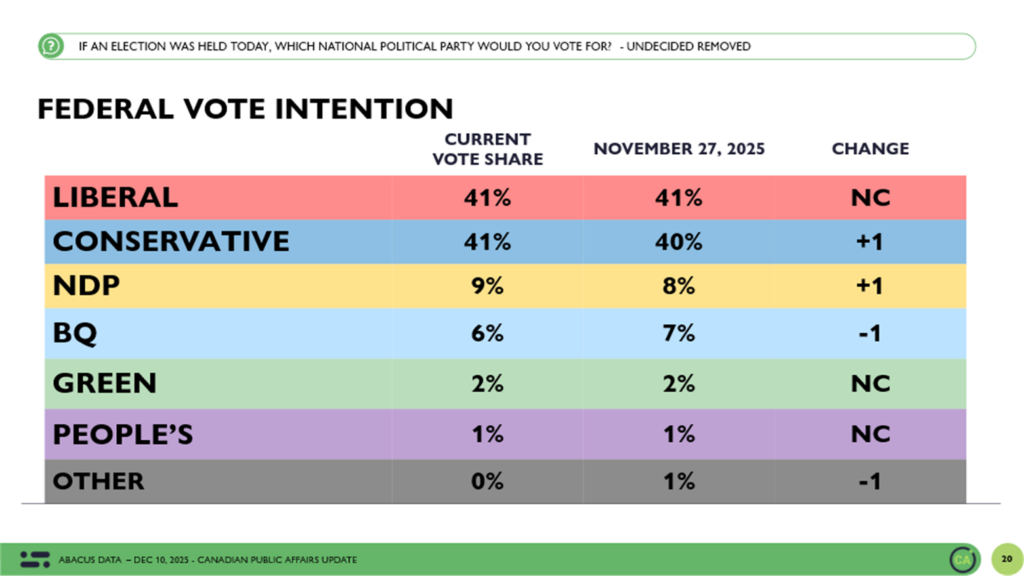
Among the most committed voters, the Liberals hold a narrow one-point lead. These numbers underscore how little movement has occurred in recent weeks and how durable the core support for both major parties has been.
Regional and Demographic Patterns Hold
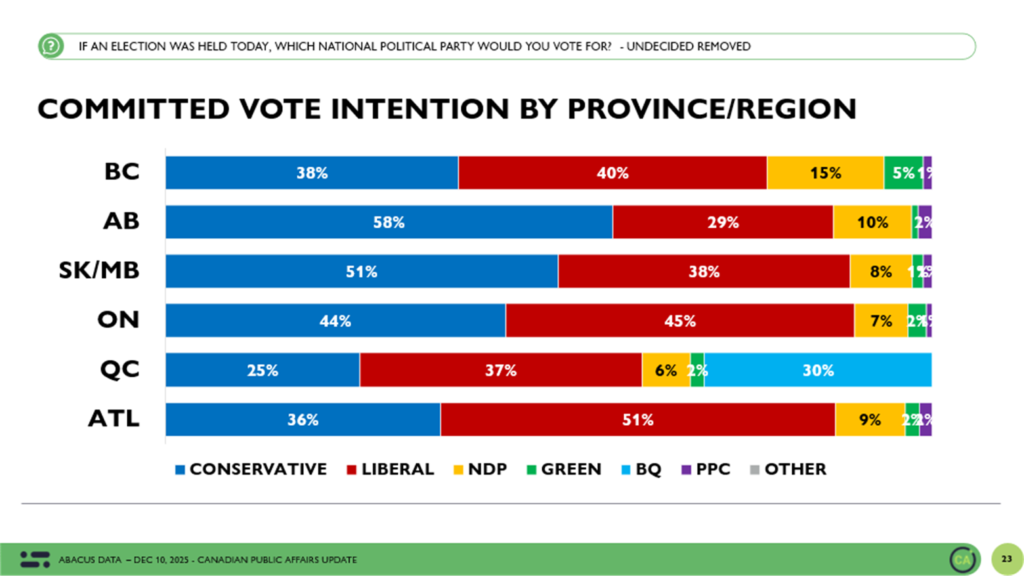
In Ontario, the Liberals lead by a single point over the Conservatives, 45 to 44. In Quebec, the Bloc holds 30 percent, with the Liberals at 37 percent and the Conservatives at 25. In British Columbia, the race remains competitive, with the Liberals at 40 percent, the Conservatives at 38 percent, and the NDP at 15. The Conservatives dominate in Alberta, where they sit at 58 percent compared to 29 percent for the Liberals. In Saskatchewan and Manitoba, the Conservatives lead 51 to 38. In Atlantic Canada, the Liberals continue to perform strongly, leading the Conservatives 51 to 36.
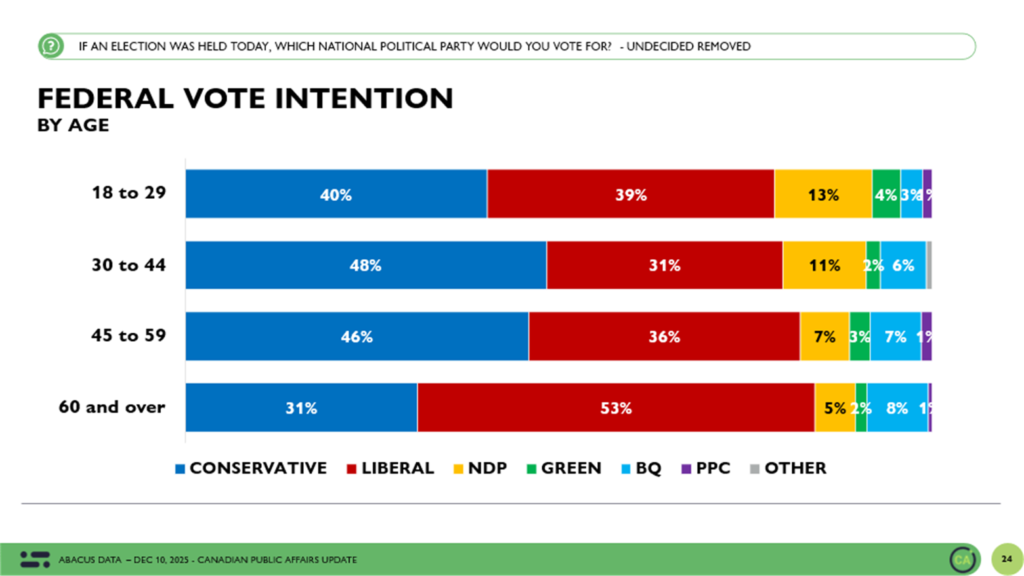
Age continues to define the electoral divide. Among those aged 18 to 29, the parties are virtually tied. Among voters 30 to 44, the Conservatives lead the Liberals by 17 points, 48 to 31. That pattern continues among voters aged 45 to 59, with the Conservatives leading 46 to 36. Among Canadians aged 60 and over, the Liberals lead by 22 – 53 to 31.
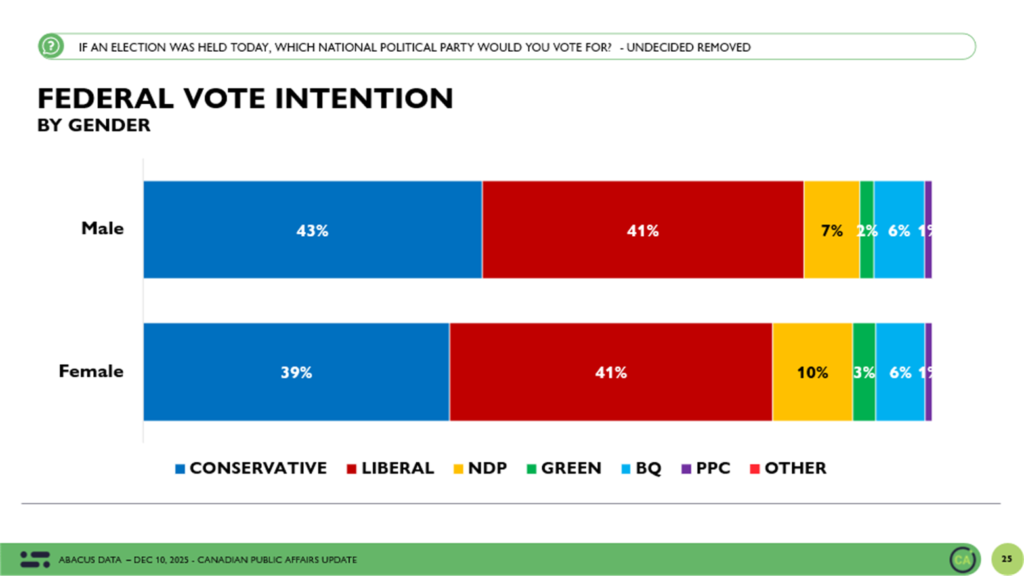
Men lean Conservative by a margin of 43 to 41. Women lean Liberal by the same margin.
Issue Ownership: Each Party Holds Key Terrain
When asked which party would best handle the top priorities, a clear divide emerges. The Liberals lead among those prioritizing economic growth (by 3), healthcare (by 8), and on homeownership and housing affordability (by 3).
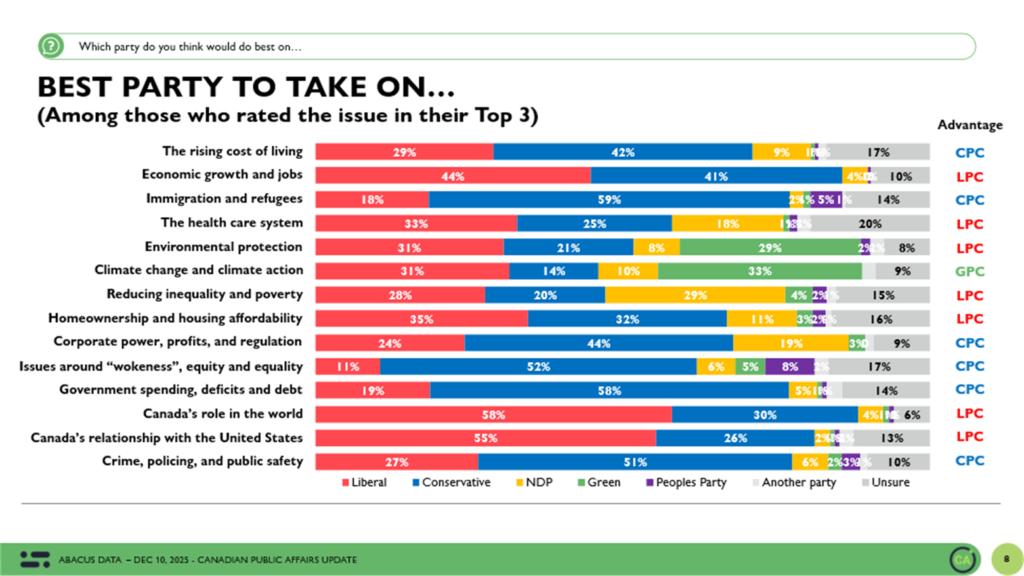
The Conservatives in contrast lead by a significant 13 points among those prioritizing the cost of living, and by 41 points among those who rate immigration as a priority. They also lead on government spending and crime.
These findings reflect a political environment divided not just by party preference, but by competing policy narratives and value systems.
The Upshot
According to Abacus Data CEO David Coletto:
“As 2025 comes to a close, this final wave offers a clear view of where things stand after a year of political transition, economic anxiety, and shifting global dynamics. The political environment remains deeply competitive, with no party holding a clear upper hand and very little evidence of meaningful momentum.
Despite a fall budget, a new federal-provincial agreement on pipelines, and trade talks with the U.S. on hold, vote intention remains deadlocked. Canadians continue to express mixed feelings about both the direction of the country and the leaders vying to shape it. While Mark Carney remains more personally popular than Pierre Poilievre, his negatives have risen, suggesting that any post-budget window of goodwill may be closing. Meanwhile, Poilievre’s numbers remain largely static, underscoring how entrenched public views of him have become.
Policy remains the key dividing line. The Conservatives dominate among those focused on immigration, government spending, and the cost of living — the latter being the single most important issue across the electorate. The Liberals, on the other hand, hold the advantage on healthcare, economic growth, and housing. These splits reveal that while both parties have clear strengths, they are appealing to voters with very different expectations of government.
Generational divides also continue to shape the landscape. The Liberals perform well among younger and older Canadians, while the Conservatives lead among working-age voters between 30 and 59. Regionally, the Liberals retain solid leads in Ontario, Quebec, and Atlantic Canada, while the Conservatives continue to dominate in Alberta and the Prairies. British Columbia remains highly competitive, as it has been throughout the year.
What we’re left with is a political environment that is stable but uncertain. Canadians are attentive but cautious. The race remains tight, the electorate remains divided, and the issues Canadians care most about continue to reflect both economic stress and concern about Canada’s place in the world.
We will return in early 2026 with new segmentation work that provides deeper insight into how different groups of voters are navigating this landscape — and what that might mean for the year ahead.”
Methodology
The survey was conducted with 1,500 Canadians from December 5 to 9, 2025. A random sample of panelists were invited to complete the survey from a set of partner panels based on the Lucid exchange platform. These partners are typically double opt-in survey panels, blended to manage out potential skews in the data from a single source.
The margin of error for a comparable probability-based random sample of the same size is +/- 1.53%, 19 times out of 20.
The data were weighted according to census data to ensure that the sample matched Canada’s population according to age, gender, and region. Totals may not add up to 100 due to rounding.
This poll was paid for by Abacus Data