
Sequencing data characterisation
A total of 1,695,573 ITS1 amplicon sequence reads were obtained from 27 samples, with an average of 62,799 reads per sample. After quality control using the EasyAmplicon pipeline, an average of 61,425 clean reads were retained. The sequences were taxonomically classified into fungal ASVs based on the UNITE database, resulting in 879 ASVs for RT, 978 ASVs for RS, and 996 ASVs for BS, respectively. Six fungal ASVs were identified as contaminants using MicroDecon26 and were removed from the dataset. Sequentially, the rarefaction curves were drawn to analyze the sequencing depth. Our results showed that as the sequencing depth gradually deepened, the species richness curve gradually flattened, indicating that the sequencing depth could truly reflect the composition of the entire fungal microbiome (Supplementary Fig. 1).
Alpha diversity
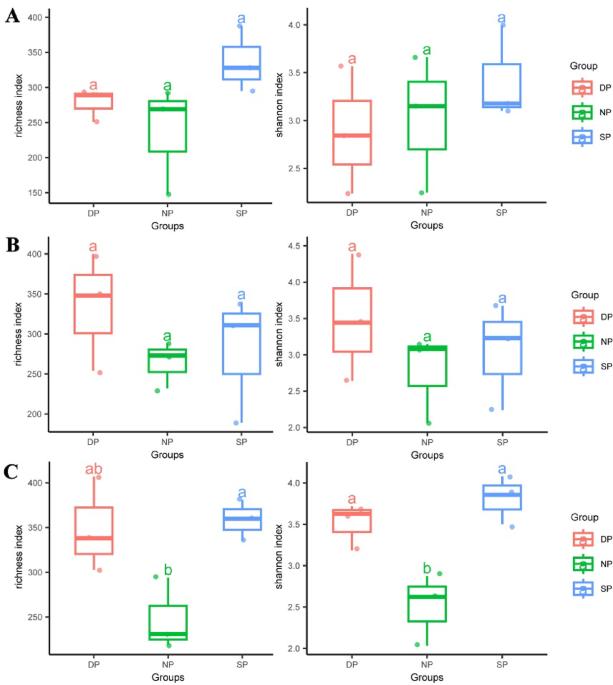
Species richness and Shannon indices were used to analyze the alpha diversity of RT, RS, and BS in C. cathayensis trees. In RT, the species richness indices for the DP, NP, and SP were 278, 236, and 337, respectively (Fig. 1A). The Shannon indices for the DP, NP, and SP were 2.88, 3.02, and 3.42, respectively (Fig. 1A). No significant difference were observed between the species richness and Shannon indices of the DP, NP, and SP groups (Fig. 1A). In RS, both the species richness and Shannon indices followed a same trend. The richness indices for the DP, NP, and SP were 334, 264, and 280, respectively (Fig. 1B), and the Shannon indices were 3.49, 2.76, and 3.05, respectively (Fig. 1B). In BS, the richness indices for the DP, NP, and SP were 349, 248, and 359, respectively (Fig. 1C), and the Shannon indices were 3.51, 2.51, and 3.81, respectively. Significant differences were found between these groups (P < 0.05) (Fig. 1C).
Fig. 1
The Richness and Shannon indices in (A) RT, (B) RS, and (C) BS samples. RT, RS, and BS are root tissue, rhizosphere soil, and bulk soil, respectively. DP, NP, and SP represent dead, healthy, and diseased C. cathayensis trees, respectively. The first (25%), third (75%) and median quartiles of each data set are shown in the box plots. Significant differences (P < 0.05) between datasets are indicated in lowercase.
Beta diversity
Beta diversity of RT, RS, and BS in C. cathayensis trees was analyzed using Constrained PCoA based on Bray–Curtis distance. In RT, the results indicated differences in fungal community beta diversity among the DP, NP, and SP groups (P = 0.06), explaining 26.8% of the variance (Fig. 2A). In RS, fungal communities also exhibited differences between the DP, NP, and SP groups (P = 0.1), accounting for 26.4% of the variation, although the difference was not statistically significant (Fig. 2B). Similarly, differences were observed in fungal communities between the DP, NP, and SP groups of BS (P = 0.18), which accounted for 26.5% of the variation (Fig. 2C).
Fig. 2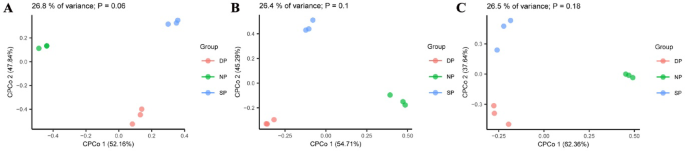
Bray-Curtis distances of (A) root tissue, (B) rhizosphere soil, and (C) bulk soil plotted using constrained PCoA. Each point is coloured by the different group of dead, healthy, and diseased trees. Dead, healthy, and diseased trees are abbreviated DP, NP, and SP, respectively.
Composition of the fungal community in NP, SP, and DP groups
The healthy (NP), diseased (SP), and dead (DP) C. cathayensis trees were further divided into RT, RS, and BS groups to better analyze differences in fungal communities. The top 10 fungi at the phylum and genus level are shown in Fig. 3. In the NP group, the top 10 abundant fungal phyla across RT, RS, and BS specimens were Basidiomycota (36.97–78.80%), Ascomycota (14.73–55.63%), Rozellomycota (0.37–1.94%), Mortierellomycota (1.05–1.20%), Chytri-diomycota (0.09–0.15%), Mucoromycota (0.00–0.09%), Glomeromycota (0.00–0.09%), Aphelidiomycota (0.01–0.04%), and Zoopagomycota (0.00–0.01%) (Fig. 3A). Although the ranking of the top 10 fungal communities was basically the same across RT, RS, and BS groups, their relative abundances varied significantly. For example, Basidiomycota was most abundant in the RS and BS groups, whereas Ascomycota dominated the RT group. Interestingly, the combined proportion of Basidiomycota and Ascomycota in RT, RS, and BS groups was 92.59,93.53, and 93.63%, respectively, making them the two largest fungal phyla (Fig. 3A). The top 10 fungal genera in the NP group for RT, RS, and BS specimens included Scleroderma (5.16–16.83%), Russula (6.11–11.33%), Lactarius (1.99–11.24%), Laccaria (0.11–10.83%), Phlyctis (2.76–8.63%), Inocybe (0.75–6.51%), Arxiella (0.05–10.36%), Tomentella (2.04–3.81%), and Hymenogaster (1.04–3.34%) (Fig. 3B).
Fig. 3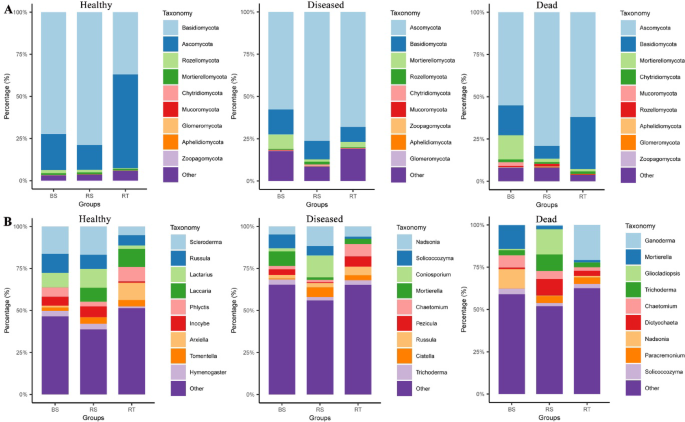
Top 10 dominant fungi relative abundance in different groups of C. cathayensis trees. Comparison of the 10 most abundant fungi at the (A) phylum level and (B) genus level in healthy, diseased, and dead trees. RT, RS, and BS refer to root tissue, rhizosphere soil, and bulk soil, respectively.
The top 10 fungal phyla in RT, RS, and BS specimens from the SP group were Ascomycota (57.77–76.23%), Basidiomycota (8.76–14.69%), Mortierellomycota (1.42–8.67%), Rozellomycota (0.35–1.62%), Chytri-diomycota (0.39–0.85%), Mucoromycota (0.07–0.25%), Zoopagomycota (0.02–0.19%), Aphelidiomycota (0.06–0.08%), and Glomeromycota (0.03–0.06%) (Fig. 3A). Similarly, the top 10 fungal genera in these samples were Nadsonia (4.82–11.67%), Solicoccozyma (1.29–8.19%), Coniosporium (0.00–13.05%), Mortierella (1.41–8.65%), Chaetomium (1.42–7.32%), Pezicula (0.46–6.18%), Russula (2.18–5.07%), Cistella (0.55–5.77%), and Trichoderma (1.99–3.10%) (Fig. 3B).
In the DP group, the top 10 dominant fungal phyla in RT, RS, and BS specimens were Ascomycota (55.20–79.10%), Basidiomycota (7.55–30.73%), Mortierellomycota (1.40–14.25%), Chytridiomycota (0.98–1.70%), Mucoromycota (0.02–2.20%), Rozellomycota (0.32–1.39%), Aphelidiomycota (0.06–0.38%), Glomeromycota (0.04–0.25%), and Zoopagomycota (0.00–0.31%) (Fig. 3A). The top ten fungal genera in these samples were Ganoderma (0.16–20.81%), Mortierella (1.32–14.01%), Gliocladiopsis (0.16–14.91%), Trichoderma (2.74–9.77%), Chaetomium (2.10–7.27%), Dictyochaeta (0.92–9.76%), Nadsonia (0.34–11.29%), Paracremonium (0.18–4.08%), and Solicoccozyma (1.86–3.34%) (Fig. 3B).
Fungal community composition comparison
After identifying the fungal community composition in healthy, diseased, and dead C. cathayensis trees, we compared the fungal community composition of healthy, diseased, and dead C. cathayensis across the RT, RS, and BS groups to accurately analyze the presence of potentially pathogenic microorganisms (Fig. 4). In the RT group, the top 10 fungal phyla in the dead, diseased, and healthy trees were Ascomycota, Basidiomycota, Mortierellomycota, Chytridiomycota, Rozellomycota, Glomeromycota, Aphelidiomycota, Mucoromycota, and Zoopagomycota (Fig. 4A). Notably, the relative abundance of the top nine fungal phyla in diseased trees (77.83%) was lower than that in healthy (94.81%) and dead trees (93.32%) (Fig. 4A). The dominant fungal genera in these samples were Ganoderma, Russula, Laccaria, Arxiella, Phlyctis, Chaetomium, Pezicula, Nadsonia, and Mortierella (Fig. 4B). Interestingly, the total relative abundance and fungal composition of the top 9 fungal genera differed between healthy, diseased, and dead trees in the RT group (Fig. 4B).
Fig. 4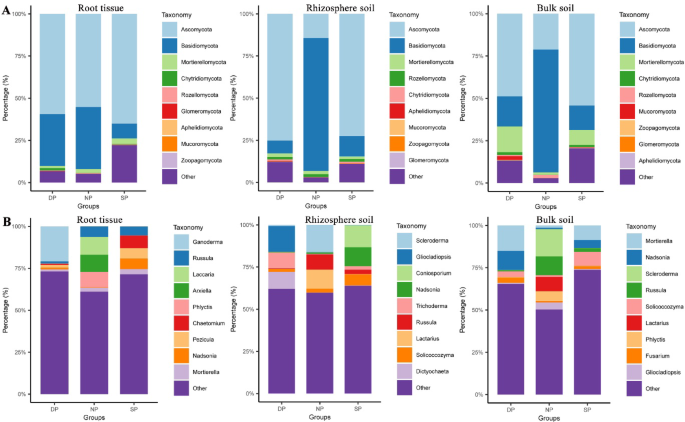
Top 10 dominant fungi relative abundance across different ecological niches. Comparison of the 10 most abundant fungi at the (A) phylum level and (B) genus level in root tissue, rhizosphere soil, and bulk soil. Dead, healthy, and diseased trees are abbreviated as DP, NP, and SP, respectively.
In the RS group, the top ten fungal phyla in dead, diseased, and healthy trees were also dominated by Ascomycota, Basidiomycota, Mortierellomycota, Rozellomycota, Chytridiomycota, Aphelidiomycota, Mucoromycota, Zoopagomycota, and Glomeromycota (Fig. 4A). It is noteworthy that the total relative abundances and fungal compositions of the top 9 fungal genera in dead and diseased trees in the RS group were similar, but significantly different from those in healthy trees (Fig. 4A). Furthermore, the fungal community compositions in healthy, diseased, and dead trees in the RS group differed in terms of the top 9 fungal genera (Fig. 4B).
A similar trend was also found in the BS group as well. The total relative abundances and fungal compositions of the top 9 fungal genera in dead and diseased trees in the BS group were similar but different from those in healthy trees (Fig. 4A). Additionally, there were significant differences in the total relative abundances and fungal compositions among healthy, diseased, and dead trees in the BS group (Fig. 4B).
Variance of fungal communities
To reveal the effects of fungal communities on the health status of C. cathayensis trees, we compared the variation of fungal communities across healthy, diseased, and dead trees at the RT, RS, and BS levels (Fig. 5 and Supplementary Tables 1, 2, 3). In the root tissue group, the abundance of 29 fungal genera was significantly depleted, while 28 fungal genera were enriched in the DP group compared to the NP group (Fig. 5A and Supplementary Table 1) (P < 0.01). Similarly, 29 fungal genera were significantly depleted and 23 fungal genera were enriched in the SP group compared to the NP group (Fig. 5B and Supplementary Table 1) (P < 0.01). In addition, there were 19 depleted and 25 enriched fungal genera between the DP and SP groups (Fig. 5C and Supplementary Table 1) (P < 0.01).
Fig. 5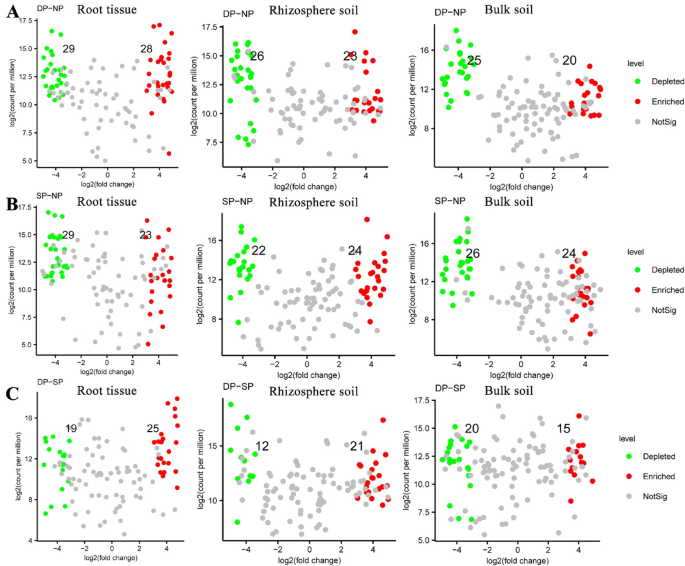
Variation in fungal abundance in root tissue, rhizosphere soil, and bulk soil samples. Changes in fungal communities in root tissue, rhizosphere soil, and bulk soil samples from (A) dead trees and (B) diseased trees compared to healthy trees, respectively. (C) Changes in fungal communities in root tissue, rhizosphere soil, and bulk soil samples from dead trees compared to diseased trees. fold-change > 2, P < 0.01. The numbers in the figure correspond to the quantities of green and red dots, which represent fungal ASVs that are significantly depleted and enriched, respectively. Dead, healthy, and diseased trees are abbreviated as DP, NP, and SP, respectively.
In the rhizosphere soil group, the abundance of 26 fungal genera was depleted, and 23 fungal genera were enriched in the DP group compared to the NP group (Fig. 5A and Supplementary Table 2). In the SP group, the abundance of 22 fungal genera was significantly depleted, and 24 fungal genera were enriched compared to the NP group (Fig. 5B and Supplementary Table 2). Additionally, 12 fungal genera were depleted, and 21 fungal genera were enriched between the DP and SP groups (Fig. 5C and Supplementary Table 2) (P < 0.01).
In the bulk soil group, 25 fungal genera were depleted, and 20 fungal genera were significantly enriched in the DP group compared to the NP group (Fig. 5A and Supplementary Table 3). In the SP group, 26 fungal genera were depleted, and 24 fungal genera were enriched compared to the NP group (Fig. 5B and Supplementary Table 3). Similarly, there were 20 depleted and 15 enriched fungal genera between the DP and SP groups (Fig. 5C and Supplementary Table 3) (P < 0.01).
Finally, We compared the common fungal communities of healthy, diseased, and dead C. cathayensis trees at the RT, RS, and BS levels (Fig. 6 and Supplementary Tables 4, 5, 6). In the root tissue group, a total of 13 fungal genera were shared between the NP, SP, and DP trees. Notably, 14 fungal genera were shared between the DP and SP trees (Fig. 6A and Supplementary Table 4). Likewise, a total of 17 fungal genera were shared between the NP, SP, and DP trees in the rhizosphere soil group, while 18 fungal genera were shared between the DP and SP trees (Fig. 6B and Supplementary Table 5). In the bulk soil group, 40 fungal genera were shared between the DP and SP trees. Additionally, 14 fungal genera were shared between the NP, SP, and DP trees (Fig. 6C and Supplementary Table 6).
Fig. 6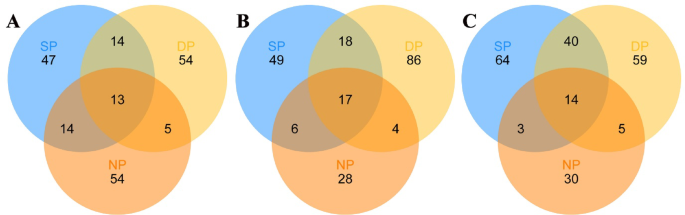
The common fungi in (A) root tissue, (B) rhizosphere soil, and (C) bulk soil of different tree groups shown in Venn diagrams. The numbers in the figure represent the number of fungal ASVs. DP, NP, and SP represent dead, healthy, and diseased trees, respectively.
Microbiome Co-occurrence networks in NP, SP, and DP groups
To explore the differences in microbial network structures in the soil at the roots of healthy, diseased, and dead C. cathayensis trees, we analyzed previously published bacterial amplicon data5 and fungal amplicon data to calculate the topological characteristics of their co-occurrence networks. In the bacterial network, the soil from dead C. cathayensis trees contained 4131 nodes and 7254 edges, which was higher than the numbers found in the soil of healthy and diseased trees (Fig. 7A). For the fungal network, the soil from diseased C. cathayensis trees had 791 nodes and 768 edges, surpassing the soil of both healthy and dead trees in terms of network size (Fig. 7B). A network vulnerability analysis further revealed that the bacterial network in the soil of diseased C. cathayensis trees was more vulnerable, while the fungal network in the soil of healthy trees was more vulnerable (Fig. 7C,D). Additionally, we examined the cross-networks of bacteria and fungi in the root soils of healthy, diseased, and dead C. cathayensis trees. The soil from healthy trees possessed 1000 nodes and 992 edges, significantly more than those in the soil from diseased and dead trees (Table 1). Notably, the interaction between bacteria and fungi in the soil of healthy trees were predominantly positive, with very few negative correlation (Fig. 7E and Supplementary Data 1). In contrast, the soil of diseased and dead trees exhibited relatively independent bacterial and fungal networks, with fewer interactions and an approximately equal proportion of positive and negative correlations (Fig. 7E and Supplementary Data 2 and 3). The cross-network analysis indicated that a harmonious coexistence of bacteria and fungi in the root soils of C. cathayensis trees is crucial for preventing root rot disease.
Fig. 7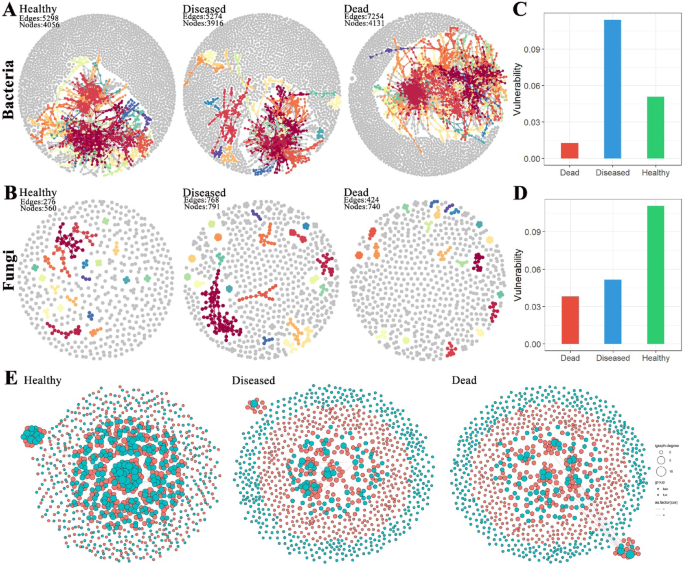
Ecological networks of microbial associations across different tree groups. (A) Bacterial network and (B) fungal network in the root soils of healthy, diseased, and dead C. cathayensis trees. Vulnerability of (C) bacterial networks and (D) fungal networks in the root soils of healthy, diseased, and dead C. cathayensis trees. (E) Bacterial-fungal cross-networks in the root soils of the healthy, diseased, and dead C. cathayensis trees. Each node represents an ASV and is colored according to its biological category, with pink denoting bacteria and blue denoting fungi. The size of each node corresponds to the degree of its respective ASV. Strong (R > 0.8) and statistically significant (P < 0.05) associations are indicated by connections between nodes.
Table 1 General characteristics of bacterial-fungal co-occurrence networks in healthy, diseased, and dead C. cathayensis trees.Distinction of the dominant fungal genera
To provide a comprehensive overview of the dominant fungal genera in dead, healthy, and diseased C. cathayensis trees, we present the top 70 dominant fungal genera in phylogenetic trees at the RT and RS group levels (Fig. 8). In the RT group, the dominant fungal genera of dead C. cathayensis trees included Ganoderma, Hymenopellis, Xylaria, Codinaea, Paracremonium, Penicillifer, Ilyonectria, and Mariannaea. In contrast, the dominant fungal genera in diseased C. cathayensis trees in the RT group were Nadsonia, Pezicula, Leotia, Humicola, and Chaetomium. Healthy C. cathayensis trees in the RT group were rich in Tomentella, Scleroderma, Laccaria, Amanita, Phlyctis, and Arxiella (Fig. 8A).
Fig. 8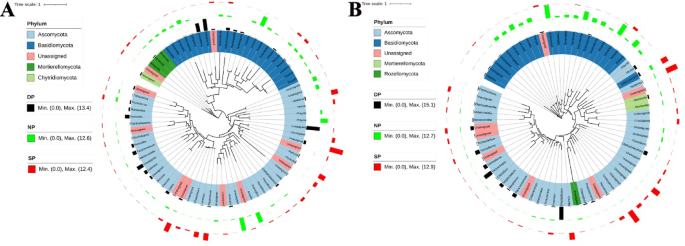
Taxonomic tree showing the relative abundance of the top 70 dominant fungi in (A) root tissue and (B) rhizosphere soil across different tree groups. Phyla within the tree are indicated by color ranges. The relative abundance of each ASV in dead, healthy, and diseased trees is represented by black, green, and red colored bars, respectively. iTOL was used to draw the taxonomic dendrogram. Dead, healthy, and diseased trees are abbreviated as DP, NP, and SP, respectively.
In the RS group, the dominant fungal genera in the soil of dead C. cathayensis trees included Peziza, Cladophialophora, Gliocladiopsis, Paracremonium, Dictyochaeta, Tolypociadium, and Trichoderma. Similarly, diseased C. cathayensis trees of the RS group were rich in Solicoccozyma, Nadsonia, Coniosporium, and Cistella. In the case of healthy C. cathayensis trees in the RS group, Hymenogaster, Laccaria, Inocybe, Scleroderma, Lactarius, and Russula were the dominant fungal genera (Fig. 8B).