

Canada’s export patterns have evolved amid efforts to diversify trade partners. Despite the decline in flows to the U.S., CUSMA continues to cover most U.S.-bound goods exports, providing duty free access. Meanwhile, product categories covered by industry-specific Section 232 tariffs, like steel and aluminium, are feeling the strain with significantly decreased flows. Looking beyond the U.S., we’ve seen a heavy rotation towards commodities and precious metals. The changing composition of exports has benefitted commodity producing provinces, adding a regional element to the trade outlook.
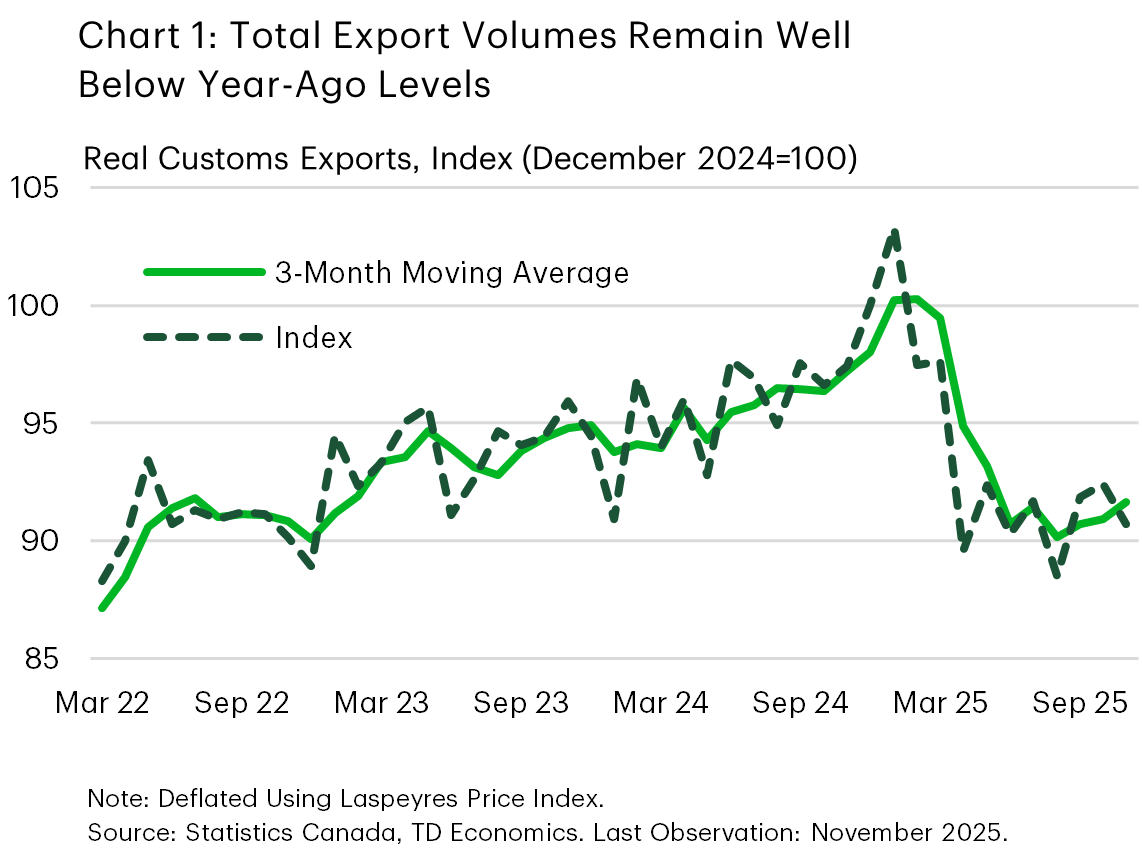
Through November, Canada’s total exports were down $1.0 billion (on a customs basis) relative to the first eleven months of 2024 (-0.1% year-on-year year-to-date, y/y YTD). However, this masks the extent of the shock, as rising gold prices and the surge of exports to the U.S. earlier this year to get ahead of the tariffs boosted the nominal year-to-date figure. Adjusting for prices, volumes are down 6.9% year-on-year (Chart 1), well below last year’s levels despite some momentum in recent months. This suggests that the front-running we saw at the start of the year to pre-empt U.S. tariffs has unwound and some of the demand for goods has likely been permanently lost.
Trade Partners Shift
The shift in export flows has been dramatic. Through November, exports to the U.S. are down $25.1 billion, despite the bulk (89%) of items still crossing the border being compliant with CUSMA and therefore exempt from tariffs. On a y/y basis, nominal flows are down 15.0%, dropping to levels last seen in late-2021 and early-2022.
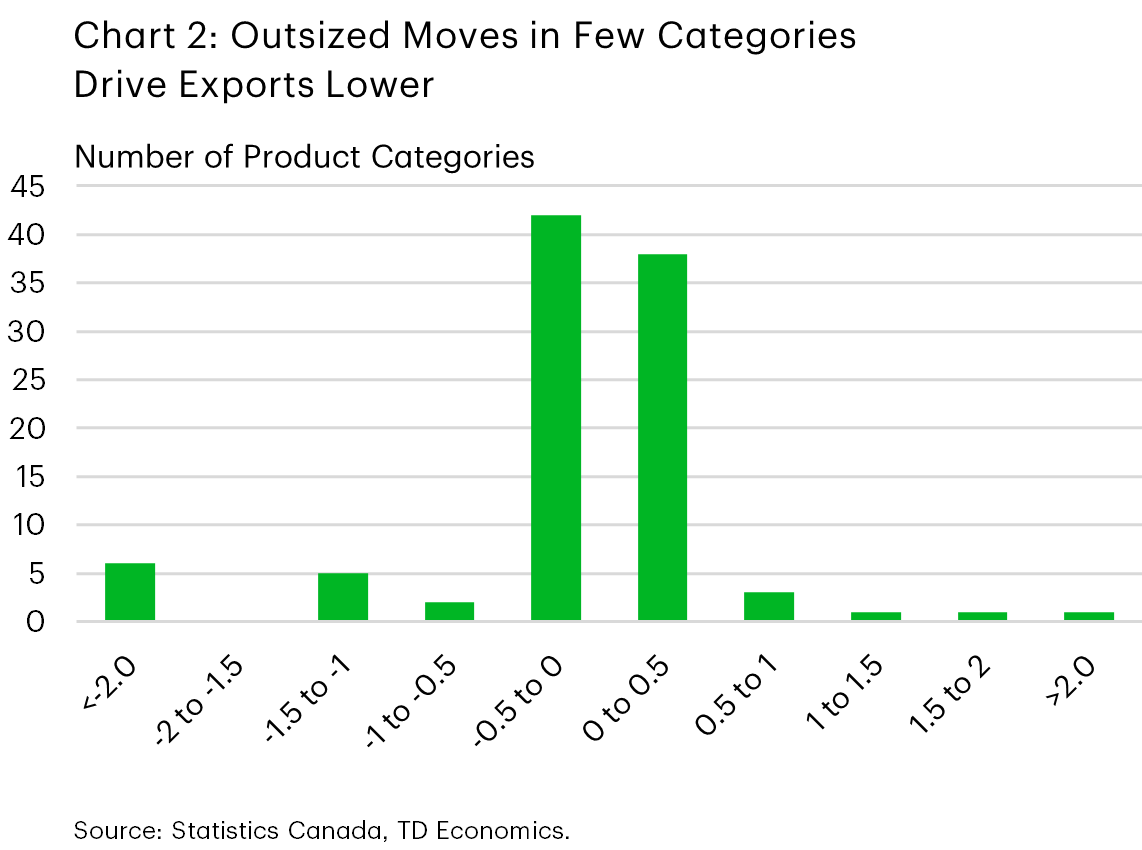
The picture by product is more nuanced. Given the coverage from CUSMA, it’s unsurprising that many product categories are posting minimal losses, or even outright gains. However, the outsized declines in a subset of products have driven the overall decline (Chart 2). It’s also possible that trade uncertainty could be hampering Canada/U.S. trade flows for products that aren’t tariffed, meaning that an opportunity for a better 2025 performance may have been missed.
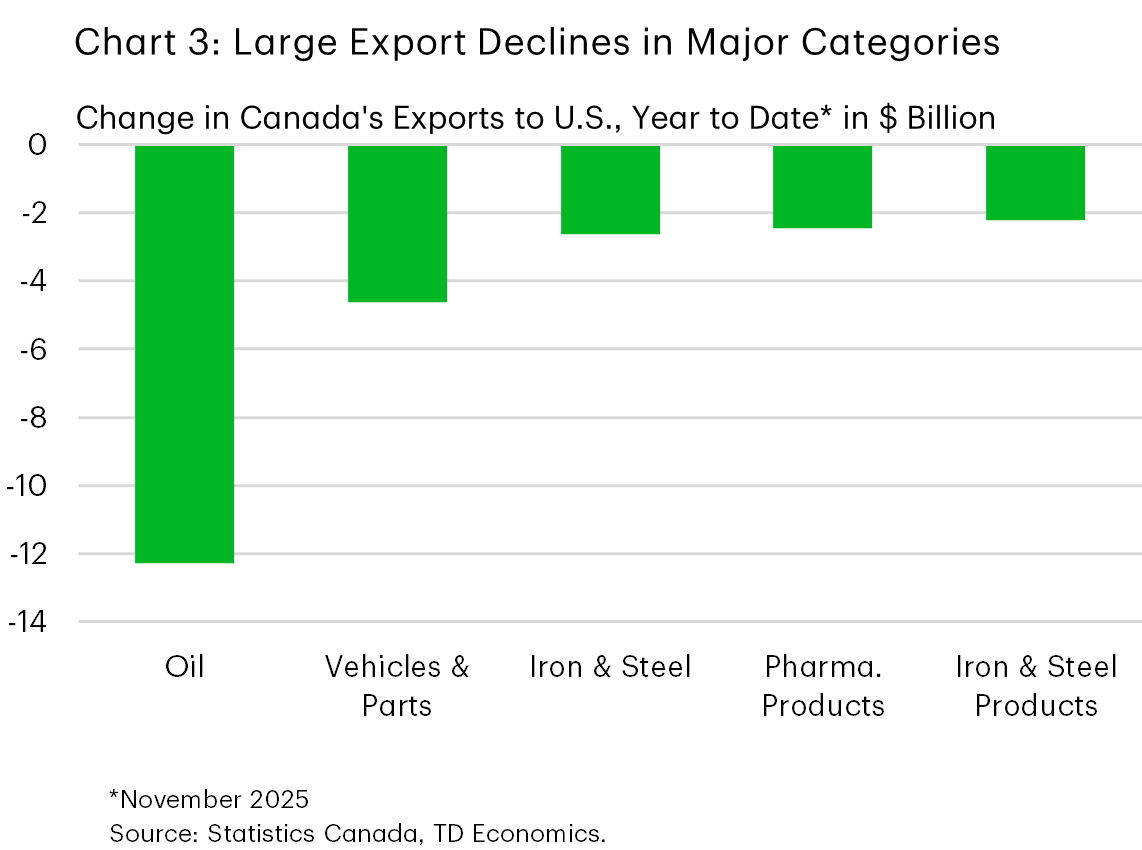
A large part of the outsized influence of few products is attributable to declines in oil exports, where year-to-date flows have fallen by $12.4 billion – although this is influenced by falling prices and temporary shutdowns at refineries. Moreover, goods categories covered by Section 232 tariffs like motor vehicles and their parts (-7.0 % y/y YTD), and iron, steel and their products (around 27.7% y/y YTD) have also recorded substantial declines (Chart 3).
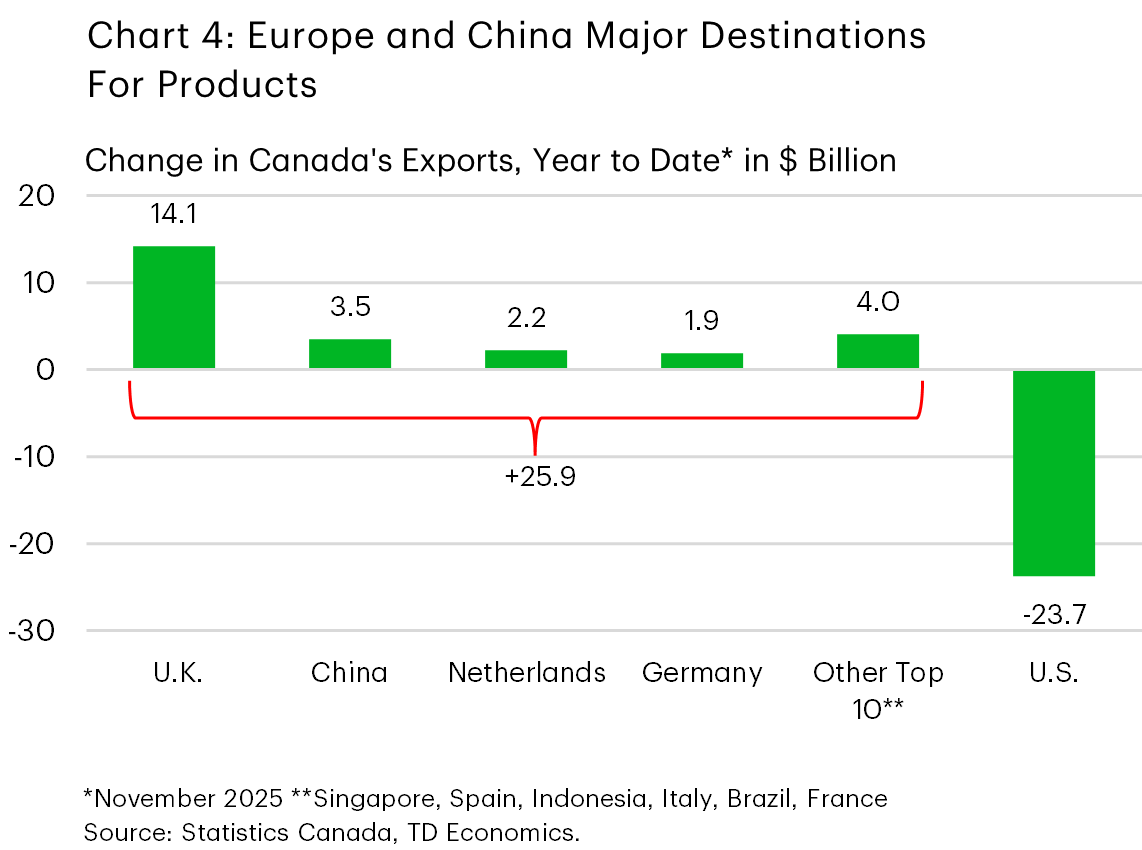
Meanwhile, exports to the rest of the world are up $24.1 billion, and again, a few outsized gains to select countries are powering the top line figure. Topping the leaderboard are exports to the UK (+$14.1 billion, mostly gold), China (+$3.5 billion), the Netherlands (+$2.2 billion), and Germany (+$1.9 billion) with another combined $4.0 billion flowing to Singapore, Spain, Indonesia, Brazil, France and Italy (Chart 4).
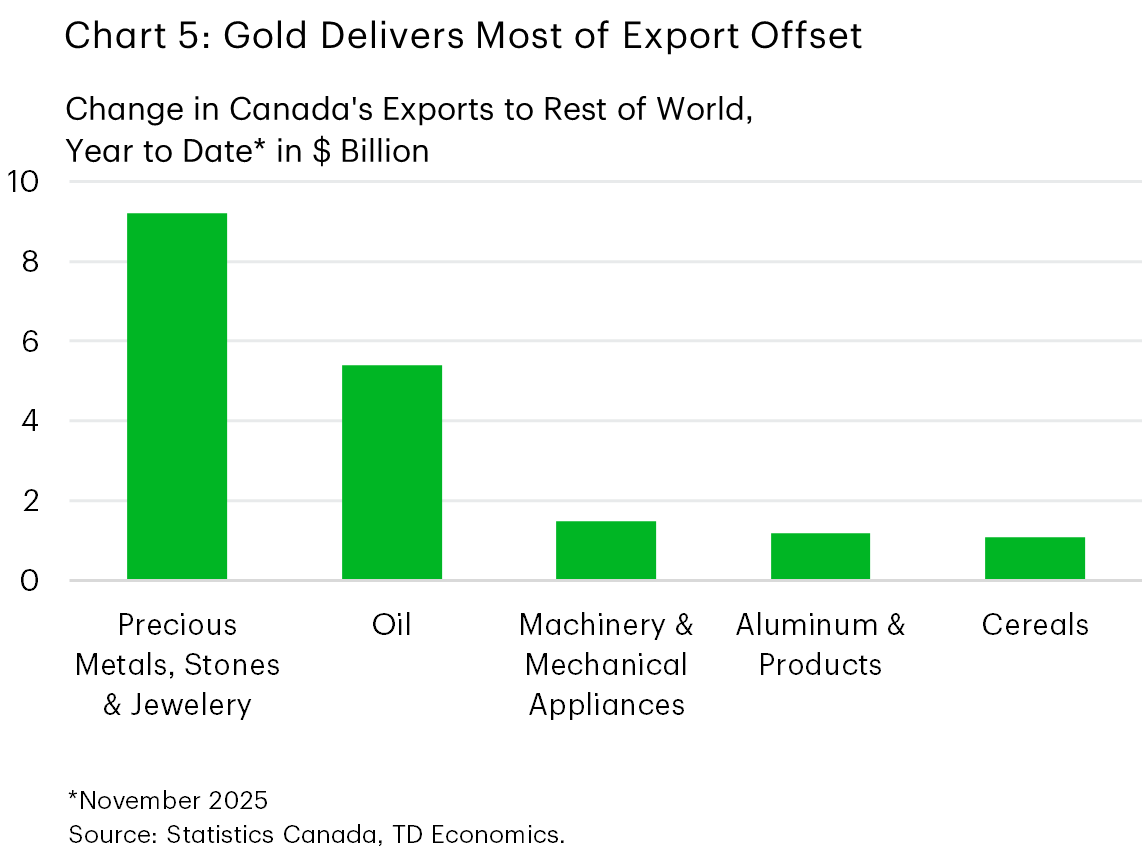
The increased traffic to other countries has been a nice-to-have for Canadian firms, but, importantly, the categories of products that have seen substantial declines into the U.S. are not a perfect match for those gaining elsewhere. This partially reflects a shift in the composition of exports away from many industrial products to agricultural and resource products (Chart 5).
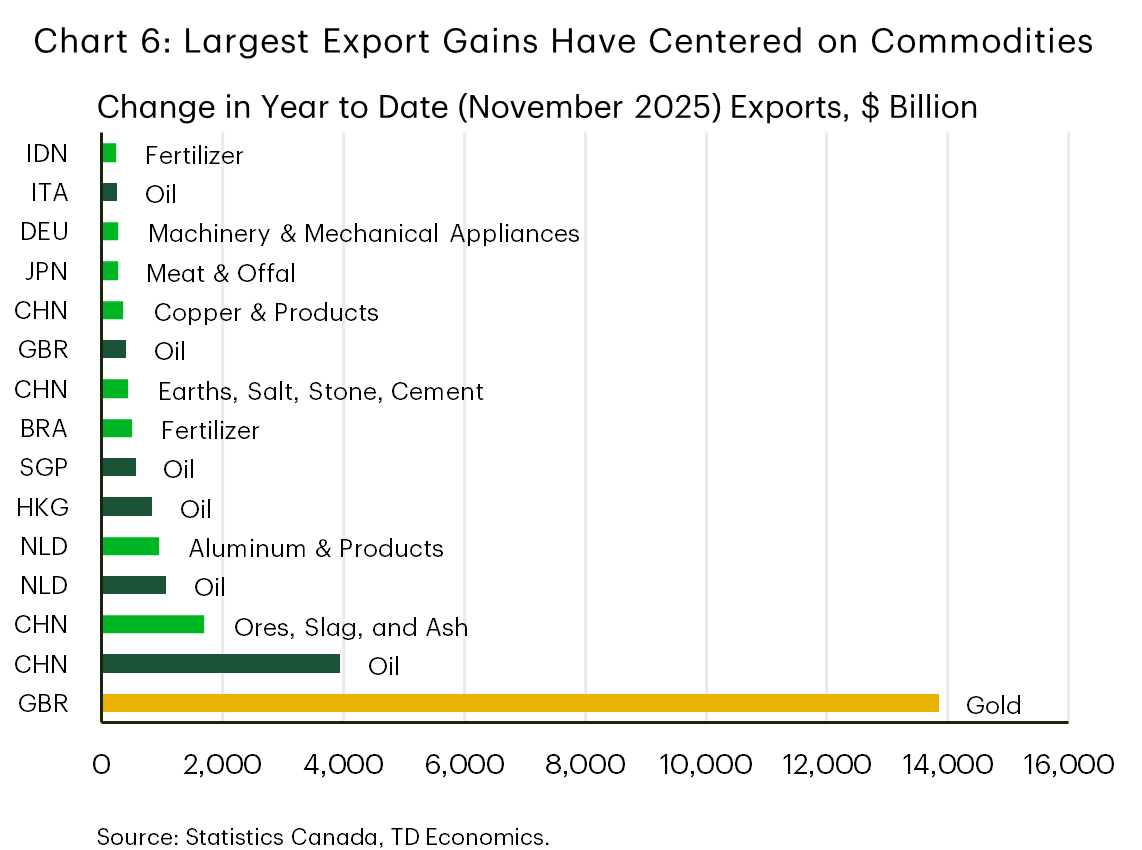
The focus then is on where the gainers are heading. Oil products have headed primarily to East Asia and Europe (Chart 6), while machinery and mechanical appliances are up $1.5 billion, with Germany, Singapore and France posting large gains. Aluminum’s gains have flowed mostly to Europe (Netherlands, Italy and Poland), while increased fertilizer flows have headed primarily to Brazil and Indonesia.
Provincial Breakdown
At the regional level, 7 of 10 provinces made headway in shipping their goods to markets outside of the U.S. (Chart 7). Notable gains were made by commodity producers like Alberta and Saskatchewan, while other, less commodity-intensive provinces lagged. For context, exports to all markets declined in 5 of 10 provinces with a flat performance in B.C.
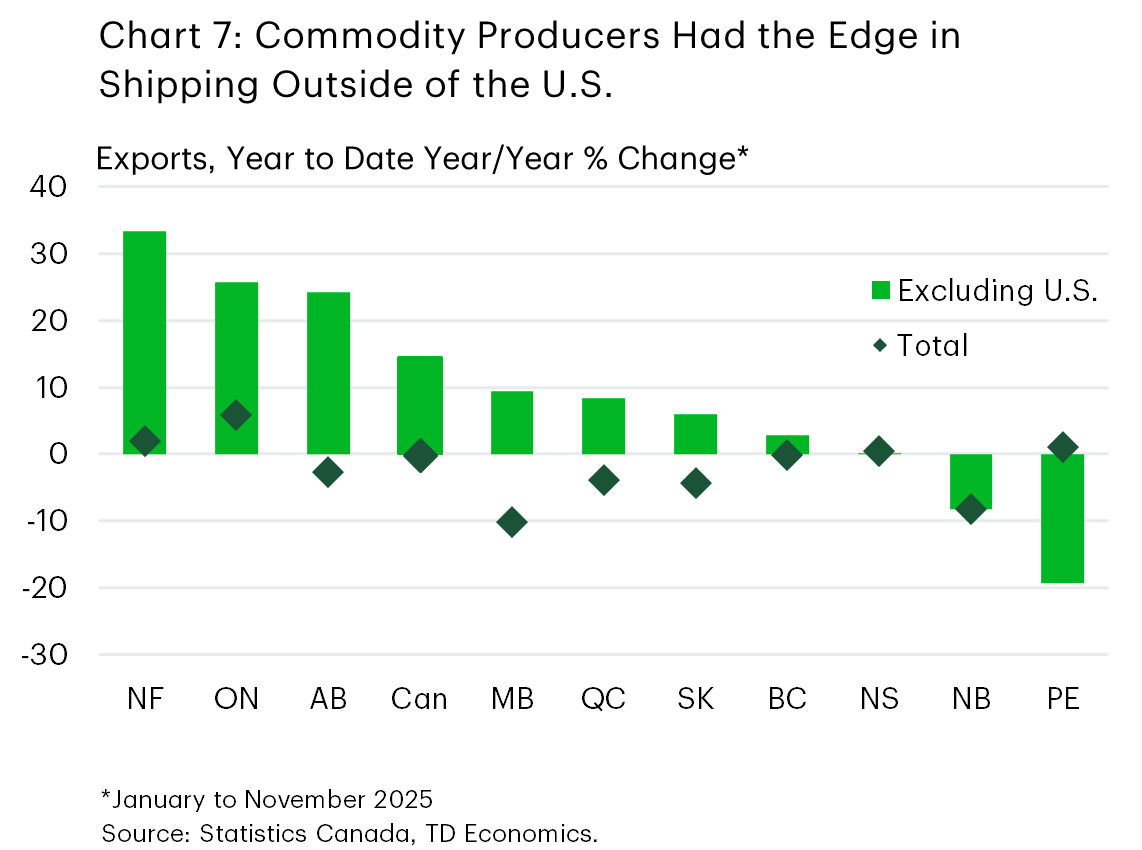
Leading the way were Newfoundland and Labrador, Alberta and Ontario, which saw nominal non-U.S. exports rise by about 25-35% last year. While this was a welcome boost to income for these provinces, blunting the narrative somewhat was the lack of export diversification. For instance, most of Newfoundland and Labrador’s gain was in crude oil. The province is playing an important role in supplying crude to Europe, avoiding disruptions from the U.S. In Alberta, shipments of crude oil to places like China accounted for the entire gain. It was the same story in Ontario, where nearly all the $14 billion increase (and then some) in non-U.S. exports was accounted for gold sent to the United Kingdom. And a big part of this increase was driven by a fortunate surge in prices.
Exporting was more diversified for Quebec, Saskatchewan and Manitoba, unlocking more moderate gains. Quebec’s exporters saw higher shipments of aluminum to the Netherlands and aerospace products to China and Germany, although aluminum values were lifted by robust price gains. Saskatchewan was able to ship more staples like potash, uranium, wheat and canola seed to Brazil, Japan, France and Mexico using well-established trading relationships for these products. The story was similar in Manitoba, which saw higher shipments of key exports like swine, canola seed, pharmaceuticals, and cooking oils. However, evidence points to Manitoba gaining new market share for pork products in countries like Japan and Mexico. In B.C., shipments of copper to China supported its increase.
Bottom Line
Canada’s trade landscape has shifted. To date, the trend appears to be expanding established relationships with partner countries (i.e. selling more to existing customers) rather than building out new linkages (rotating lost sales away from the U.S. market). This is as expected, as developing new markets would take time. Moving forward, healthy U.S. growth, some additional clarity on the future of CUSMA, and a push to develop trade relations with new partners could continue to shift the picture in the coming months and years.