Authors: Joanne Spalding1, Jacob L. Grazer2
1Department of Health & Human Performance, Georgia College & State University, Milledgeville, GA, USA
2Department of Exercise Science & Sports Management, Kennesaw State University, Kennesaw, GA, USA
Corresponding Author:
Joanne Spalding, PhD, CSCS, CPSS, ACSM-EP
231 West Hancock Street
Milledgeville, GA 31061
478-445-2135
Joanne Spalding, PhD is Assistant Professor in Exercise Science at Georgia College and State University. Her research interests include long term athletic development and monitoring at the club, high school, and college level with an emphasis on neuromuscular fatigue.
Jacob L. Grazer, PhD, CSCS, USAW-1, ACSM-EP is currently a faculty member in the Department of Exercise Science and Sport Management at Kennesaw State University. Jacob’s research interests include: accentuated eccentric loading, countermovement jump analysis, and sport technology.
ABSTRACT
Purpose: There has been a growing interest in American women’s college soccer with the majority of research focused on the NCAA Division I level. With 250+ Division II programs competing in 2024, there is an underrepresentation of this group in the literature. The purpose of this study is to examine the physical demands in Division II women’s soccer and analyze whether these physical demands vary by position.
Methods: Twenty-two Division II female soccer field players from one DII college team were monitored over an 18-match season wearing GPS devices, a technology that is more commonly used at prevalent at Division I universities. Field players were divided into one of four positions: (1) Center Back Defenders; (2) Outside Back Defenders; (3) Midfielders; and (4) Forwards. The GPS devices provided data on: (a) total distance traveled; (b) total distance traveled per minute; (c) high-speed running distance traveled per minute; and (d) sprint distance traveled per minute. Due to NCAA Division II substitution rules, the focus in this study is the relative variables calculated as distance traveled per minute.
Results: Descriptive statistics for each GPS measurement are calculated based on the position played. Then, Analysis of Variance (ANOVA) is used to identify any differences in player workload physical demands based on the position played. For distance traveled during a match, Center Back Defenders traveled the least distance compared to other positions. Similarly, for high-speed running distance, Center Back Defenders traveled the least distance compared to other positions. Finally, for Sprint Distance per minute, both Forwards and Outside Back Defenders traveled more distance compared to Center Back Defenders and Midfielders.
Conclusions: Findings suggest that the physical demands of Division II women’s soccer differ by position. Center Back Defenders tend to ‘stay at home’ and defend the goal while traveling less distance and sprinting less often. Forwards and Outside Back Defenders tend to spend more time sprinting compared to other players.
Applications in Sport: Coaches and practitioners can use this data when designing training programs to ensure their athletes are well-prepared for the differing physical demands of their sport based on the position played.
KEYWORDS: college soccer, GPS, match demands, women’s soccer, physical match performance
INTRODUCTION
Over the past several years, there has been an increase in the number of peer-reviewed research articles focusing on the physical demands of women’s soccer. The majority of the research that has been conducted has focused on athletes who compete at the professional and international levels (E. Choice et al., 2022). Recently, there has been a growing interest in American college women’s soccer, with the majority of this research focused on National Collegiate Athletic Association (NCAA) Division I level. This can likely be attributed to the fact that wearable technology has become more prevalent at the collegiate Division I level making it easier to collect information regarding the physical demands experienced by female collegiate athletes. However, with 250+ Division II programs competing in the 2024 season, this significant population has been under-represented in research efforts to examine the physical demands on the athlete when competing. As such, further analysis is needed to better understand the physical demands on athletes participating in the various levels of collegiate women’s soccer.
Soccer is a high intensity, intermittent sport that requires running, jogging, walking, repeated sprints, jumping and change of direction (Al-Hazzaa et al., 2001; Bloomfield et al., n.d.; Wisløff et al., 2004). Matches consist of two 45-minute halves with a 15-minute halftime period. For international competition, the Fédération Internationale de Football Association (better known as FIFA) sanctions allow for five substitutions per game with a typical squad size of 26 players. However, NCAA soccer permits an unlimited number of players to be on the official roster during the regular season. Substitutions rules for the NCAA also differ from FIFA in that the number of substitutions is unlimited per game, and players are allowed to re-enter the match once in the second half. This difference is notable because it may influence the physical demands placed on players during match play.
Current literature has explored match play data at various playing levels and reports that there are differences in match-play demands at different levels in women’s soccer (E. Choice et al., 2022). A perspective review by Vescovi et al (2021) reported that there is a linear increase in total distance covered across playing levels ranging from youth (~7,500m), collegiate (~9,500m), to professional levels (~10,200m). A systematic review of women’s soccer also identified that playing demands increase between playing levels, and that there are positional differences in terms of total distance covered, high-speed running distance, and sprint efforts where midfielders covered greater total distances and sprint efforts compared to central defenders (Alexander, 2014; E. E. Choice et al., 2023).
Challenges arise when comparing research due to variations of inclusion criteria and determination of velocity thresholds. In addition to inclusion criteria varying, values are typically reported in total distances rather than relative to time spent playing on the field. As highlighted previously, the unique NCAA substitution rules make it challenging to fully grasp the physical demands that are placed on the athletes since it is uncommon for someone to play a full 90-minute match in women’s collegiate soccer. Due to the potential influence of substitution rules on physical demand, more research is needed to gain a greater understanding of the relative demands with respect to playing time.
Very few studies have investigated the match demands of NCAA DII women’s soccer (E. E. Choice et al., 2023; Gentles et al., 2018). Gentles et al. (2018) assessed and compared accelerometry data to data collected using GPS signal. Although total distance and distance covered in specific velocity zones were reported, statistical analyses were not made comparing playing positions. Whereas Choice et al., (2023) investigated the external and internal load of players, including positional and time-specific differences.
Due to the lack of research in women’s soccer in general, and specifically at the lower playing levels, there is a need for more research. The purpose of this study is to examine the physical demands in Division II women’s soccer and analyze whether these physical demands vary by position.
SOCCER TEAM ROLES AND ROLE EXPECTATIONS
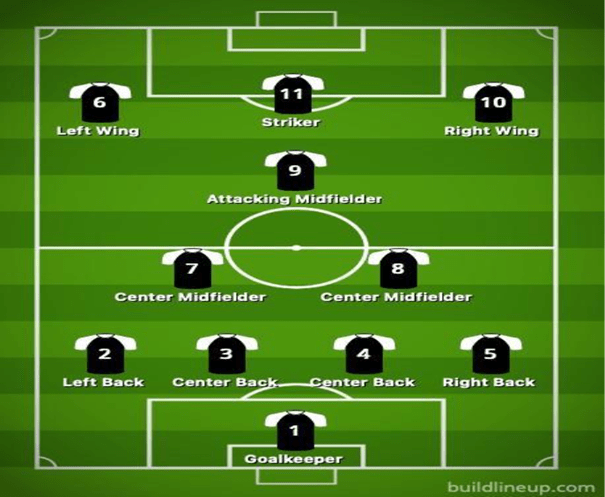
Given this study examines the possible differences in physical demands on soccer athletes based on the position played, it is advantageous to clearly outline each position and the expectation of athletes who play that position. Each position carries distinct responsibilities within a team’s formation and can change based on the formation. This study focused on a team that utilized the 4-3-3 formation where positions are separated into center backs, outside backs (right and left), midfielders (center and attacking), and Forwards (central striker and right/left wing) (see Figure 1).
Figure 1 – Visual Presentation of 4-3-3 Soccer Formation
Center Back Defenders
Center back defenders are primarily responsible for defensive organization and central coverage. When in a defensive scenario, center backs are responsible for defending the opposing forwards, intercepting through balls, contesting aerial duels and tackling to gain possession. In possession, center backs initiate playing out from the back, with passes to midfielders or out to forwards, and or switching play across the back line.
Outside Back Defenders
Outside backs (right and left) provide width for the back line and help with transitional play from the defensive half to the attacking half. Out of possession, outside backs typically deal with the opposing forward or winger depending on the opposition’s formation. Similar to center backs, outside backs with attempt to win aerial duels and tackles. In possession, outside backs will look to support the team by overlapping the forward, dribbling the ball up the field, delivering crosses and well as helping maintain possession in the attacking half.
Midfielders
The center midfielders are composed of two defensive midfielders and one attacking midfielder. The defensive midfielders attempt to shield the back line, break up opposition attacks, and in possession help to maintain and build possession from the defensive to attacking half. The attacking midfielder helps the forward and midfielders with defensive duties and in possession looks to support the forwards, maintain possession as well provide goals and assists.
Forwards
Forwards help to provide width and are important for stretching the oppositions defense. They will primarily defend the oppositions outside back and recover into midfield positions when out of possession. In possession they will aim to beat defenders one-on-one, deliver crosses and create shooting opportunities. When a player is in the central striker position, they are the focal point of the attacking line and are primarily there to convert scoring opportunities by finishing inside and around the 18-yard box. In possession, the central striker will look to hold the ball up allowing midfielders and other forwards to join the play. They will attempt to make runs to disrupt the defensive lines and apply pressure to the opposition center backs.
METHODS
Participants
A total of 22 NCAA Division II female soccer players participated in this study. Participants were athletes from a team already using a GPS athlete monitoring system. Players were assigned 1 of 4 positions by the team’s coaching staff (Sporis et al., 2009).
Center Backs (CB) (n = 4)
Outside Backs (OB) (n = 5)
Midfielders (MID) (n=6)
Forwards (FWD) (n= 7).
Procedures
A total of 18 regular season matches were included in this analysis from a single competitive season. Global Positional System (GPS) devices (TITAN Sports, Titan2, Houston, TX, USA) sampling at 10 Hz were used to track player movement during competition. Data included 234 observations (n= 79 FWD, n= 70 MID, n= 50 OB, n= 35 CB). The team used for this study played 1-4-3-3 formation (please note 1 = goalkeeper) during all matches included in the analyses. All matches were official NCAA matches with two 45-minute halves and a 15-minute halftime period. All players were informed of the risks and benefits of this study and voluntarily signed an informed consent. This study was approved by the Institutional Review Board.
Variables for Analysis
Data was collected on the following variables to better understand the physical demands on each player based on position played (see Andersson, 2010).
Total Distance – The total distance a player covers during a game. This value is needed to determine the distance covered related to minutes played.
Relative Total Distance (TDREL) – The distance covered per unit of time, expressed as meters per minute (m/min).
Relative High-Speed Running Distance (HSRREL) – Distance covered per minute while running at high speeds, in this case, over 15 kilometers per hour (km/h), or 9.3 miles per hour.
Relative Sprint Distance (SDREL) – Distance covered per minute while sprinting, usually above a higher threshold. In this case, over 18 kilometers per hour (km/h) or 11.2 miles per hour.
Using the Global Navigation Satellite System to Measure Match Load
GPS units were worn in a harness that secured the device between the scapulae (i.e., shoulder blades). The units were turned on 10 minutes before being placed in the harness to ensure sufficient GPS signal was attained per manufacturer’s instructions. Due to the substitution rules in NCAA college soccer, calculating the variables per minutes played was deemed the optimal solution for comparing workload across playing position.
RESULTS
Three separate one-way ANOVA analyses with Bonferroni corrections were conducted to determine if there were differences between positions for Total Distance (TDREL), High Speed Running Distance (HSRREL) and Sprint Distance (SDREL). Statistical analyses were performed in SPSS (Version 27.0.1). Alpha level was set at p <0.05. Eta-squared effect sizes were calculated to determine magnitude of differences for each variable. For pairwise comparisons, Cohen’s d effect sizes were calculated to determine magnitude of difference between playing positions (Hopkins, 2002). Descriptive statistics for match physical performance for this specific team are summarized in Table 1.
Table 1 – Match Performance Data
Variables Midfielders (n=70) Forwards (n=79) Outside Back Defenders (n=50) Center Back Defenders (n=35) Total (n=234) Minutes Played per Match 51.6 ± 13.6 52.8 ± 15.1 52.1 ±13.9 68.0 ±19.9 57.1 ± 15.6 Total Distance (m) 5,643.9 ± 1,435.0 5,507.9 ± 1,214.1 5,506.3 ±1,373.8 6365.1 ± 1884.9 Greatest total distance covered due to greatest minutes played5,855.8 ±1,476.8 Relative Total Distance (m/min) The distance covered per unit of time, usually expressed as meters per minute (m/min). 110.4 ± 14.2 Significantly greater than Center Back Defender106.8 ± 14.4 Significantly greater than Center Back Defender106.8 ±12.6 Significantly greater than Center Back Defender93.8 ± 11.6 105.9 ± 14.5 Relative High Speed Running Distance (m/min) Distance covered per minute while running at high speeds, in this case, over 15 kilometers per hour (km/h), or 9.3 miles per hour. 10.06 ± 3.45 Significantly greater than Center Back Defender12.96 ±4.01 Significantly greater than Center Back Defender 13.18 ± 4.21 Significantly greater than Center Back Defender7.53 ± 2.90 11.33 ± 4.26 Relative Sprint Distance (m/min) Distance covered per minute while sprinting, usually above a higher threshold. In this case, over 18 kilometers per hour (km/h) or 11.2 miles per hour3.45 ± 1.98 6.06 ± 2.64 Significantly greater than Center Back Defender Significantly different than Midfielders5.53 ± 1.85 Significantly greater than Center Back Defender Significantly different than Midfielders3.05 ± 1.92 4.72 ± 2.53
Relative Total Distance (TDREL)
A one-way ANOVA revealed a significant difference in positions for TDREL, F(3, 230) = 11.9, p = <0.001. An effect size (η2=0.135) indicated a medium effect. Post Hoc analysis indicated that there were mean differences between FWD and CB (p = <0.001), MID and CB (p = <0.001), and OB and CB (p = <0.001).
Relative High-Speed Running Distance (HSRREL)
There were statistically significant difference for HSRREL, F(3, 230) = 23.73 p < 0.001, with a large effect (η2=0.23). Post Hoc analysis showed mean differences between FWD and MID (p = <0.001), FWD and CB (p = <0.001), MID and OB (p = <0.001), MID and CB (p = <0.008) and OB and CB (p = <0.001) as seen in Figure 2.
Relative Sprint Distance (SDREL)
Finally, there were statistically significant differences for positions in SDREL, F=(3,230), 25.547, p <0.001 with a large effect η2=0.25 Post Hoc analysis revealed mean differences for FWD and MID (p = <0.001), FWD and CB (p = <0.001), MID and OB (p = <0.001), OB and CB (p = <0.001).
DISCUSSION
The purpose of this study is to determine the physical demands for NCAA Division II Women’s Soccer and to assess positional differences and physical demands relative to minutes played. The study’s results include the average demands during match play of each field position as previously shown in Table 1. The main findings of this study indicate that center backs accumulate the greatest total distance, however, this is mainly attributable to extended playing time as they frequently remained on the field 15-17 minutes longer than other positions. When normalized for minutes outside backs, midfielders and forwards covered greater total distance and high-speed running distance than center backs. In addition, outside backs and forwards demonstrated greater sprint distance per minute compared to both center backs and midfielders.
The average total distance covered for players included in analyses was 5,855 ± 1,476 meters, which differs from prior findings by Choice et al. (2023) who saw starters cover 9,463 ± 2,591 meters. It should be noted that the analysis by Choice et al. (2023) only included players who participated in over 50% of match play. Findings from this study are similar to results reported by Gentles et al. (2018) who reported findings of 5,480 ± 2,350 meters and average minutes played of 45.32 ± 26.01 which are similar to minutes played in this study. The maximum distance covered by an individual in this study was 9,810 meters, which is much lower than distance covered by the sample in Gentles (13,850 meters) and Choice (12,054 meters), but similar to distances reported in Division I athletes, 9,786 meters (Sausaman, 2019). Both maximum and average distance covered varied across levels may indicate that more research is needed across differing playing levels. Also, from a practical point of view, this should help sport practitioners implement appropriate programs that develop players for both maximum and mean distances, regardless of minutes played.
To our knowledge, this is the first study to report TDREL (105 ± 14.5 m/min), HSRREL (11.3 ± 4.2 m/min) and SDREL (4.72 ± 2.53) in NCAA Division II athletes. Gentles (2018) reported total distance accumulated at velocity zones 15.00 – 19.99 kph and 20.00-24.99 kph but not relative distances. Due to the substitution rules in NCAA College soccer, there is a high variance in match-to-match playing variables. Other studies have only included players who have played over 50% of the match or the entire match (E. E. Choice et al., 2023), whereas other research only included participants who completed the match in its entirety (Alexander, 2014; Sausaman et al., 2019). If training programs are only based on average totals, then the whole picture may not be clear when designing training programs for those not participating in 90 minutes. Therefore, reporting data per minute may be more beneficial as reserves need to be trained throughout the season to compensate for minutes not played.
There was a difference in positional demands for HSRREL, with FWDs covering higher distances than MIDs and CBs. Whereas OBs covered more HSRREL than CBs and MIDs, and MIDs only covered more distance than CBs. Although there was no statistical difference between OBs and FWDs, OBs covered slightly more distance per minute. Although the lack of statistical difference between FWDs and OBs may be due to formation and playing style. In the 4-3-3 OB and FWDs may have similar positional demands as OBs are often part of the attack by providing width higher up the field. Formation on the field was not controlled for in this study so more research is warranted to understand positional differences across a variety of formation styles.
Results also showed that FWDs covered more SDREL than MIDs and CBs, and OBs covered more than CBs. Although variables are different within this study, results show similar trend within the literature, that forwards cover more HSR distance and sprint distance than midfielders (Sausaman et al., 2019; J. Vescovi, 2013). It should also be noted that CB and OB positions are typically grouped together as a singular position group (commonly reported as defender) (Stolen et al., 2005; J. D. Vescovi, 2012).
This study provides further evidence, particularly in women’s soccer literature, that there is a need to differentiate between central and outside defenders when evaluating physical demands during competition due to the different physical demands during competition (Alexander, 2014; Harkness-Armstrong et al., 2022). It is also important to note that in NCAA Division I studies, players covered more high-speed running and sprint distance on average compared to NCAA division II athletes. This indicates that the Division I game may be played at a faster pace, especially in those critical moments of the game (defensive recovery run, sprinting to goal etc.) As this study reports HSR and sprint distance per minute, it prevents the authors from making additional conclusions or comparisons.
There are limitations to the study that may have impacted the results. The data for this study was collected for one team playing one season of competition. The level of soccer players at all NCAA level can vary greatly across teams and conferences. Therefore, further research is needed to confirm the current findings. Differences in match demands as well as positional demands may be a result of opposition level, formations, match status, and match location. As such, additional research is needed to assess these factors to determine their possible influence on the physical demands of Division II women’s soccer.
CONCLUSION
This study examined the physical demands of women’s soccer at the NCAA Division II level and analyzed differences among position groups. Unlike previous research, this study assessed Relative total distance (TDREL), relative high-speed running distance (HSRREL), and relative sprint distance (SDREL), providing average values for all players and specific positions to describe match demands. The findings highlight differences in physical demands based on position played. The findings from this study emphasize the importance of evaluating workload relative to minutes played and recognizing the unique demands of each position at the NCAA Division II level. Such insights provide a framework for tailoring training, conditioning and substitution strategies that reflect position-specific requirements rather than relying on team-wide averages. Future research should continue to examine how positional workloads vary across divisions and competitive levels, as well as how these demands interact with injury risk, recovery and long-term players development.
APPLICATIONS IN SPORT
These findings provide an insight into general and positional demands of women’s soccer at the NCAA Division II level. These results are particularly valuable to coaches who may strategically utilize the NCAA substitution rules to manage player workloads. Caution should be exercised when applying published findings from other levels of play and relying on total averages as positional differences can substantially influence match demands.
The results emphasize the importance of aligning athlete’s physical attributes with the requirements of their playing positions. Forwards and outsides backs perform the highest sprinting and high-speed running demands per minute and may require players that have higher acceleration and sprint capacities. On the other hand, players that have less high-speed and sprinting demands, but positional awareness may be better suited at center back.
This may have implications for recruitment. Coaches may want to target athletes with performance profiles that align with the positional demands, rather than relying on general fitness. In regard to player development, training and conditioning programs should be tailored to the requirements of each position moving beyond a one-size-fits-all approach. For example, midfielders may benefit from training designed to sustain higher per-minute workloads, while forwards and outside backs should focus on repeated spring ability as well as increasing top speed.
Finally, these results may extend to tactical decision making and injury prevention. Coaches may rotate outside backs and forwards more frequently to preserve sprint performance later in matches. These findings provide sport practitioners with evidence-based guidance to optimize recruitment, training and match management in NCAA division II soccer.
REFERENCES
Alexander, R. (2014). Physical and Technical Demands of Women’s Collegiate Soccer. Electronic Theses and Dissertations, 2421. https://dc.etsu.edu/etd/2421
Al-Hazzaa, H., Almuzaini, K., Al-Refaee, S., Sulaiman, M., Dafterdar, M., Al-Ghamedi, A., & Al-Khuraiji, K. (2001). Aeronic and anaerobic power characteristics of Saudi elite soccer players. Journal of Sports Medicine & Physical Fitness, 41(1), 54–61.
Andersson, H. A., Randers, M. B., Heiner-Møller, A., Krustrup, P., & Mohr, M. (2010). Elite female soccer players perform more high-intensity running when playing in international games compared with domestic league games. Journal of Strength & Conditioning Research, 24(4), 912–919. https://doi.org/10.1519/JSC.0b013e3181d09f21
Bloomfield, J., Polman, R., & O’Donoghue, P. (n.d.). Physical demands of different positions in FA Premier League soccer.
Choice, E. E., Tufano, J. J., Jagger, K., L., & Cochrane-Synman, K. C. (2023). Match-Play External Load and Internal Load in NCAA Division II Women’s Soccer. Journal of Strength & Conditioning Research, 37(12), 633–639. https://doi.org/10.1519/JSC.0000000000004578
Choice, E., Tufano, J., Jagger, K., Hooker, K., & Cochrane-Snyman, K. C. (2022). Differences across Playing Levels for Match-Play Physical Demands in Women’s Professional and Collegiate Soccer: A Narrative Review. Sports, 10(10), 141. https://doi.org/10.3390/sports10100141
Gentles, J., Coniglio, C., Besemer, M., Morgan, J., & Mahnken, M. (2018). The Demands of a Women’s College Soccer Season. Sports, 6(1), 16. https://doi.org/10.3390/sports6010016
Harkness-Armstrong, A., Till, K., Datson, N., Myhill, N., & Emmonds, S. (2022). A systematic review of match-play characteristics in women’s soccer. PLOS ONE, 17(6), e0268334. https://doi.org/10.1371/journal.pone.0268334
Hopkins, W. G. (2002). A scale of magnitude for effect statistics. http://www.sportsci.org/resource/stats/effectmag.html.
Sausaman, R. W., Sams, M. L., Mizuguchi, S., DeWeese, B. H., & Stone, M. H. (2019). The Physical Demands of NCAA Division I Women’s College Soccer. Journal of Functional Morphology and Kinesiology, 4(4), 73. https://doi.org/10.3390/jfmk4040073
Sporis, G., Jukic, I., Ostojic, S., & Milanovic, D. (2009). Fitness profiling in soccer: Physical and physiologic characteristics of elite players. Journal of Strength & Conditioning Research, 23(7), 1947–1953. https://doi.org/10.1519/JSC.0b013e3181b3e141
Stolen, T., Chamari, K., Castagna, C., & Wisl??ff, U. (2005). Physiology of Soccer: An Update. Sports Medicine, 35(6), 501–536. https://doi.org/10.2165/00007256-200535060-00004
Vescovi, J. (2013). Motion Characteristics of Youth Women Soccer Matches: Female Athletes in Motion (FAiM) Study. International Journal of Sports Medicine, 35(02), 110–117. https://doi.org/10.1055/s-0033-1345134
Vescovi, J. D. (2012). Sprint profile of professional female soccer players during competitive matches: Female Athletes in Motion (FAiM) study. Journal of Sports Sciences, 30(12), 1259–1265. https://doi.org/10.1080/02640414.2012.701760
Wisløff, U., Castagna, C., Helgerud, J., Jones, R., & Hoff, J. (2004). Strong correlation of maximal squat strength with sprint performance and vertical jump height in elite soccer players: Figure 1. British Journal of Sports Medicine, 38(3), 285–288. https://doi.org/10.1136/bjsm.2002.002071