
Since Trump started his second term, the problem with a lot of economic commentary is that it’s overly emotional and anti-Trump. It was that way with all the forecasts that the Dollar would go into a death spiral after the rollout of reciprocal tariffs last April (it didn’t) and it’s that way now with inflation, with many desperately looking for signs inflation is overheating (it isn’t) as punishment for all of Trump’s bullying of the Fed.
Two things are important to remember. First, markets are basically agnostic when it comes to Trump. After all, they routinely invest in places like Turkey and China. The stuff that goes on in those places makes Trump’s antics look amateurish. Markets just aren’t that fussed, which is why the death spiral for the Dollar didn’t happen last year. Second, even if Trump slaps around the Fed and pressures it into rate cuts, that in no way means inflation will rise quickly. The US economy is a massive beast. There’s no way the antics of one man – however appalling – can cause inflation to spike rapidly. Things just don’t work that way.
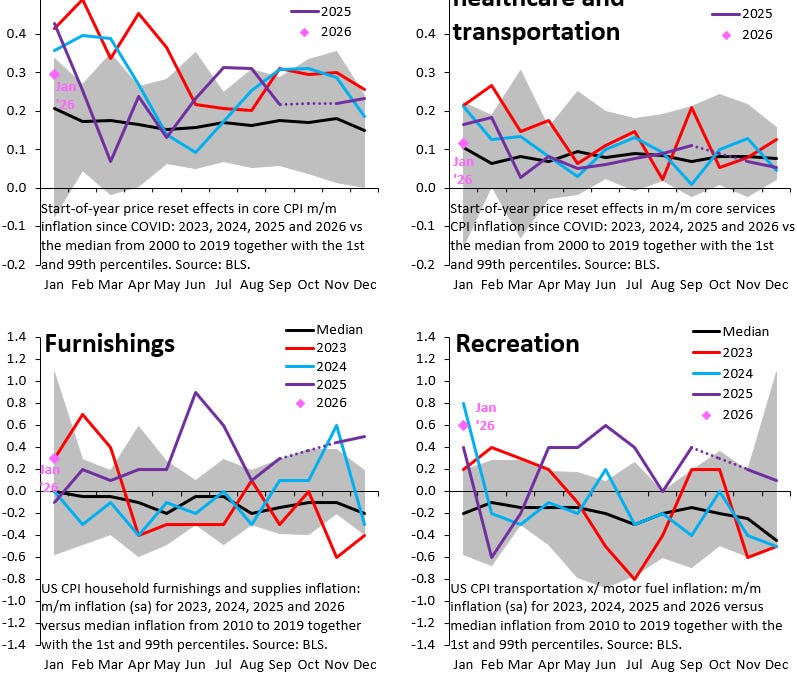
Today’s post takes a closer look at yesterday’s CPI reading for January. Inflation has been hard to read since COVID because residual seasonality has lifted inflation in the early parts of the calendar year. Firms often delay hiking prices until the beginning of a new year. When inflation is well-behaved, seasonal adjustment filters these start-of-year price resets out, but that doesn’t work when inflation spikes like during and after COVID. Start-of-year price resets were bigger than normal and thus didn’t get filtered out by seasonal adjustment routines. This dynamic is critically important for how you need to look at yesterday’s inflation data and – once you do this properly – those data look really benign. There just isn’t any overheating going on.
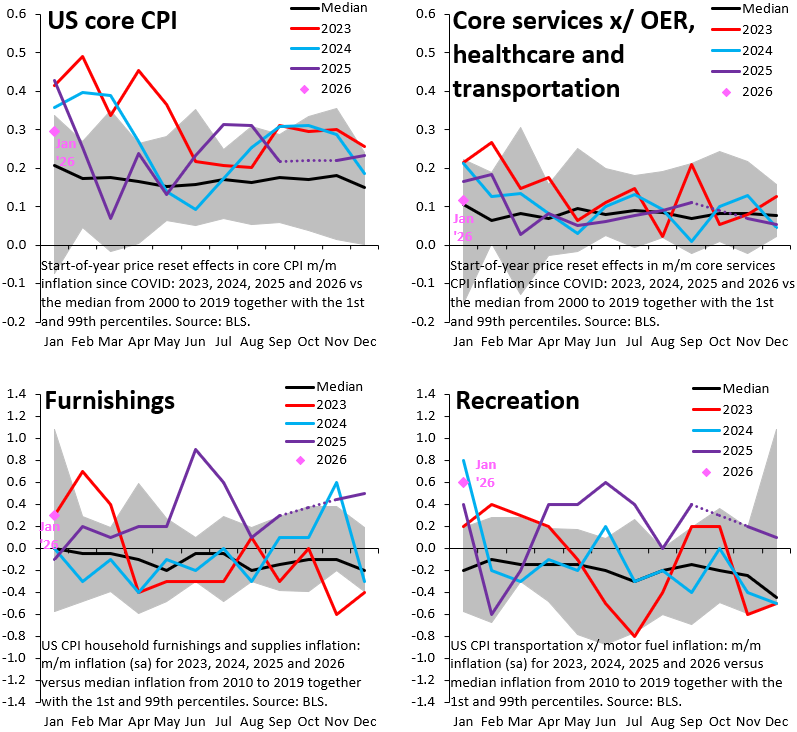
The four charts above each have the same format. They show seasonally adjusted month-over-month inflation for core CPI (top left), core services inflation excluding owners’ equivalent rent (OER), healthcare and transportation (top right), furniture (bottom left) and recreational goods (bottom right). Because of residual seasonality, I show inflation in calendar year space. The black line shows median inflation in each month from 2010 to 2019. The red line is inflation in 2023, the blue line is inflation in 2024 and the purple line is inflation last year. The pink rhomboid is the January 2026 reading for month-over-month inflation.
As the top left chart shows, yesterday’s reading of 0.3 percent month-over-month is very benign compared to prior years. In fact, it’s the first reading in many years that isn’t above the 99th percentile of the distribution. Indeed, core services inflation looks even more benign after excluding OER, healthcare and transportation. January 2026 is exactly on top of the pre-COVID median, a period when inflation was – if anything – too low. Meanwhile, as the bottom two charts show, categories that were hard hit by tariffs saw material inflation in January, so start-of-year price resets look to have been especially large here (which explains some of the low tariff passthrough in the second half of 2025). So there certainly wasn’t any kind of reprieve from tariff passthrough.
The bottom line is that services inflation looks very benign and has returned to where it was before the pandemic, when – arguably – inflation was too low. There just really isn’t any sign that inflation is running hot or that it will do so in the near future.