
PC game performance analysis has become dramatically more complex in the DirectX 12 and Vulkan era. Between asynchronous compute, hardware ray tracing, temporal reconstruction, frame generation, and machine learning-assisted denoising, a modern game’s rendered frame is no longer a simple sequence of rasterized draw calls. If you actually want to understand where your performance is going, you need to move beyond basic performance overlays and into a tool that can expose how work is distributed across the GPU, how shaders behave at runtime, and which stages are truly limiting the frame. That is exactly where programs like NVIDIA Nsight Graphics come in.
In this guide, we’re going to walk you through a practical workflow for profiling GPU performance in modern games with NVIDIA Nsight Graphics, using CD Projekt RED‘s Cyberpunk 2077 as a case study. The focus here is not on debugging rendering correctness, but on understanding performance: where the GPU is spending time, what kinds of workloads dominate in rasterized, ray-traced, and path-traced scenes, and how to interpret the results using marquee Nsight Graphics features, such as GPU Trace Profiler, Shader Pipelines, and Hotspots. Our methodology is based on NVIDIA’s Peak-Performance-Percentage analysis approach, which starts from GPU-level evidence rather than guesses about how the game engine is using the GPU.
What Is NVIDIA Nsight Graphics?
NVIDIA Nsight Graphics is NVIDIA’s graphics debugger and profiler for modern graphics APIs, including Direct3D 12 and Vulkan. It includes multiple activities, but for performance work, the most important one is GPU Trace Profiler, which captures a detailed view of GPU execution over a frame or a short range of frames. NVIDIA describes GPU Trace Profiler as a “tool for analyzing GPU-bound scenarios”, tracing shader execution on the Streaming Multiprocessors (SMs), and identifying opportunities for simultaneous graphics and compute work, also known as async compute.
That distinction matters, as Graphics Capture is useful for freezing a frame and inspecting resources, pipeline state, or draw order, but GPU Trace Profiler is the activity designed for performance analysis. It exposes GPU queue — graphics/direct/3D, compute, and copy queues — activity, synchronization, timing, shader-level profiling, and a range of timeline metrics that help you determine whether a workload is limited by occupancy, memory bandwidth, divergence, or lack of overlap between GPU queues.
Recent Nsight Graphics releases have also made GPU Trace Profiler far more useful for game analysis. The Shader Profiler now includes a Flame Graph, and in D3D12 applications, Nsight can show NGX-created workloads, including work associated with NVIDIA DLSS and similar NVIDIA Software Development Kit (SDK) features. In practice, that makes the tool significantly more relevant for profiling modern PC games that use ray tracing and machine learning-assisted temporal upscaling and denoising.
There are several GPU profiling and debugging tools available today, each with its own strengths and target use cases. Popular examples include RenderDoc, an open-source frame debugger widely used to inspect and analyze individual frames in detail, and PIX, Microsoft’s official performance and debugging suite for DirectX applications. Alongside these, tools like NVIDIA Nsight Graphics provide similar capabilities but are tailored to specific GPUs from NVIDIA. While all of these tools are valuable, this guide focuses on Nsight Graphics because the test system uses an NVIDIA GPU, and Nsight simply offers the deepest level of integration, metrics, and profiling features for NVIDIA hardware, making it the most suitable choice for this analysis.
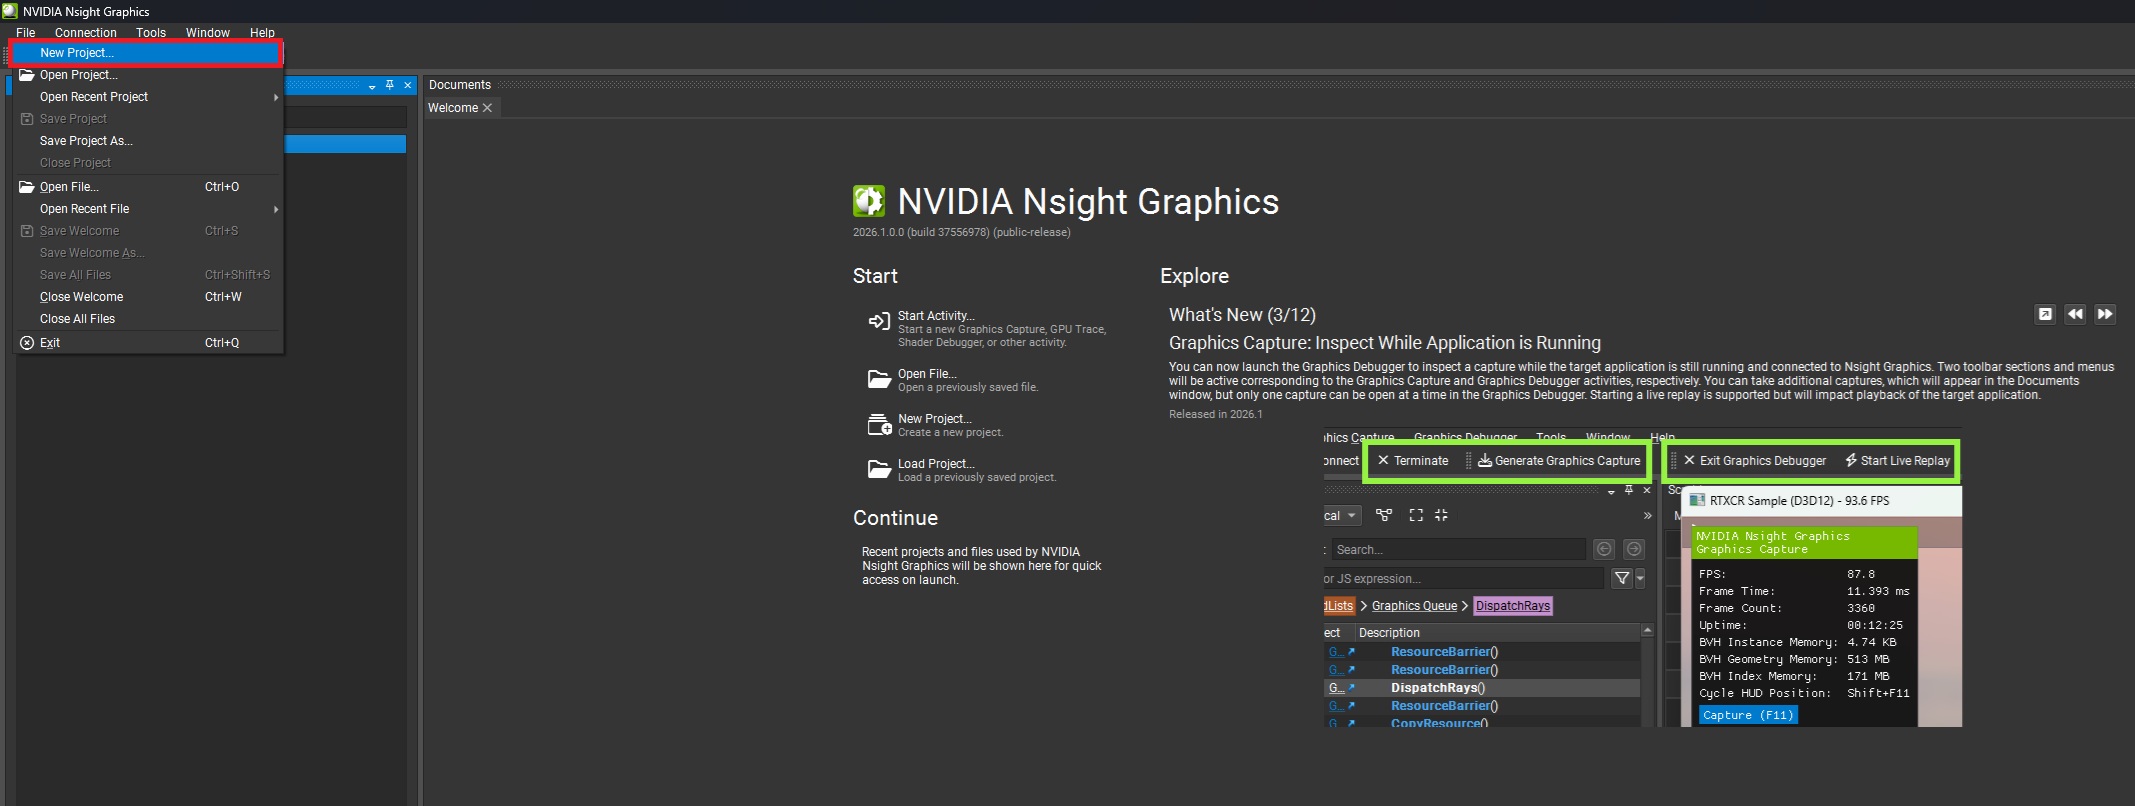
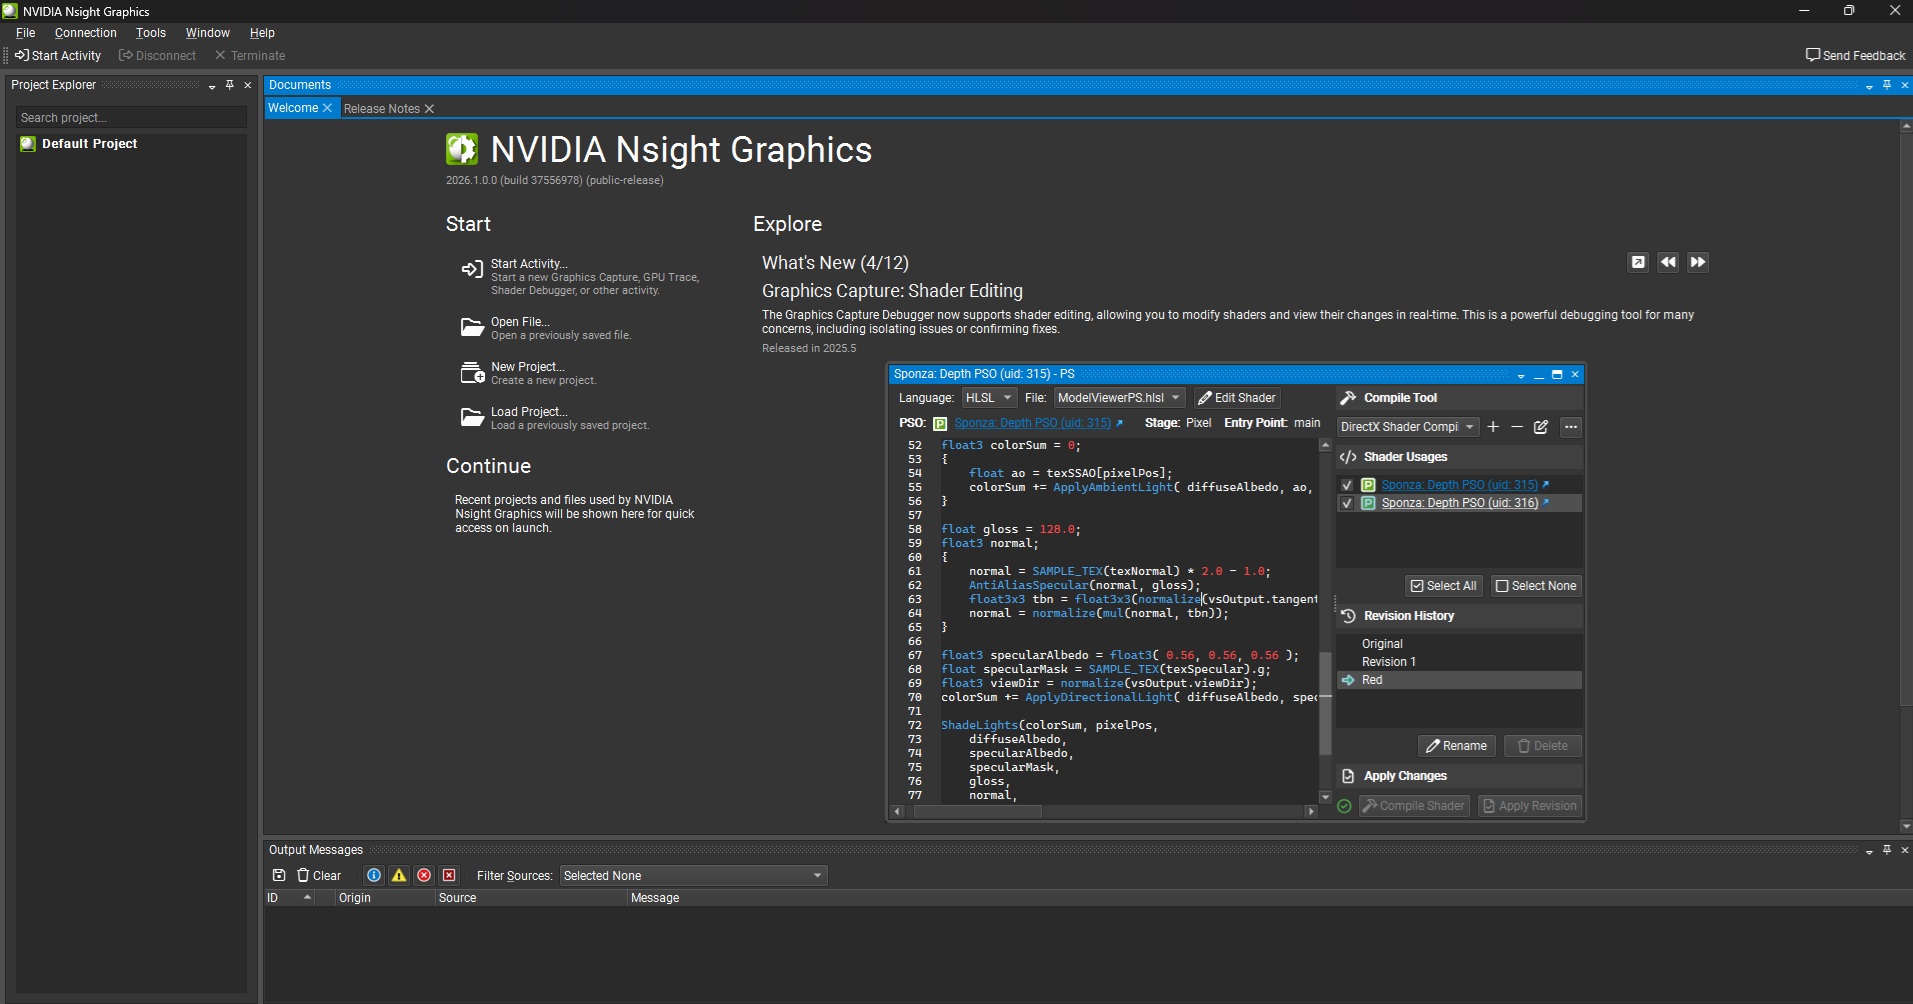 The Nsight Graphics 2026.1 welcome screen
The Profiling Methodology: Peak-Performance-Percentage Analysis
A lot of game-performance discussions start from assumptions. People look at a noisy frame-time graph, notice ray tracing is enabled, and conclude that “RT performance is the bottleneck.” Or they see a heavy post-processing sequence and assume that must be the reason performance tanks. NVIDIA’s Peak-Performance-Percentage method starts from the opposite direction: it begins with GPU utilization metrics and asks which GPU units are most saturated, how close they are to their throughput limits (also known as Speed Of Light or SOL), and whether the current workload is actually constrained by one of those limits.
The core idea is simple: first, identify the expensive GPU workload. Then, examine high-level throughput data to determine which GPU unit is most likely limiting performance. If no unit is close to a high percentage (defined as >80% SOL in NVIDIA’s PPA method) of its theoretical throughput, the goal becomes improving utilization. If one unit is close to its limit, the goal becomes removing work from that unit or restructuring the workload to reduce pressure. This is a much more disciplined approach than guessing from visual complexity alone.
For this guide, that methodology maps neatly onto Nsight Graphics. GPU Trace Profiler gives the high-level timeline and queue view. Top-Level Triage provides the first broad pass over the frame. Shader Pipelines identifies the most expensive shader workloads in a selected range. The Shader Pipelines and Hotspots sections then let us drill down into those shaders and understand whether the dominant issues are control-flow divergence, instruction mix, memory dependencies, or sheer workload size. NVIDIA’s documentation explicitly positions the Shader Profiler as a tool for understanding why shaders stall and how to recover performance from SM-limited workloads.
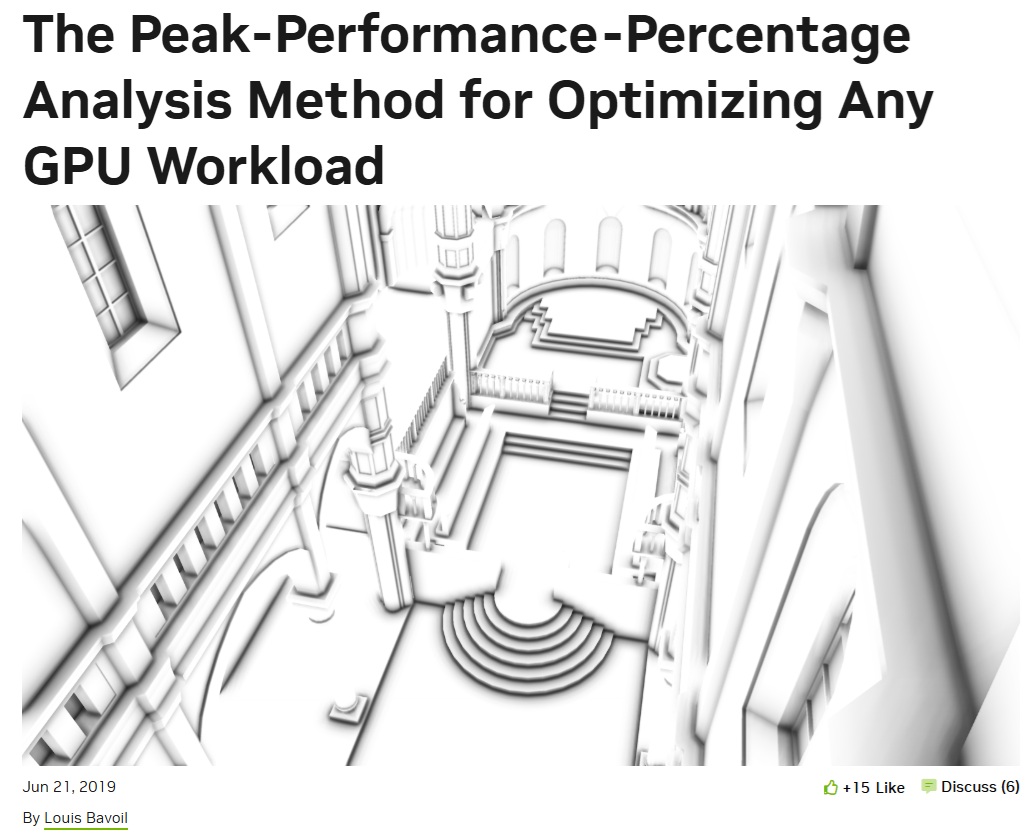 The Peak-Performance-Percentage analysis method — pioneered by NVIDIA graphics researcher and engineer Louis Bavoil — is an innovative method for profiling and optimizing NVIDIA GPU gaming performance
Test Setup And GPU Capture Strategy
We captured two Cyberpunk 2077 frames on a system with the following specs:
CPU: Intel Core i7-14700K;
RAM: 32 GB DDR5-7000 CL34;
Storage: 2 TB PCIe 4.0 NVMe SSD;
GPU: NVIDIA GeForce RTX 4090 24 GB;
Operating System: Windows 11 25H2;
All system firmware, drivers, BIOS, and OS updates were fully applied before testing.
The two captures (or traces) were performed in the same scene at a resolution of 2560×1440 (1440p), with two different scenarios:
High graphics preset with raster-only settings
High graphics preset with path tracing (RT Overdrive) plus DLSS Ray Reconstruction in Quality mode (combined upscaling and denoising of path-traced effects)
This spread is useful because it produces a clear escalation in rendering complexity. The rasterized frame emphasizes more traditional graphics rendering, whereas the path-traced frame adds an even heavier path-traced workload while also adding DLSS Ray Reconstruction’s combined machine learning-assisted denoising and upscaling.
How To Profile A Game With Nsight Graphics
The practical workflow is refreshingly simple once you know how to use Nsight Graphics.
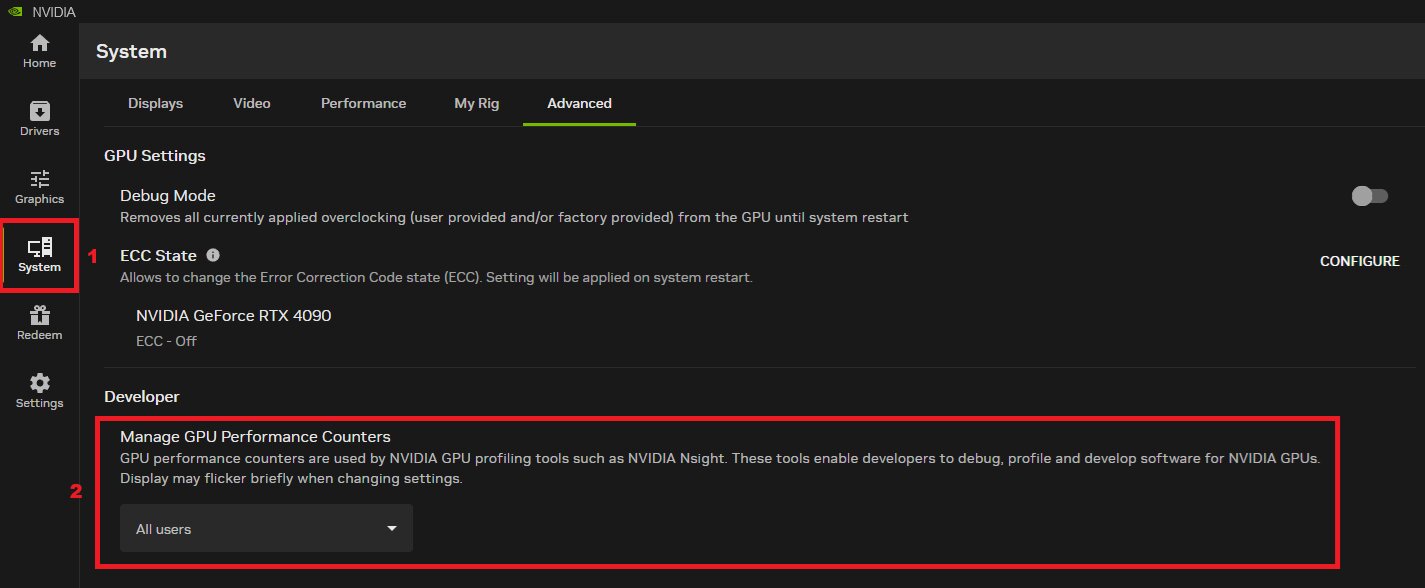
1. Launch NVIDIA App and authorize access to GPU perf counters
Open NVIDIA App, then navigate to System → Advanced and set Manage GPU Performance Counters to All users. This should allow Nsight to access the GPU’s performance counters without having Administrator privileges in Windows:
2. Launch Nsight Graphics and create a new project
Open Nsight Graphics and create a new project, via the File → New Project… in the top left toolbar:
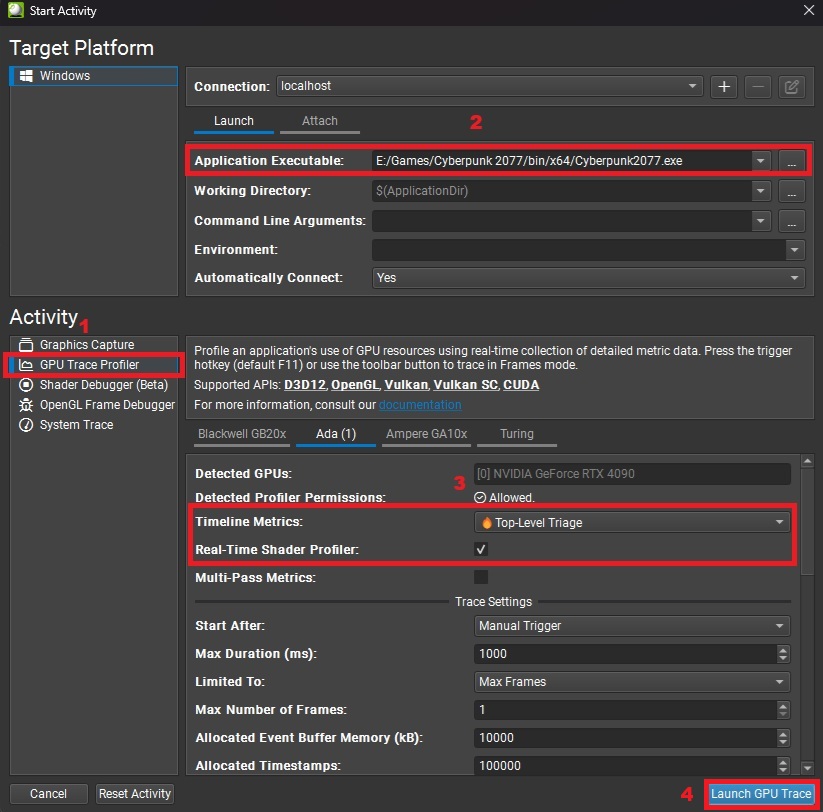
3. Configure capture settings and launch the game through Nsight
In the capture settings of the Start Activity window, choose GPU Trace Profiler as the activity, since this is the mode designed for performance analysis rather than debugging. Then, set the Application Executable to the game’s direct executable file path, and not an indirect launcher. After that, configure the following settings like this:
Timeline Metrics: Select Top-Level Triage
Enable Real-Time Shader Profiler
Leave advanced options (like Multi-Pass Metrics) disabled for a clean capture
These settings ensure you collect both high-level GPU utilization data and shader-level profiling information.
After that, click the Launch GPU Trace button in the bottom right to launch the game via Nsight Graphics, which will inject itself into it and begin monitoring GPU activity in real time:
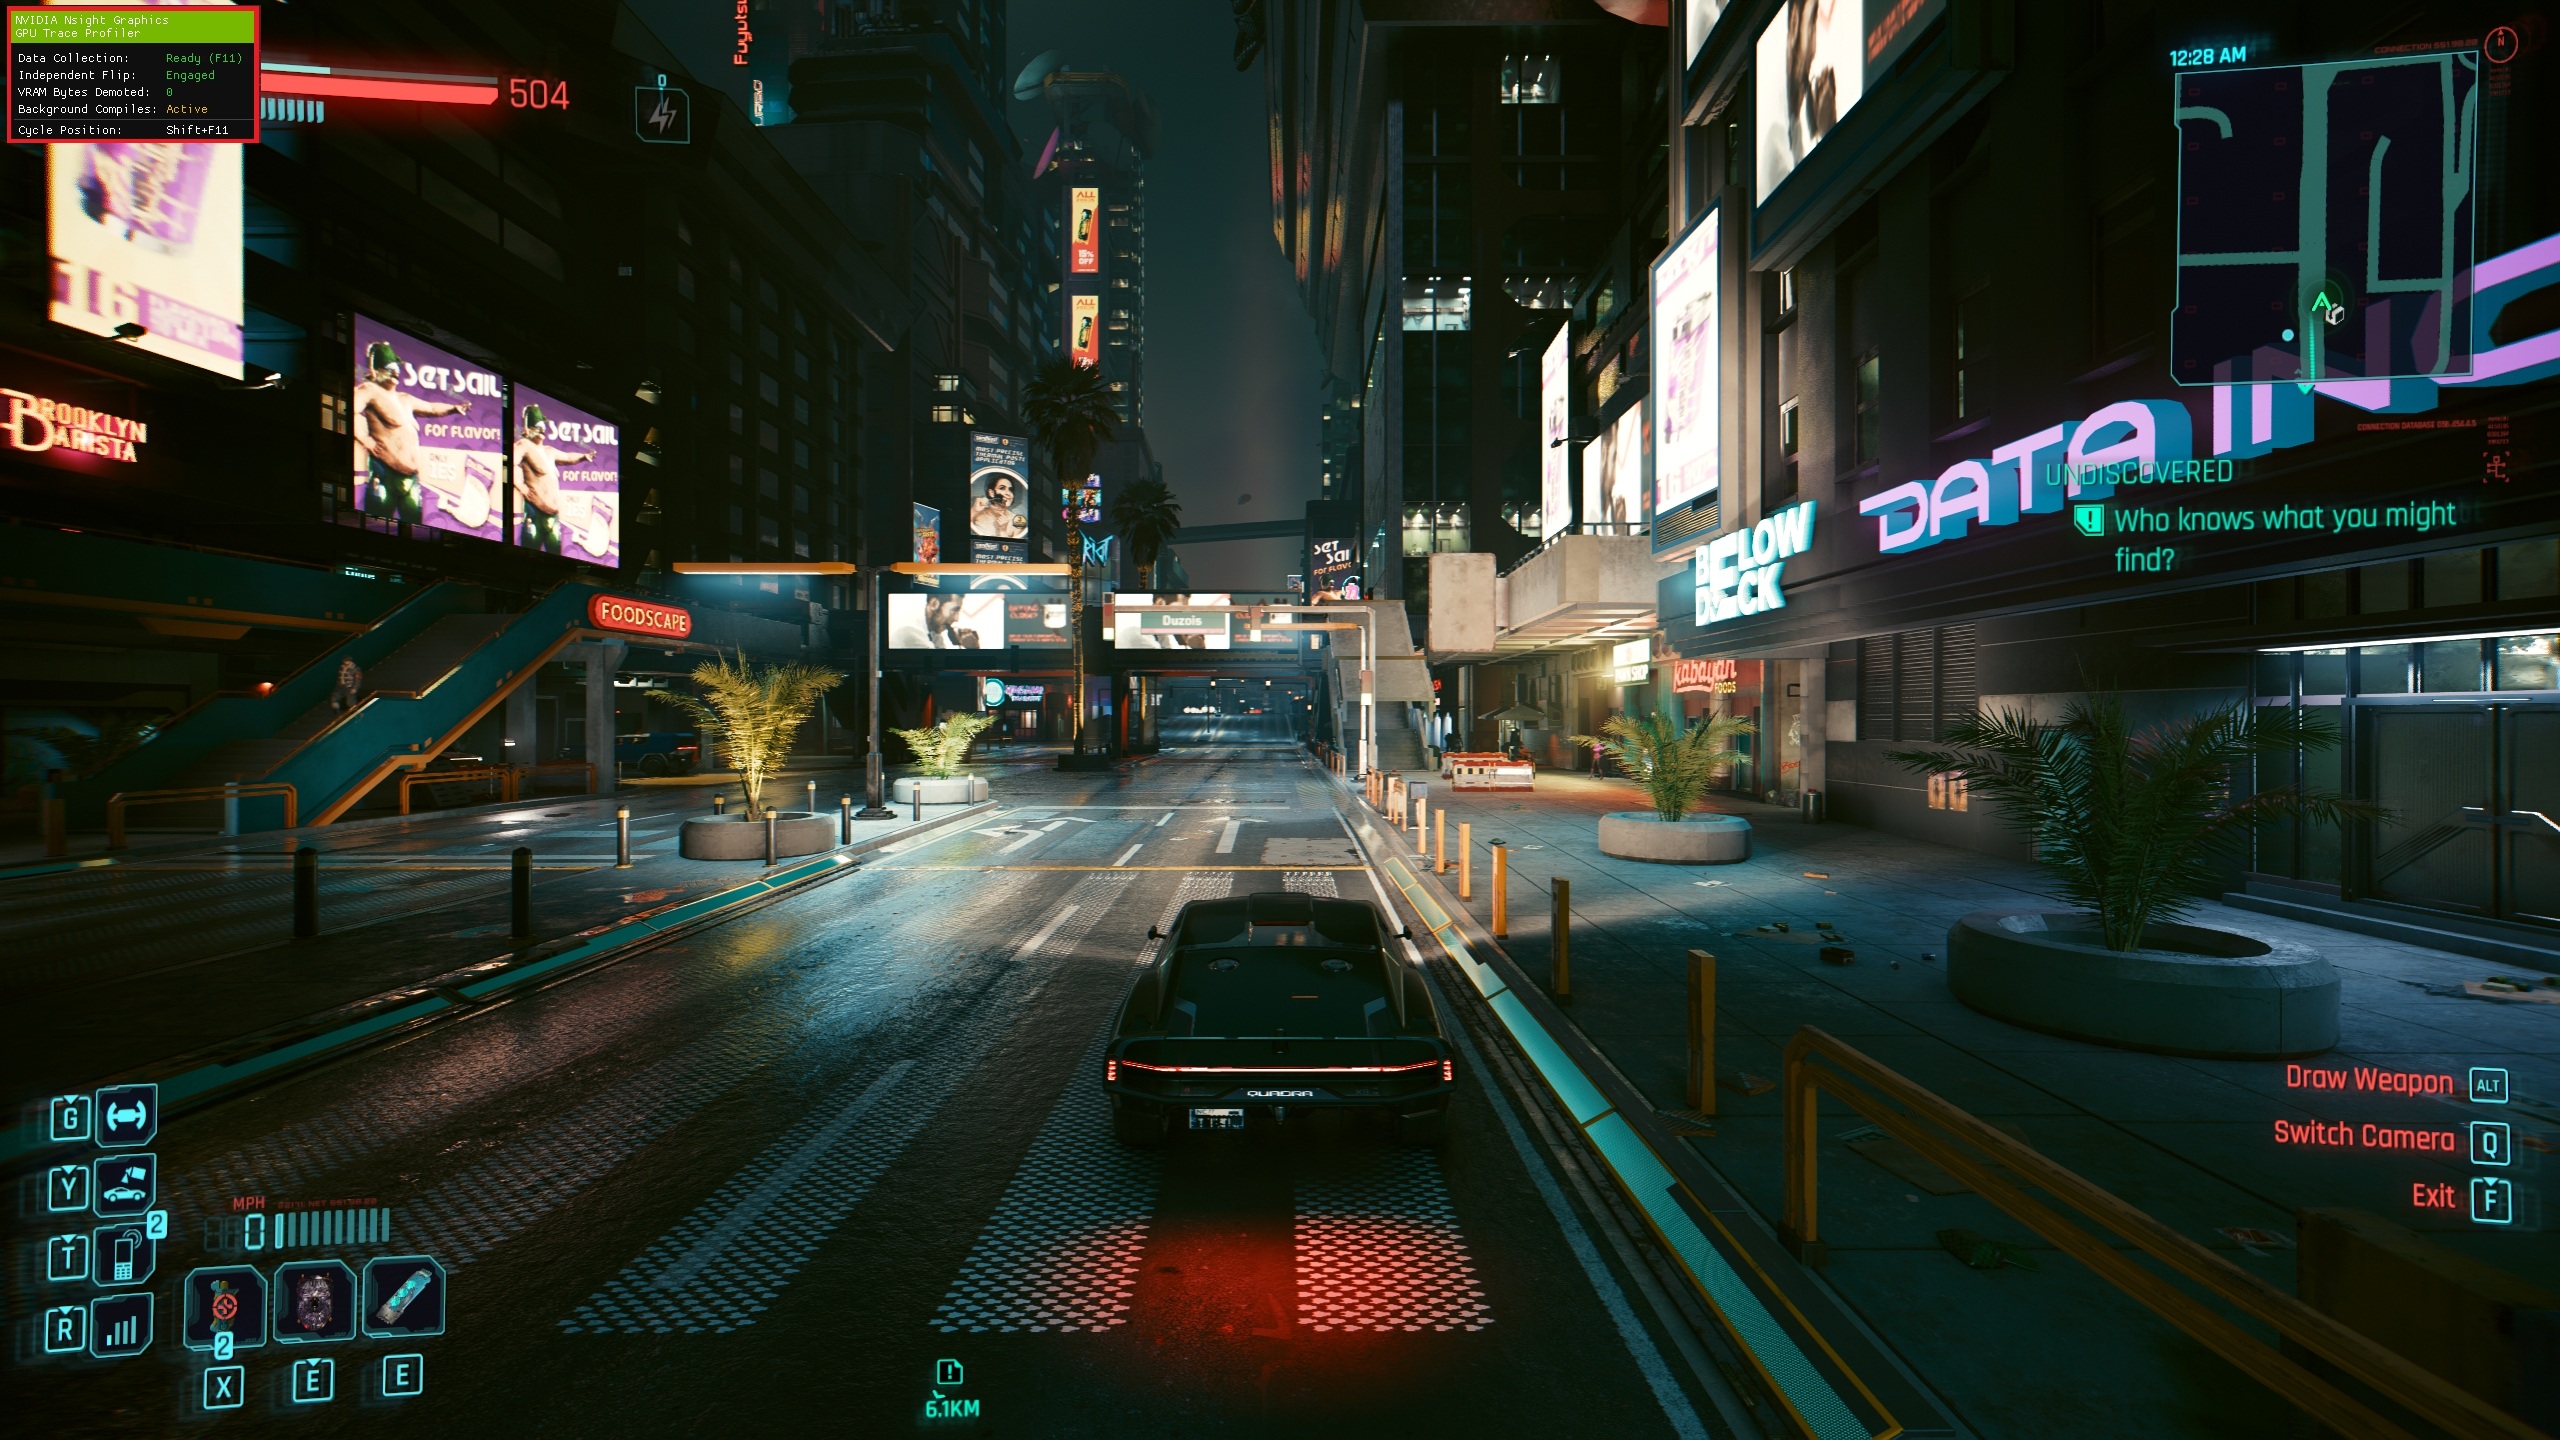
4. Navigate to a stable test scene
Once the game loads:
Move to a representative scene (e.g., dense city area)
Stop all camera movement
Wait a few seconds for:
shader compilation to finish
GPU workload to stabilize
Confirm that Nsight Graphics is properly set up and is ready to perform GPU captures by making sure that the top left menu appears and shows: Data Collection: Ready (capture hotkey):
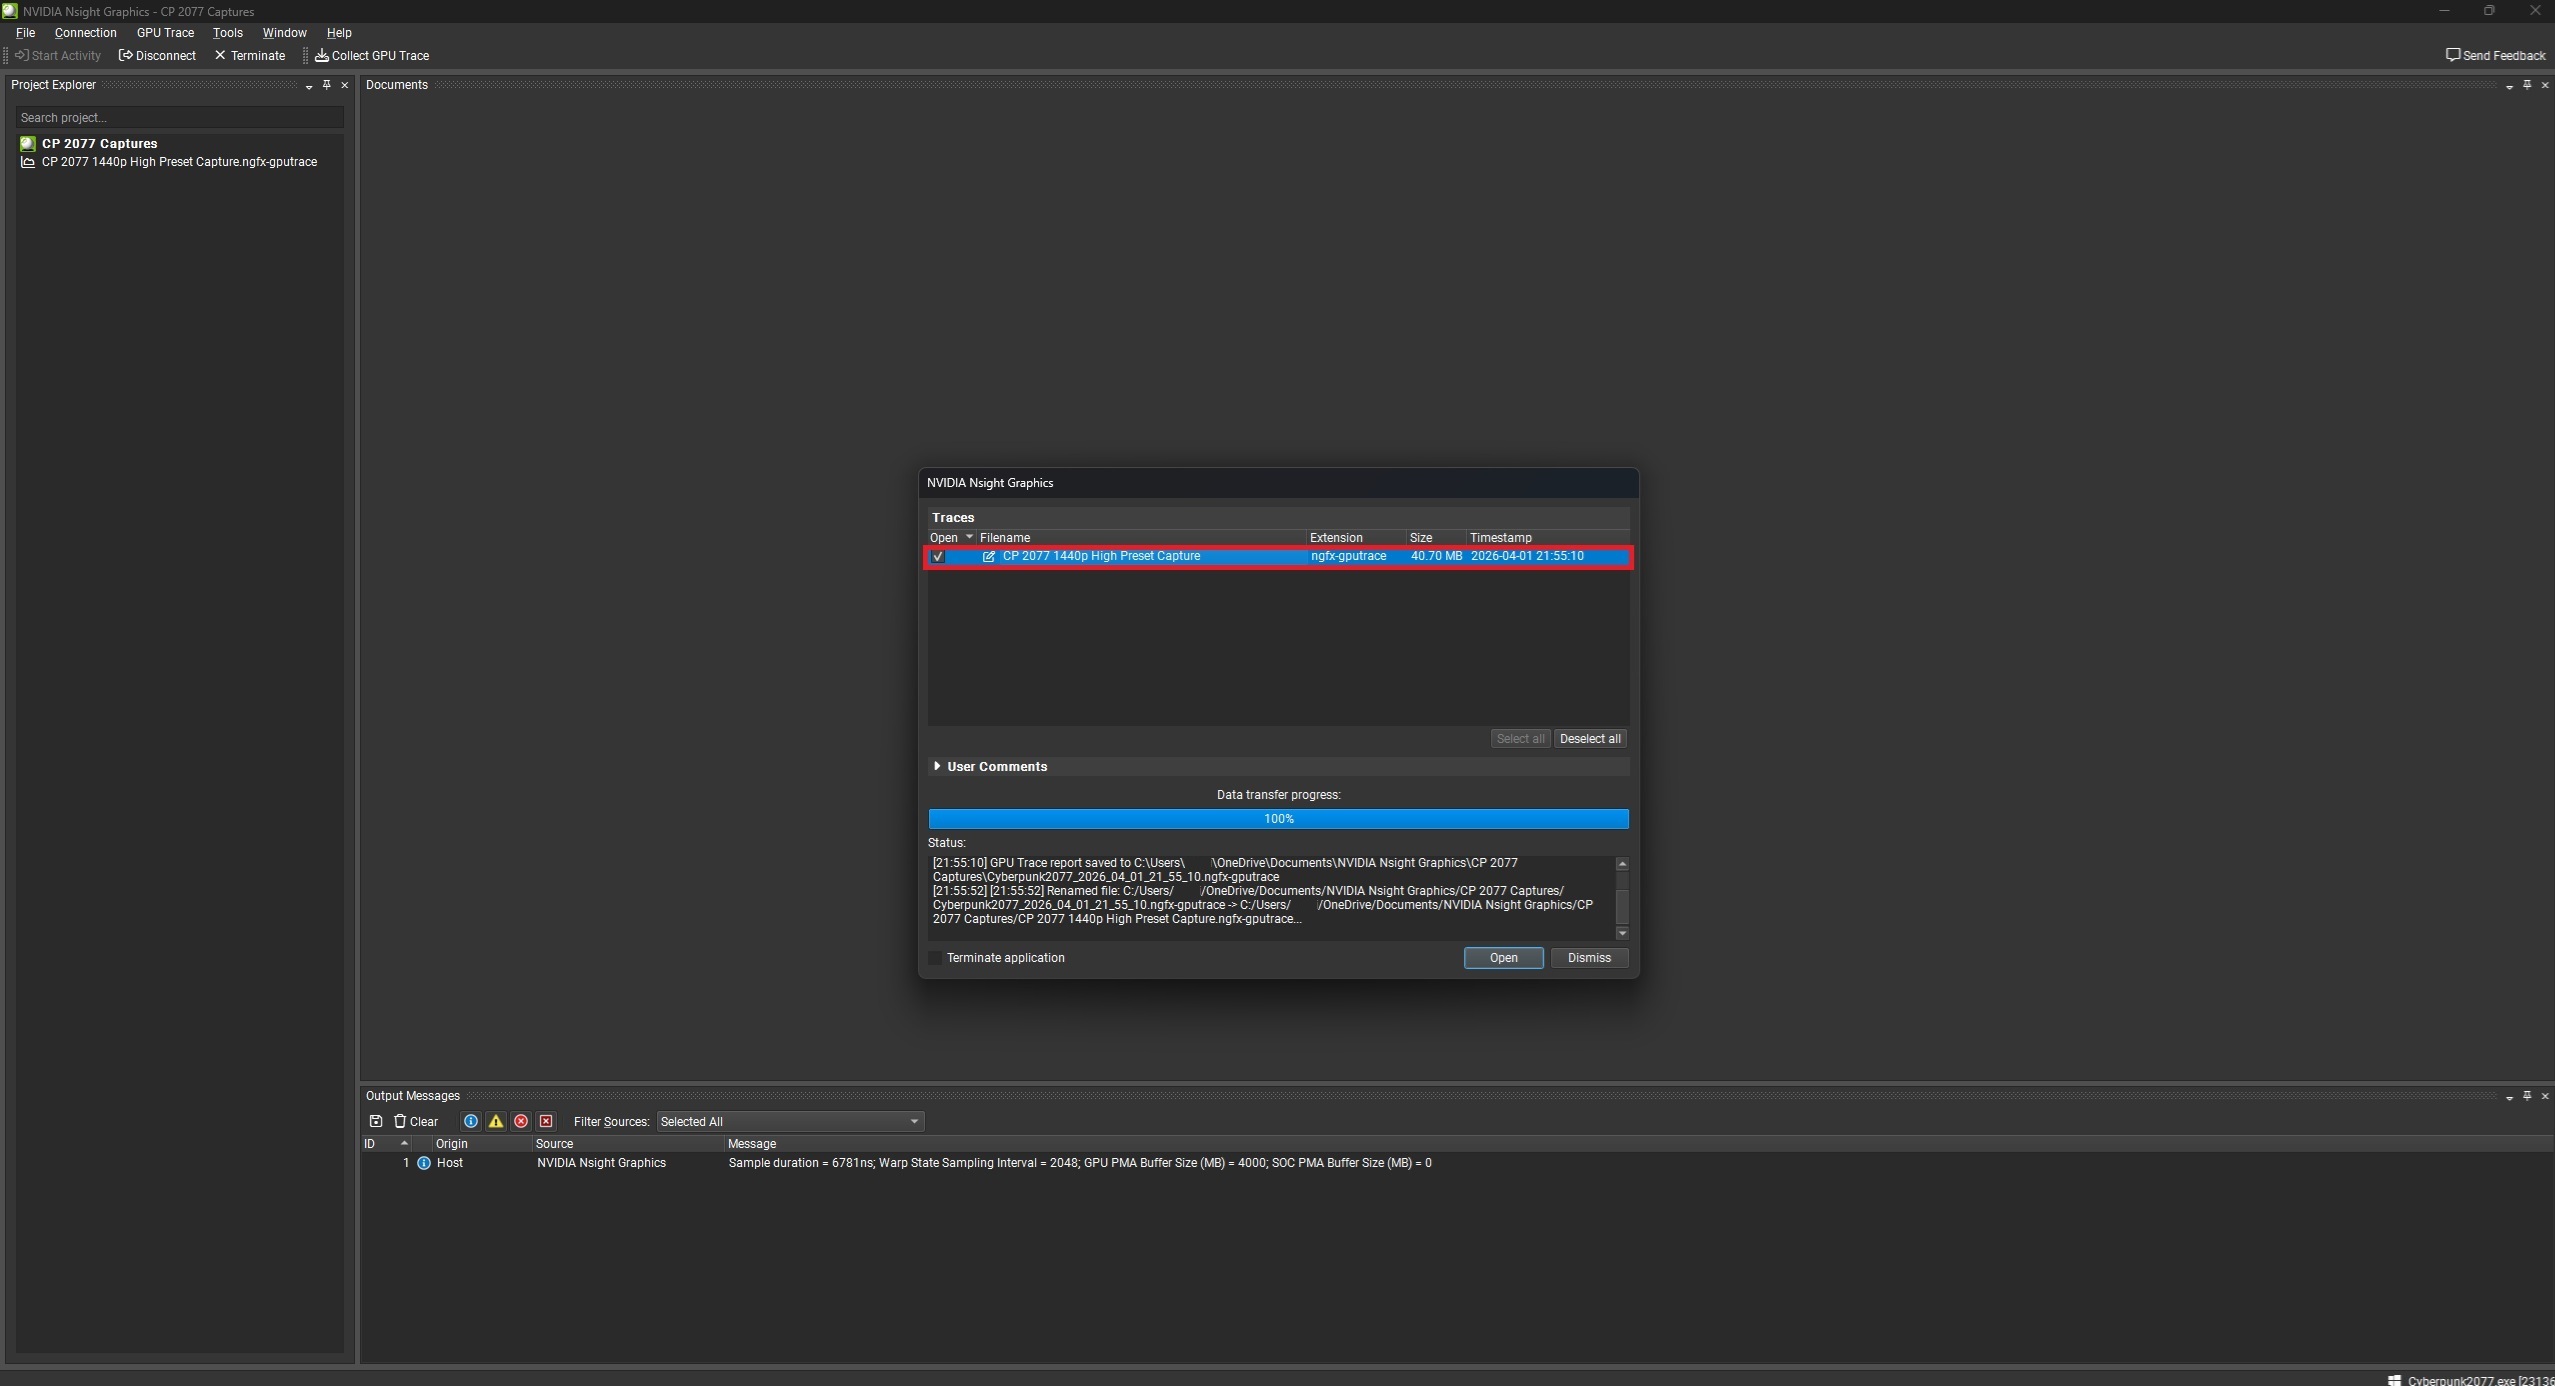
5. Capture a frame (F11)
Press F11 (default hotkey) to trigger a GPU Trace Profilercapture.
Nsight will then:
Record GPU timestamps and metrics
Capture shader execution data
Generate a detailed timeline of the frame
Alt+Tab back to Nsight Graphics, where you should see the captured frame in a window, where you can rename it as you see fit, then choose to either dismiss or open it in Nsight:
6. Open the GPU Trace Profiler report
After opening the GPU capture (or trace) in Nsight, you’ll see the main Timeline view with many elements, such as:
Graphics queue
Compute queue
Per-GPU unit utilization metrics
Shader Pipelines
Flame Graph
Hotspots
GPU Trace Profiler uses timestamps to build a detailed timeline of draw and dispatch events and their execution duration:
In the next section, we will be taking a look at how to interpret the results of the two aforementioned GPU traces in Cyberpunk 2077.
Case study: Cyberpunk 2077
To put the discussed profiling methodology into practice, we captured and analyzed two representative GPU traces from Cyberpunk 2077 using NVIDIA Nsight Graphics’s GPU Trace Profiler. The first capture focuses on a traditional rasterized workload (1440p High preset with no ray/path tracing), providing a baseline view of how a modern AAA game engine (specifically CD Projekt Red’s REDengine 4) structures and renders a frame. The second capture shifts to the game’s most demanding configuration — path tracing (RT Overdrive) combined with DLSS Ray Reconstruction at Quality mode — allowing us to examine how the workload evolves when advanced ray tracing and modern AI-assisted/neural rendering techniques are introduced. By comparing these two scenarios, we can clearly illustrate how GPU workloads scale in complexity and how Nsight Graphics exposes the underlying bottlenecks, from raster pipelines to hybrid compute and ray tracing–driven rendering.
Important note: this analysis was performed on the retail version of Cyberpunk 2077, rather than a developer build. As a result, we unfortunately did not have access to internal performance markers that would explicitly label individual render passes (such as G-Buffer, global illumination, ambient occlusion, screen-space reflections, tone mapping, or post-processing). Tools like Nsight Graphics can expose such markers when they are provided by the application, offering invaluable insight into the structure of a frame, but these are typically only available in developer or instrumented builds. In this case, we instead relied on GPU Trace Profiler, Shader Pipelines, and Hotspots to infer workload structure and identify performance hotspots from the available data.
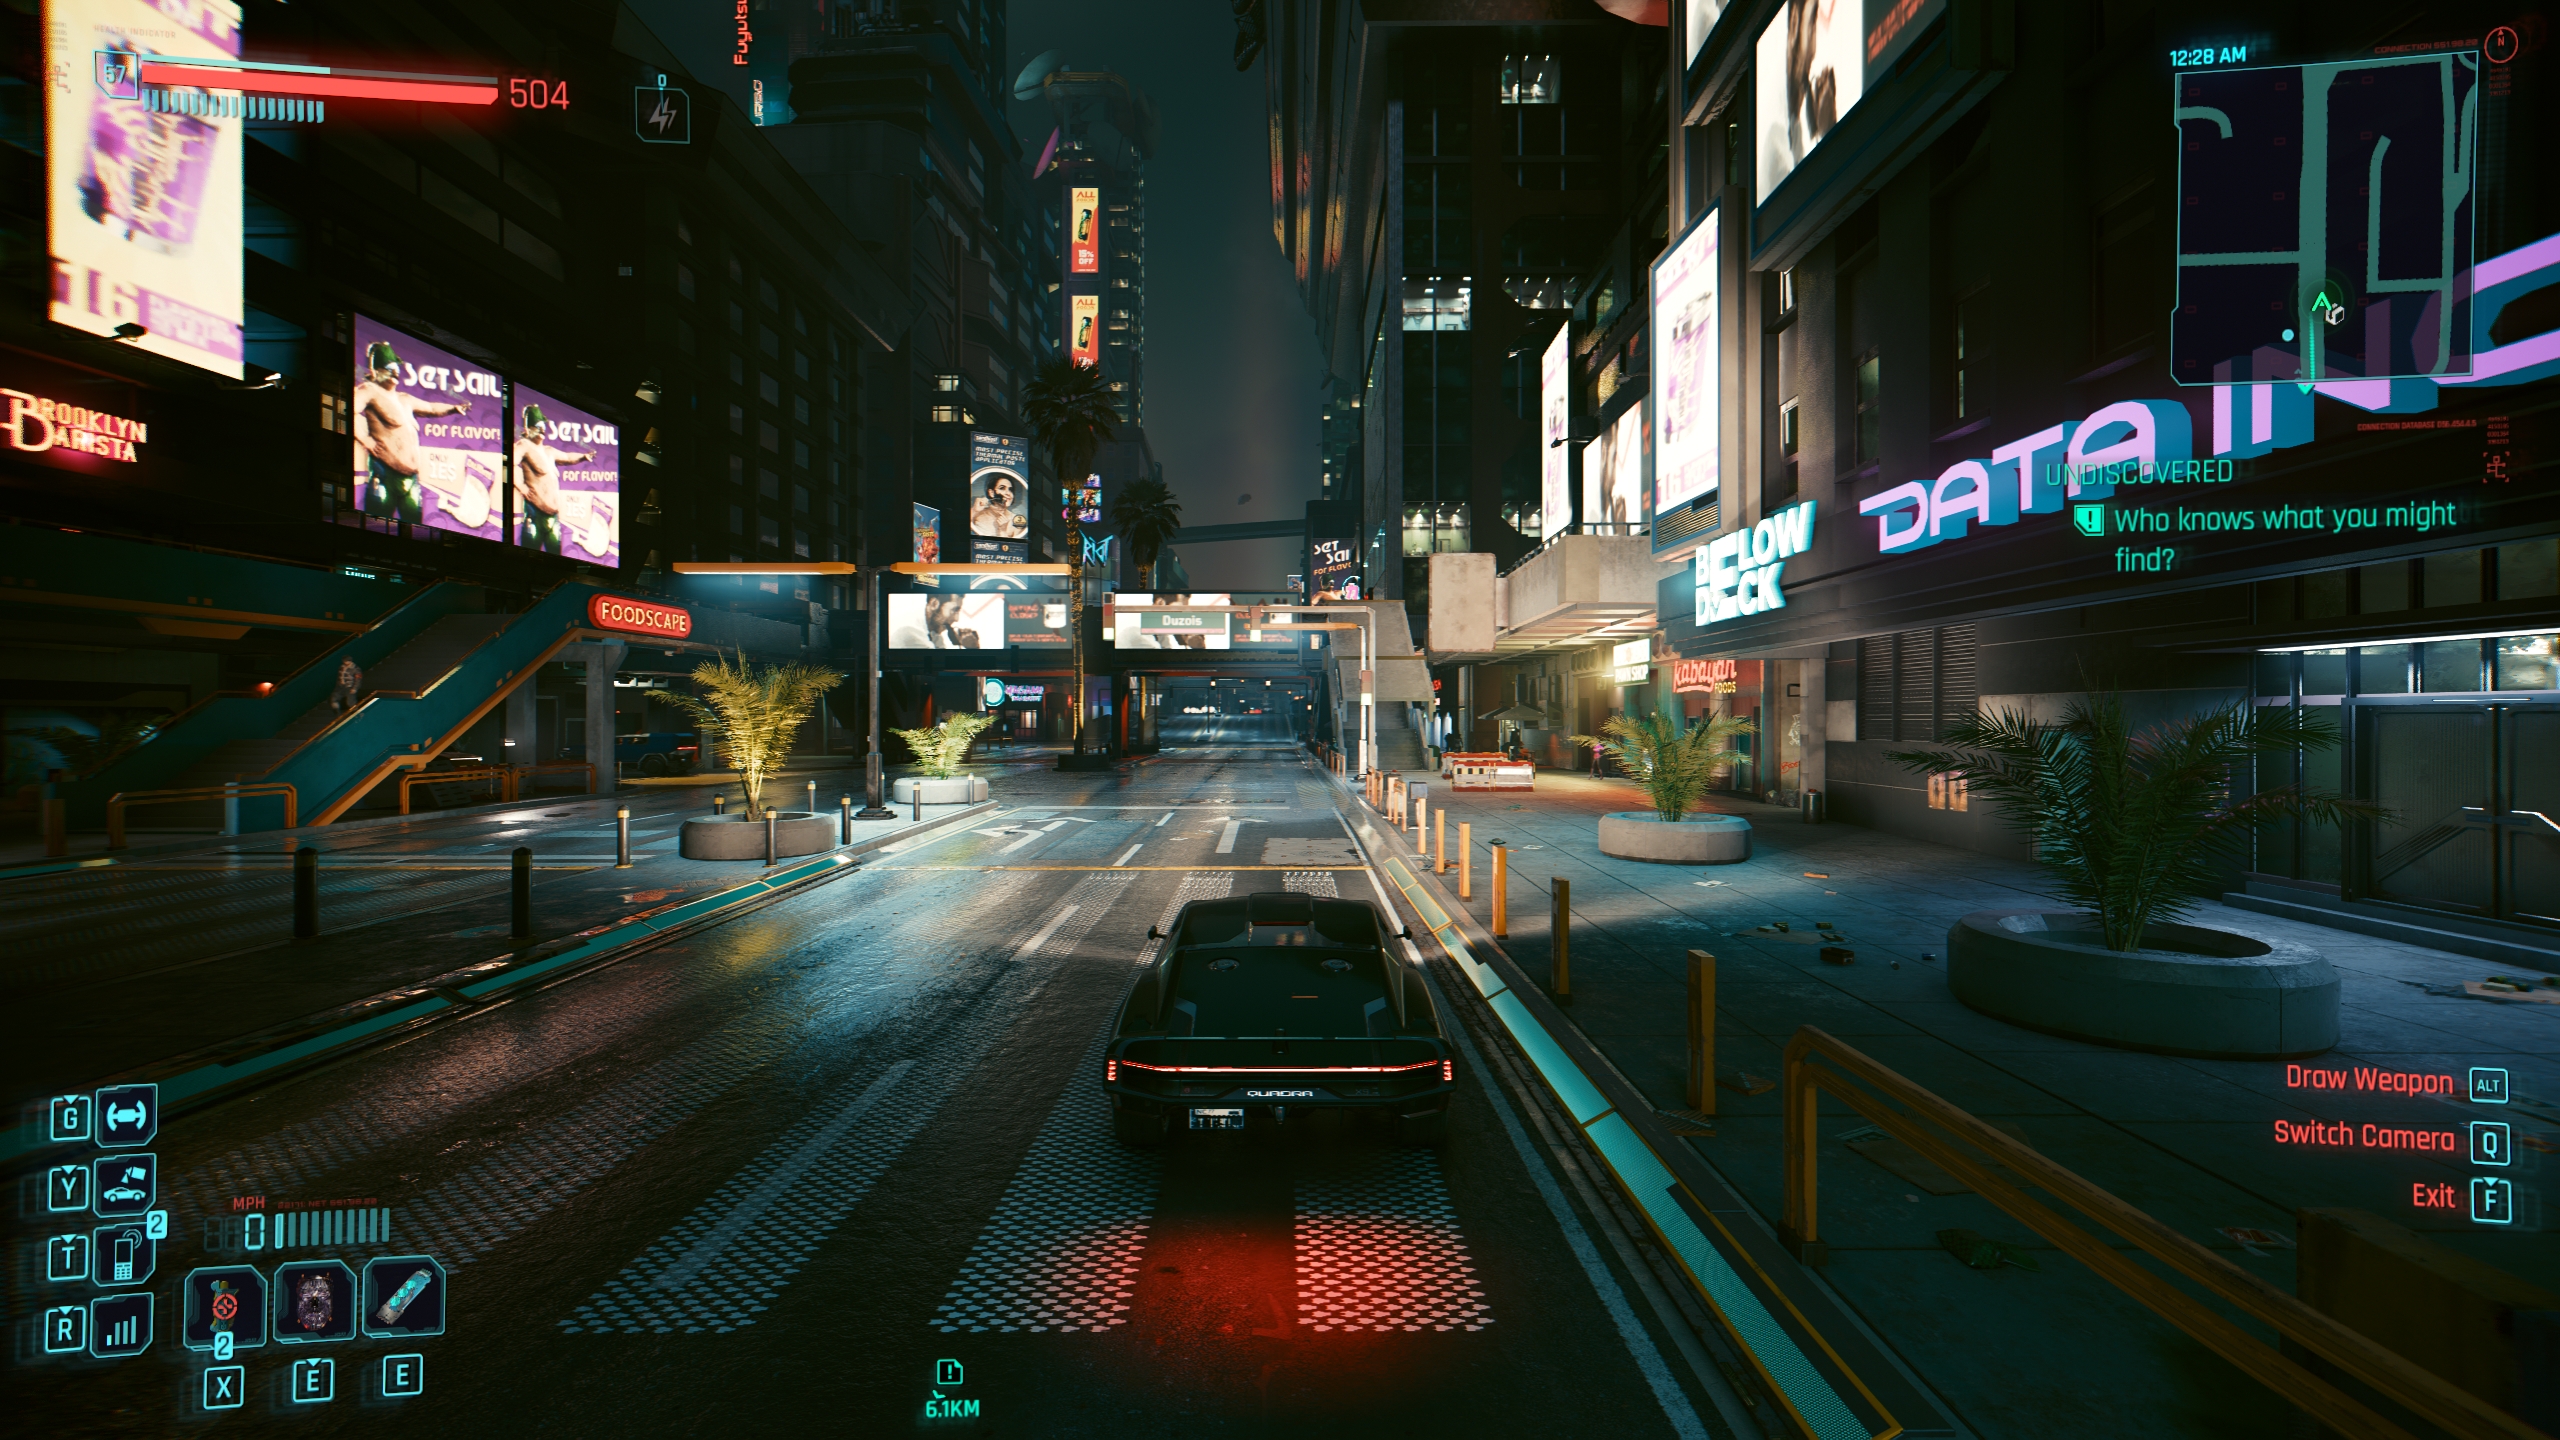 The Cyberpunk 2077 capture scene
Rasterized frame trace
To demonstrate how Nsight Graphics can be used in practice, we first captured and analyzed a single frame from Cyberpunk 2077 running at 1440p using the High preset, with all ray-traced effects disabled. This provides a clean baseline for understanding how a modern rasterized frame is structured and, more importantly, what actually limits its performance on modern GPUs.
At first glance, one might expect a raster-only frame to be dominated by geometry submission and pixel shading. However, Nsight Graphics quickly reveals a more nuanced picture.
Frame structure and workload distribution
By combining GPU Trace Profiler timeline data with queue-level (graphics and compute queues, with heavy async compute usage) exports, we can reconstruct the frame into a series of major workload regions. While the absence of developer markers prevents exact naming of render passes, the structure is still somewhat identifiable:
[Frame setup / shadow maps / depth pre-pass]
↓
[Main scene geometry / G-buffer (draw-heavy raster)]
↓
[Lighting and late scene processing]
↓
[Indirect lighting, screen-space effects (screen-space reflections, ambient occlusion, etc.)]
↓
[Temporal anti-aliasing, post-processing, tone mapping]
↓
[UI / HUD rendering]
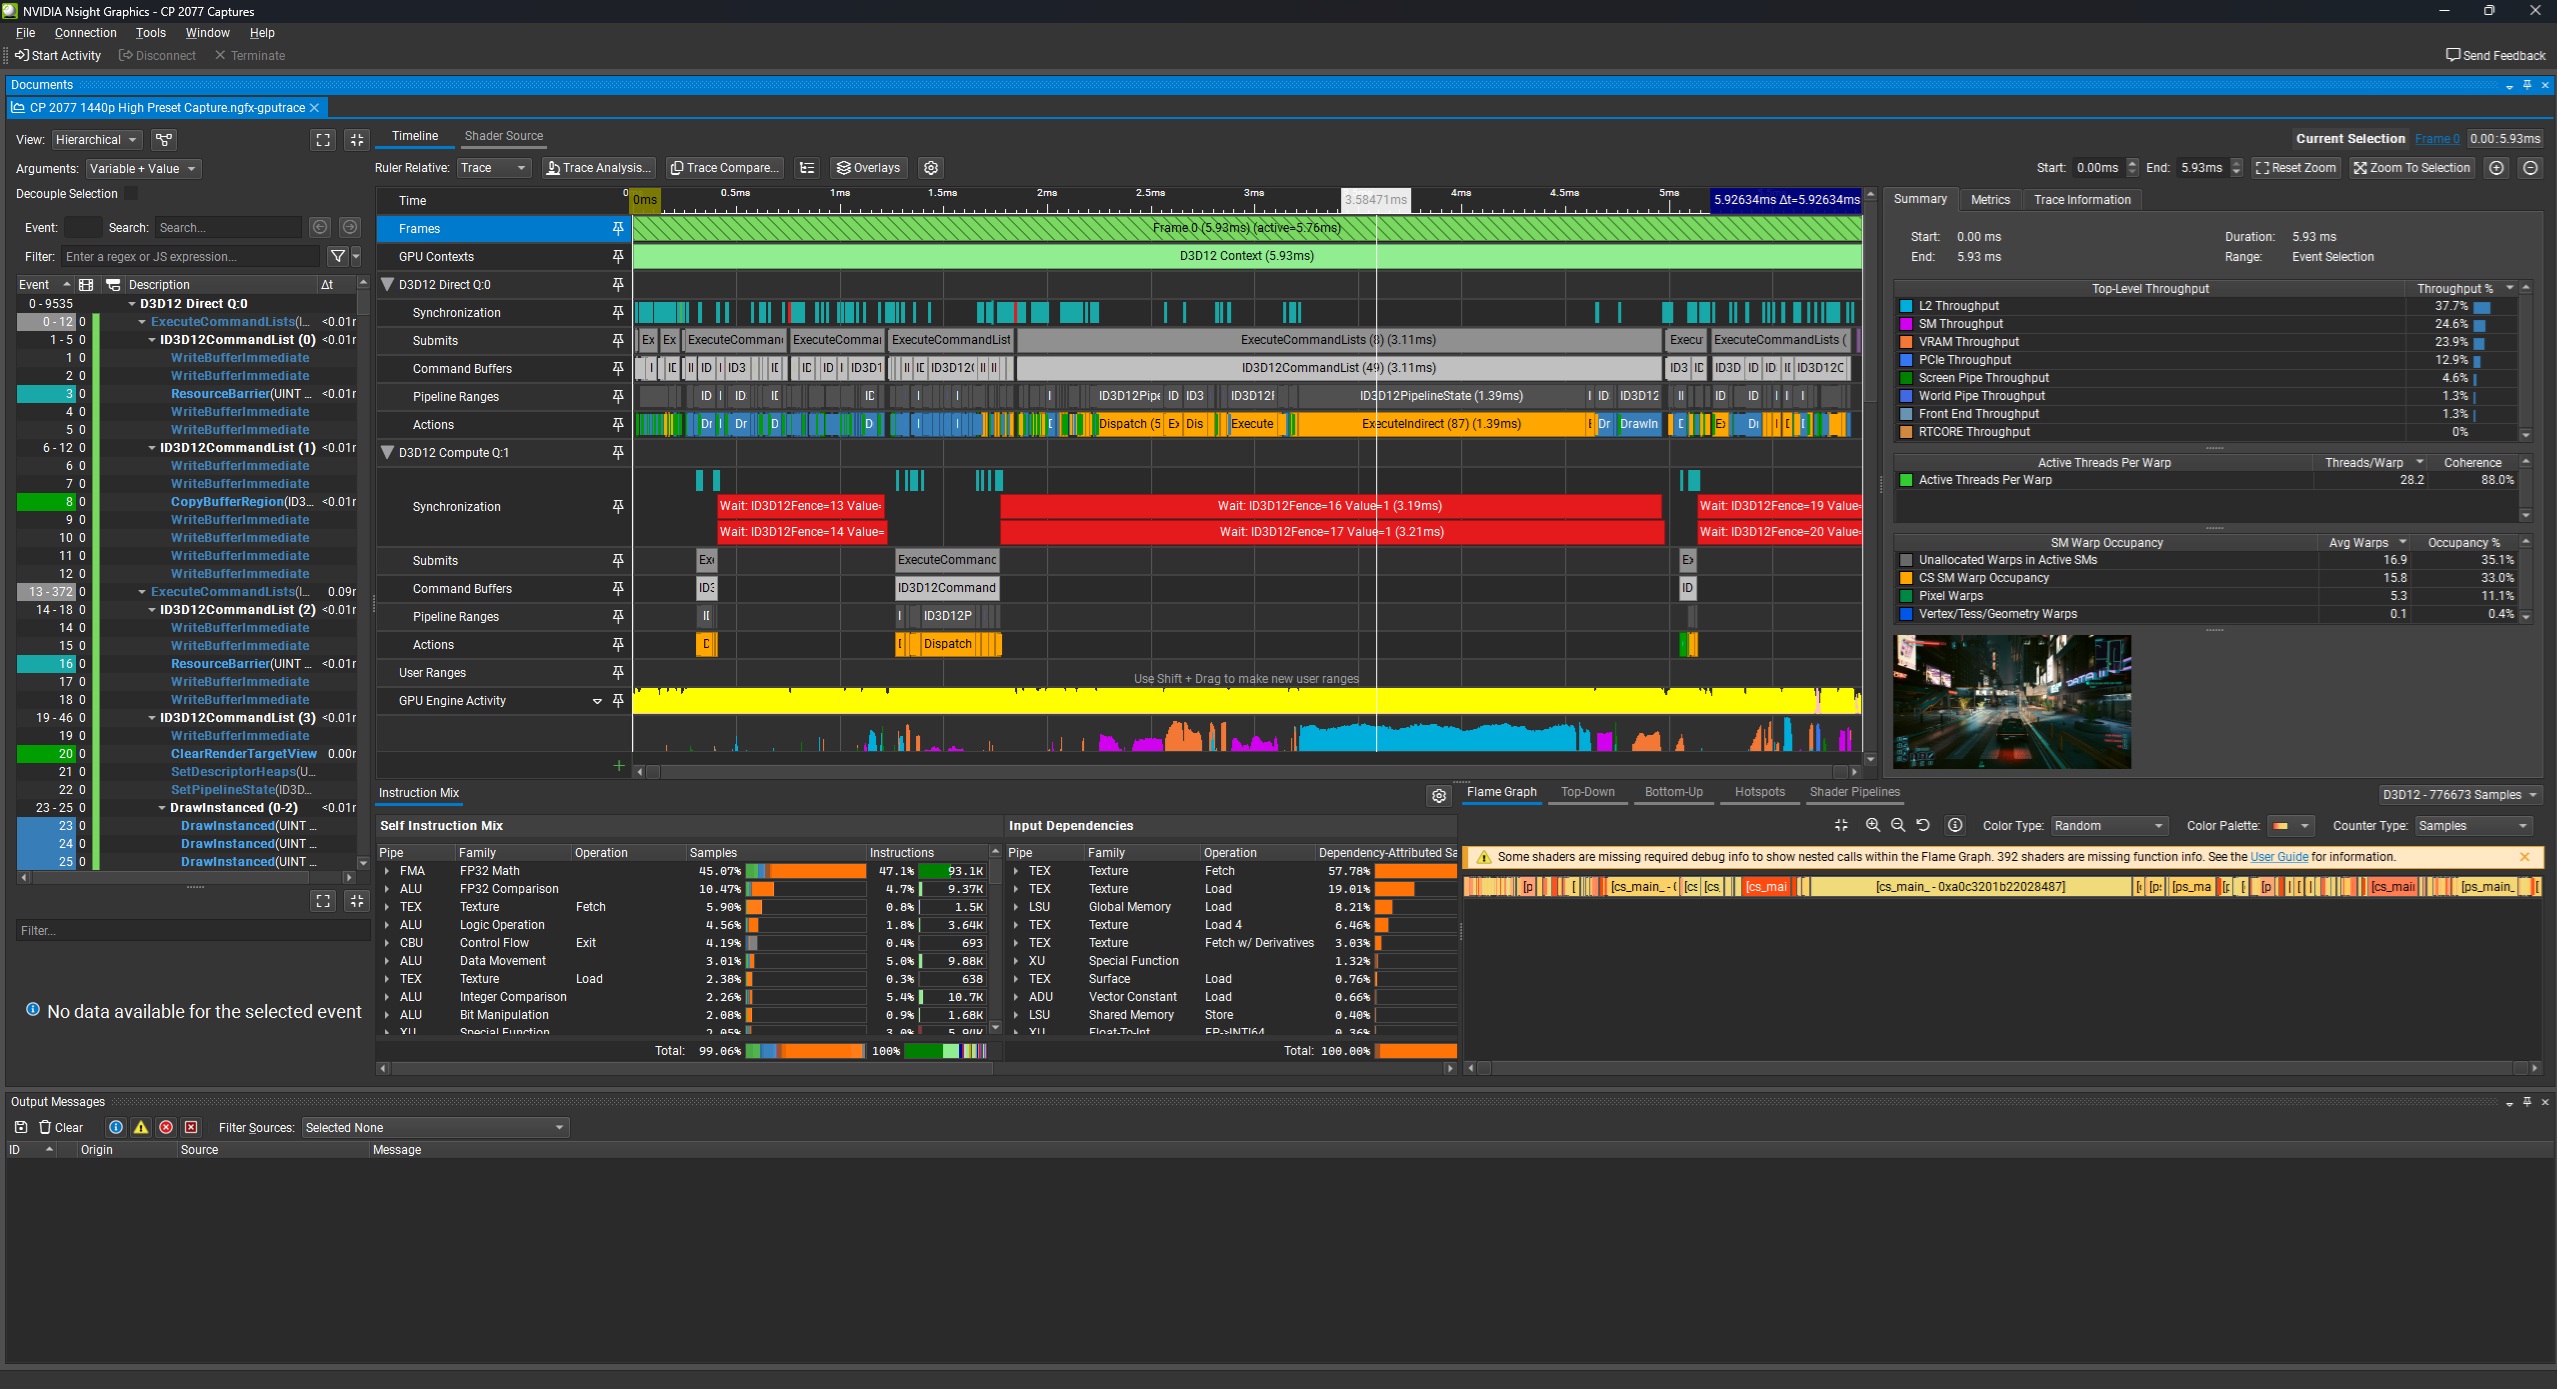
The key observation is that the frame is heavily back-loaded, as the largest single region — occurring late in the frame — accounts for approximately 48.5% of total queued GPU time, dwarfing the earlier geometry-heavy sections. This region is not draw-call dominated; instead, it contains a high density of compute shader dispatches, barriers, and memory management operations that are specific to the Direct3D 12 graphics API.
In other words, the most expensive part of this raster frame is not drawing the world, but rather processing the lighting after the geometry has already been rendered. This makes sense, as REDengine 4 — like the overwhelming majority of modern AAA game engines — is a deferred rendering-based engine.
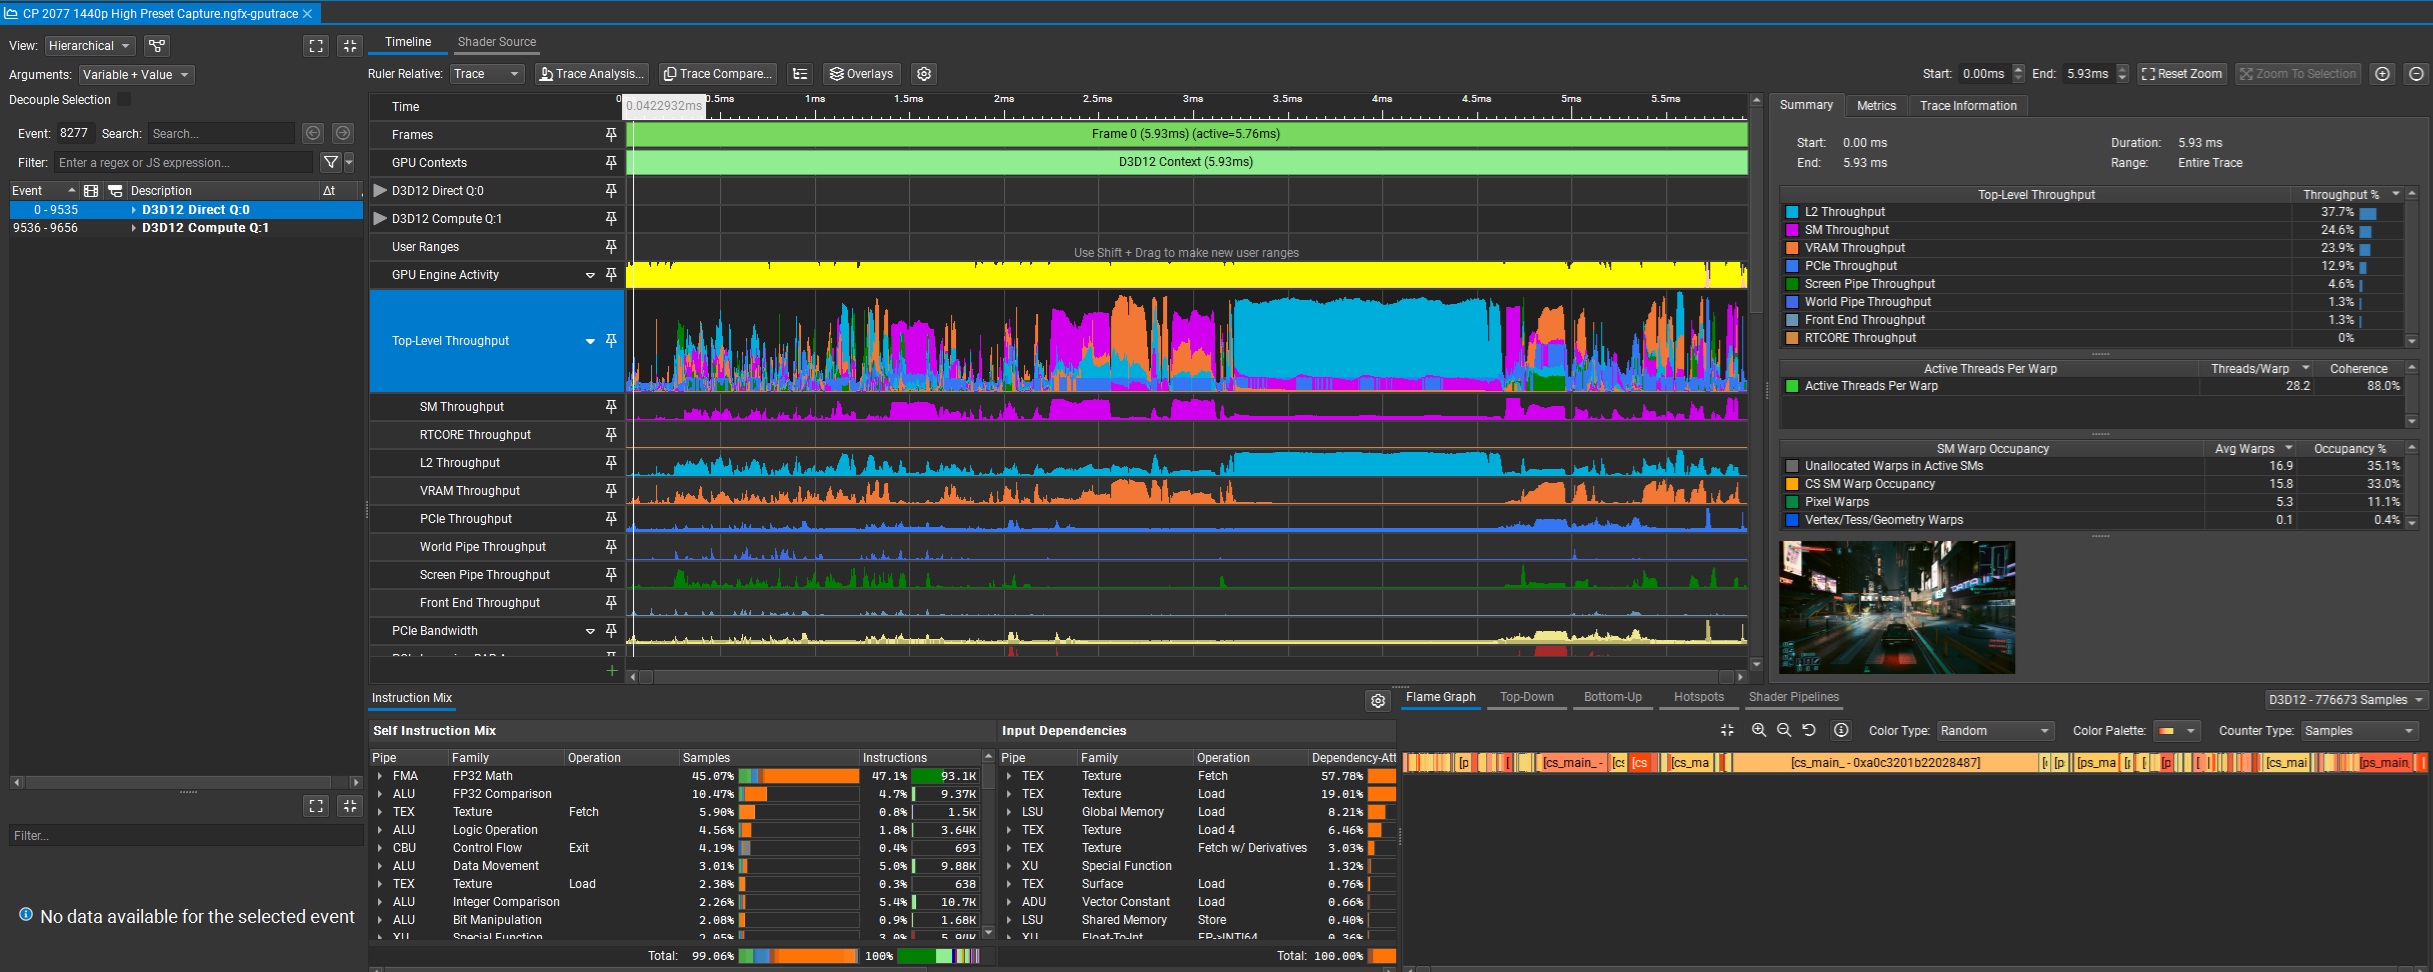 The 1440p High Preset rasterized frame, showcased under Nsight Graphics’s GPU Trace Profiler
The DirectX Intermediate Language (DXIL) Shader Pipelines data reinforce this conclusion.
Across the selected frame, we have the following spread:
Compute shaders: ~68.8% of total samples
Pixel shaders: ~26.6%
Vertex shaders: ~3.7%
Even more striking, a single compute shader alone accounts for nearly 29.8% of all samples, making it the dominant workload in the frame. This is not what one would expect from a traditional raster pipeline. Instead, it clearly indicates that compute-driven lighting effects dominate the frame time cost.
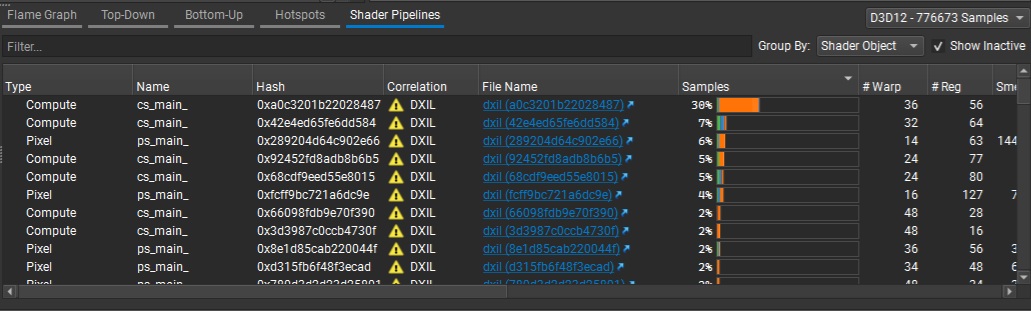 The Shader Pipelines section of the rasterized frame capture
Hotspot analysis
The Shader Profiler Hotspots section provides the most decisive evidence, as the dominant compute shader is heavily concentrated around a few key instructions, most notably:
sampleLevel texture fetch operations
Memory-dependent instructions with high latency
The primary stall reasons are:
Long Scoreboard (LGSB)
TEX Throttle
According to NVIDIA’s documentation, a Long Scoreboard stall occurs when a warp (a collection of 32 threads that execute the same instruction on multiple data) is waiting on data dependencies from memory or texture operations, while TEX Throttle indicates pressure on the texture pipeline itself.
This combination is extremely telling: the shader is not slow because it is doing too much math, but rather, it is slow because it is waiting on data, and this aligns perfectly with the previous frame-wide diagnosis.
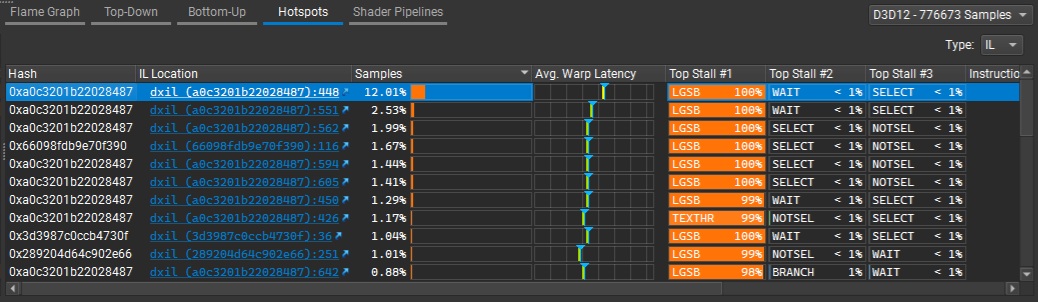 The Hotspots section, with the most demanding (compute) shader highlighted at the top
Trace Analysis
Nsight’s Trace Analysis identifies the following top issues:
L2 Limited
Warp Stalled by L1TEX Long Scoreboard
Warp Stalled by TEX Throttle
Under NVIDIA’s Peak-Performance-Analysis method, this combination is a textbook indicator of a workload that’s limited by the memory subsystem, rather than compute throughput. More specifically:
L2 Limited → pressure on the GPU’s L2 cache
Long Scoreboard → warps stalled waiting for memory/texture data
TEX Throttle → saturation of the texture sampling pipeline, which is related to the L1/Texture cache that’s present on each GPU SM
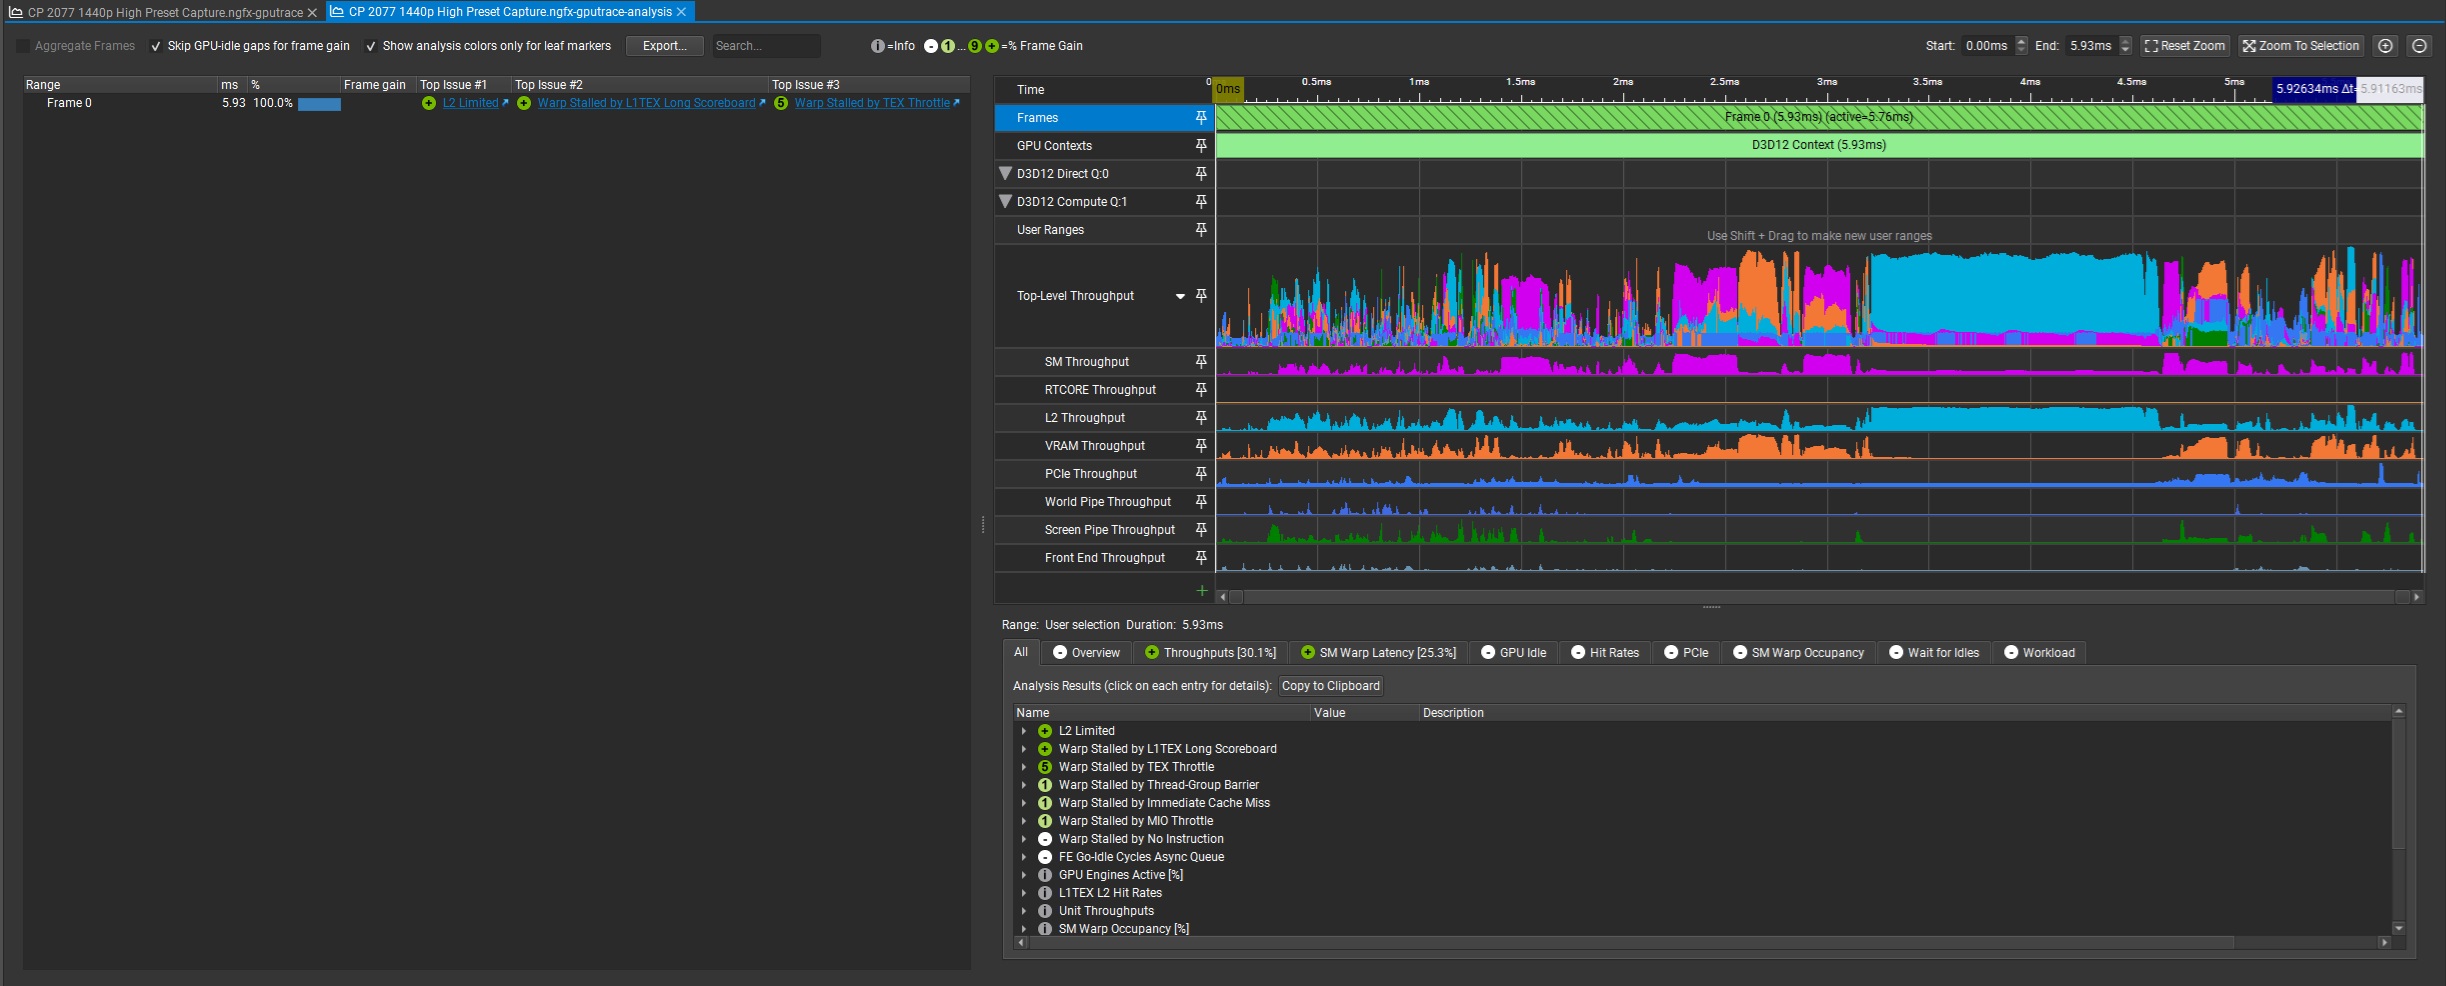 The GPU Trace Profiler Analysis tab in Nsight Graphics for the rasterized frame capture
Rethinking “raster performance.”
This case study highlights an important and often overlooked reality of modern GPU performance:
Traditional rasterization alone no longer defines frame cost, as even in a fully rasterized frame:
The majority of GPU time is spent after geometry submission
The dominant workload is compute-driven lighting processing
Performance is governed by data movement and memory behavior, not just shader arithmetic
This is why metrics such as teraflops (compute throughput), number of compute units, and even raw memory bandwidth fail to fully describe real-world GPU gaming performance.
Modern GPUs are highly complex, deeply pipelined processors where caches, memory latency, data locality, and warp scheduling play a decisive role in game rendering performance.
As NVIDIA’s own profiling guidance shows, stalls like Long Scoreboard are often caused by waiting on memory or texture fetches, not insufficient compute power. In practical terms, this means that a GPU can have enormous theoretical compute throughput, yet still underperform if its shaders are starved for data, and that is exactly what we observed in this Cyberpunk 2077 capture.
Path-traced (with DLSS RR Quality mode) frame trace
Switching to path tracing dramatically reshapes the GPU workload, increasing total frame cost from ~5.9 milliseconds (ms) in the raster case to ~11 ms in this capture, and that’s with DLSS Ray Reconstruction’s combined upscaling and denoising pass. But more importantly, it fundamentally changes where the time is spent. Rather than introducing a single dominant “ray tracing pass”, the frame becomes a highly hybrid workload where rasterization, ray traversal (ray/box and ray/triangle intersection computations), and AI/compute temporal reconstruction and denoising are deeply intertwined.
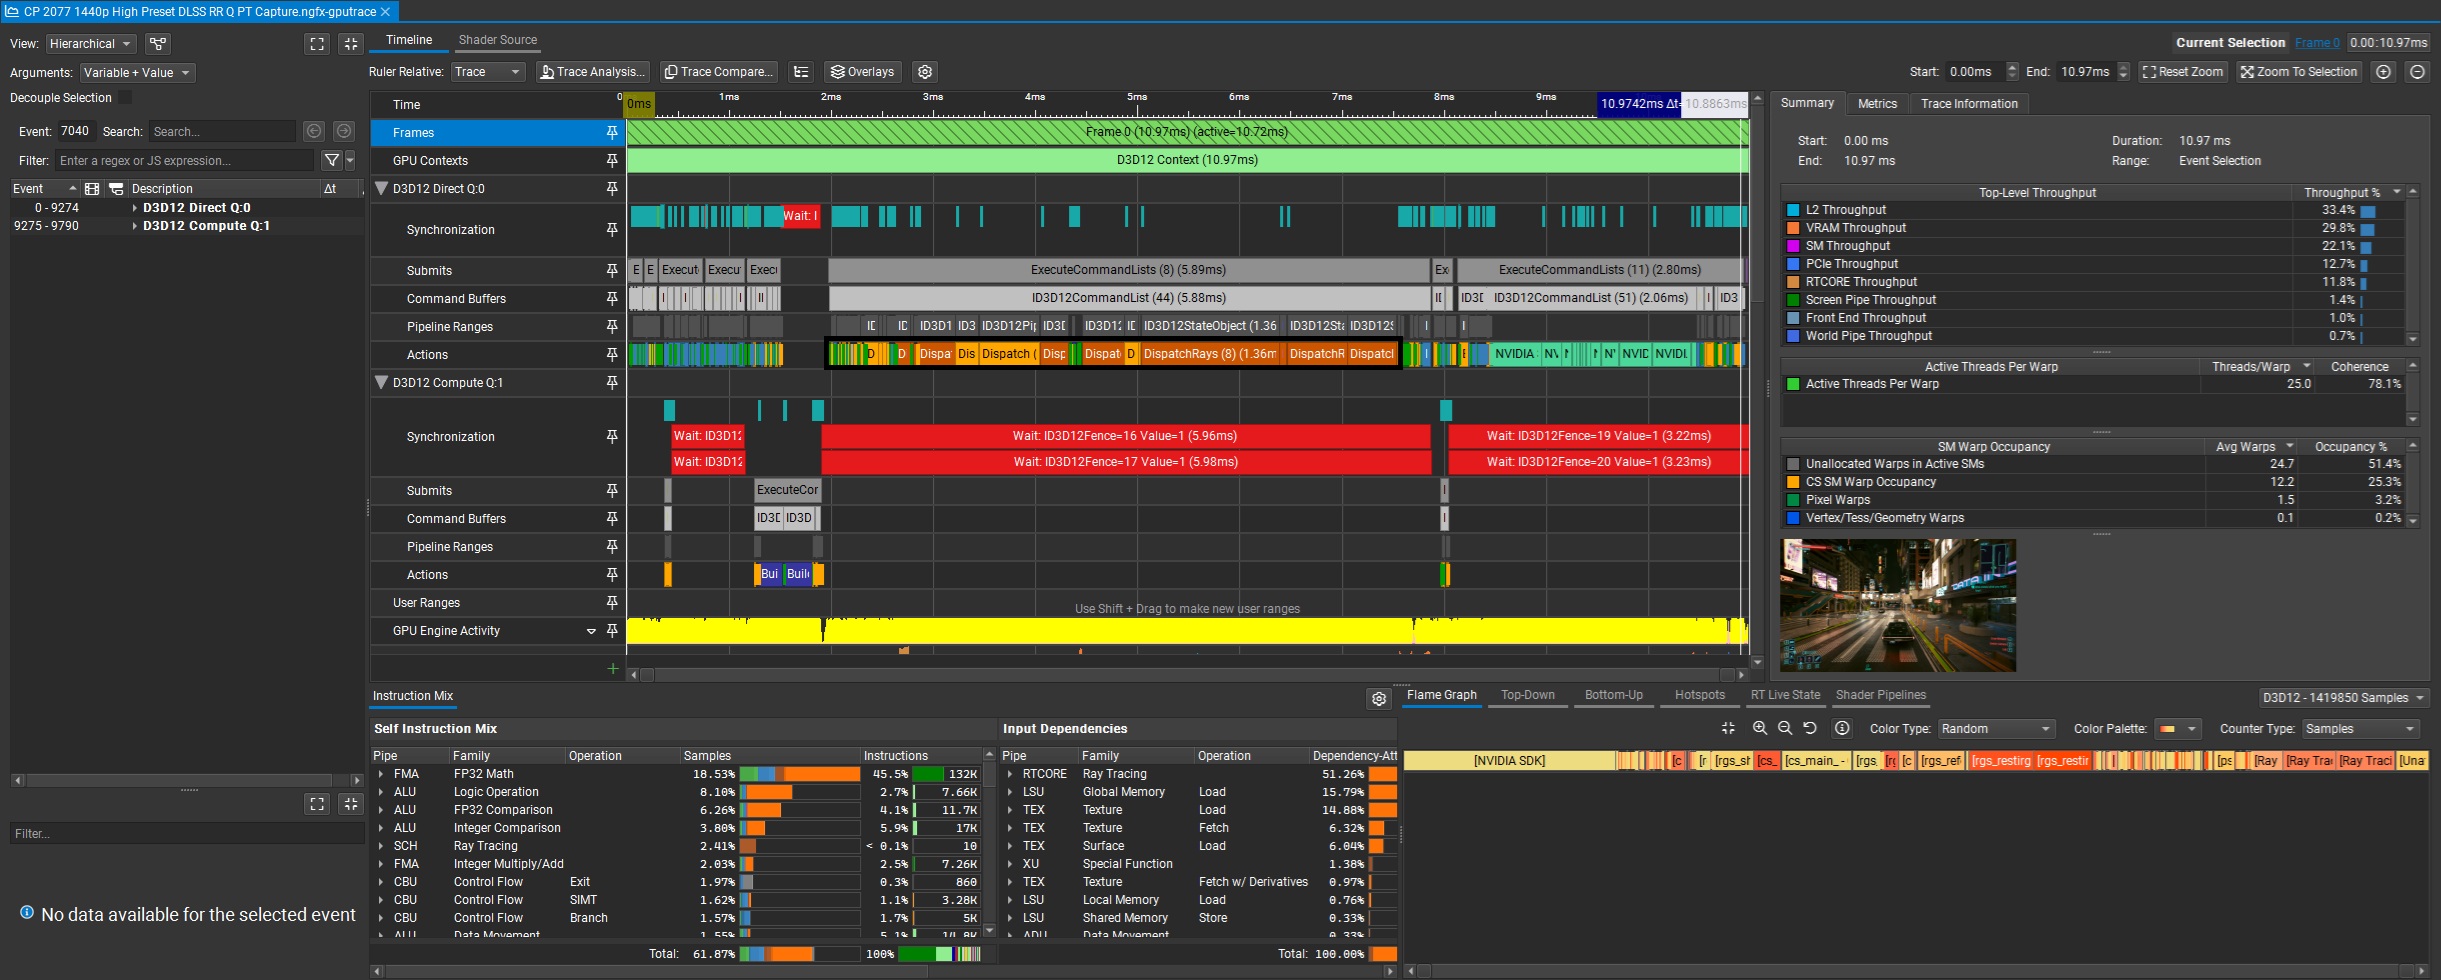 The path-traced frame trace shows a lot of compute shader dispatches and DirectX Ray Tracing (DXR) calls via the DispatchRays method
Despite the presence of explicit DispatchRays calls, the Shader Pipelines and hotspot analysis show that the frame is still overwhelmingly compute-driven, with the majority of shader time concentrated in lighting processing, temporal reconstruction, and denoising. The most expensive shaders remain compute shaders with 2D workgroup layouts, indicating that even in a path-traced configuration, a large portion of the GPU time is spent filtering, denoising, and assembling the final image rather than purely tracing rays.
Nsight Graphics’s Trace Analysis further clarifies the real bottleneck: the frame is primarily L2- and memory-path limited, with dominant stall reasons such as Long Scoreboard and TEX Throttle, indicating that warps frequently wait on data from the cache/memory subsystem. In other words, the limiting factor is not raw RT-core ray/box traversal throughput, but the GPU’s ability to efficiently feed data through its memory hierarchy. This aligns with broader profiling guidance, where workloads dominated by memory latency and bandwidth often fail to fully utilize compute resources despite having high theoretical throughput.
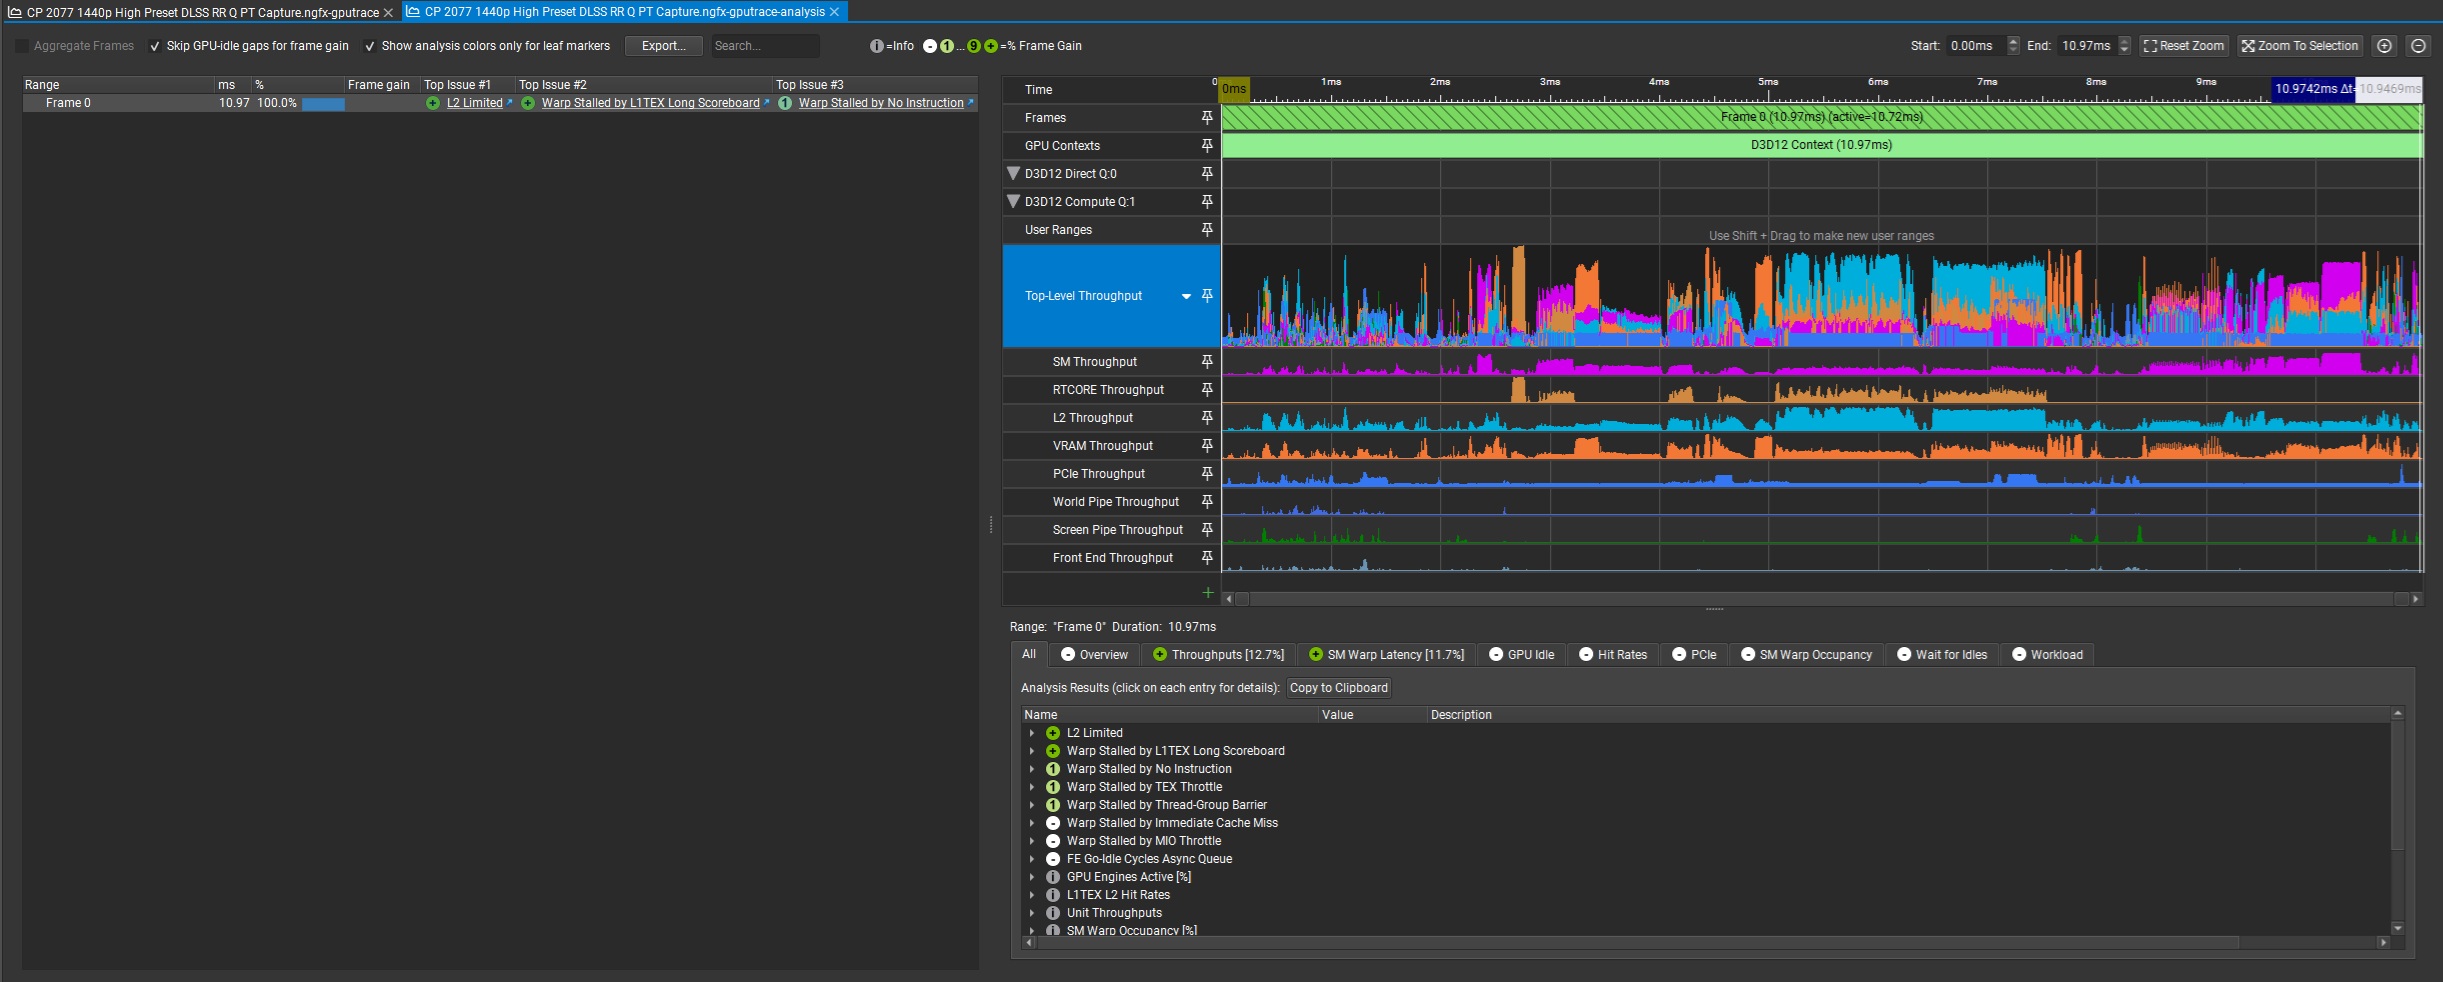 GPU Trace Analysis for the path-traced (and temporally reconstructed/denoised) frame
This has an important implication: ray tracing performance does not scale linearly with RT-core throughput. Even if ray/triangle intersection rates were doubled, real-world performance would still be constrained by factors such as cache locality, memory latency, and shader divergence. Ray tracing — and especially path tracing — is as much a data movement problem as it is a traversal problem.
In practice, this capture shows that modern path-traced rendering is best understood as a compute and memory-bound pipeline, where ray tracing, temporal reconstruction, and denoising form a tightly coupled system, and where the efficiency of the memory subsystem ultimately plays a decisive role in performance.
Conclusion
NVIDIA Nsight Graphics is one of the best (if not THE best) tools currently available for serious NVIDIA GPU performance analysis in modern DX12 and Vulkan games, and GPU Trace Profiler is the centerpiece of that workflow. It gives us a low-level hardware-centric view of a given rendered frame, lets us inspect different GPU queue activities and synchronization, and — when Real-Time Shader Profiling is enabled — opens the door to Shader Pipelines, Hotspots, and even source code-level shader analysis, at least at the intermediate representation level via Microsoft’s DXIL.
The biggest lesson from using it is that meaningful profiling starts with triage, not assumptions. The right workflow is to capture a stable scene, begin with top-level timeline analysis, identify the dominant workloads, and only then drill into the shader-level evidence. That is the heart of NVIDIA’s Peak-Performance-Percentage method, and it remains a solid foundation for understanding why a frame is expensive to render on the GPU in the first place.
CD Projekt RED’s Cyberpunk 2077 makes for an especially good case study because it spans the full range of contemporary rendering techniques, from pure rasterization to hybrid ray tracing, to path tracing, with the option of throwing machine learning-based temporal upscaling and denoising into the mix. Used properly, Nsight Graphics makes those transitions visible in a way that simple performance overlays never can. And that, ultimately, is why a tool like this matters: it turns GPU performance and behavior from guesswork into evidence.

About the author: Sebastian Castellanos is a data scientist by education and training. He’s also deeply passionate about PC gaming hardware and software. He has recently started writing technical articles and guides Wccftech about PC hardware, games and mods.
Follow Wccftech on Google to get more of our news coverage in your feeds.