

Find your next quality investment with Simply Wall St’s easy and powerful screener, trusted by over 7 million individual investors worldwide.
Wondering if Bank of Montreal at around $199.73 is still offering value after a strong run, or if you might be late to the party.
The stock has returns of 5.3% over 7 days, 7.3% over 30 days, 10.0% year to date, 64.4% over 1 year, 88.6% over 3 years and 115.6% over 5 years, which naturally raises questions about how much upside or risk is now priced in.
Recent attention on Bank of Montreal has centred on its position among the major Canadian banks and how it fits into portfolios that focus on established dividend payers. Coverage has also highlighted how investors weigh large bank stocks when thinking about stability and long term total returns.
Simply Wall St currently gives Bank of Montreal a valuation score of 2 out of 6. The next sections will compare what different valuation methods say about that score and finish with a way to understand value that goes beyond just ratios and models.
Bank of Montreal scores just 2/6 on our valuation checks. See what other red flags we found in the full valuation breakdown.
The Excess Returns model looks at how much value Bank of Montreal can create above the return that shareholders require, based on its equity base and profitability. Instead of focusing on cash flows, it concentrates on how effectively the bank is expected to use its equity over time.
For Bank of Montreal, the model uses a Book Value of CA$119.17 per share and a Stable EPS of CA$15.57 per share, sourced from weighted future Return on Equity estimates from 11 analysts. The Average Return on Equity sits at 12.93%, while the Stable Book Value is CA$120.46 per share, based on weighted future Book Value estimates from 9 analysts.
The Cost of Equity is CA$8.64 per share, with an Excess Return of CA$6.93 per share. These inputs are then projected forward and discounted to estimate an intrinsic value of CA$281.36 per share using the Excess Returns Model. Compared with the current share price of about CA$199.73, this implies the shares trade at roughly a 29.0% discount, suggesting they are undervalued on this approach.
Result: UNDERVALUED
Our Excess Returns analysis suggests Bank of Montreal is undervalued by 29.0%. Track this in your watchlist or portfolio, or discover 7 more high quality undervalued stocks.
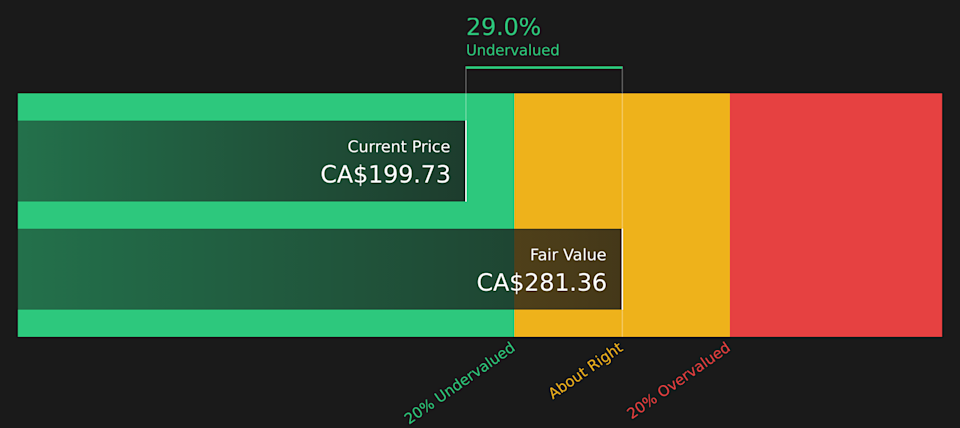 BMO Discounted Cash Flow as at Apr 2026
Story Continues
P/E is a common way to value profitable companies because it connects what you pay for each share with what the bank is currently earning per share. It gives you a quick sense of how much the market is willing to pay for today’s earnings.
What counts as a “normal” or “fair” P/E depends on how fast earnings are expected to grow and how risky those earnings appear. Higher expected growth or lower perceived risk usually supports a higher P/E, while lower growth or higher risk tends to justify a lower one.
Bank of Montreal currently trades on a P/E of 16.35x. That sits above the Banks industry average of 11.28x and also above the peer group average of 14.69x, which might initially look expensive if you only compare to those simple benchmarks.
Simply Wall St’s Fair Ratio for Bank of Montreal is 16.15x. This is a proprietary estimate of what the P/E “should” be, given factors such as earnings growth, profit margins, risk profile, industry and market cap. Because it blends these inputs, the Fair Ratio can be more tailored than a basic industry or peer comparison.
With a Fair Ratio of 16.15x and an actual P/E of 16.35x, Bank of Montreal looks slightly expensive on this measure, but the gap is small enough that it sits close to Fair Value.
Result: ABOUT RIGHT
 TSX:BMO P/E Ratio as at Apr 2026
P/E ratios tell one story, but what if the real opportunity lies elsewhere? Start investing in legacies, not executives. Discover our 2 top founder-led companies.
Earlier it was mentioned that there is an even better way to understand valuation. Narratives are introduced here as your own story for Bank of Montreal that links what you believe about its digital banking push, acquisitions such as Bank of the West, sustainable finance opportunities, credit risks and cost pressures to a set of revenue, earnings and margin forecasts. The Simply Wall St Community page then turns these into a Fair Value that sits beside the current share price and updates as news or earnings arrive. This allows you to quickly see how your view compares with others, whether you lean closer to the more upbeat analyst camp around CA$224.0 or the more cautious view near CA$175.0.
Do you think there’s more to the story for Bank of Montreal? Head over to our Community to see what others are saying!
TSX:BMO 1-Year Stock Price Chart
This article by Simply Wall St is general in nature. We provide commentary based on historical data and analyst forecasts only using an unbiased methodology and our articles are not intended to be financial advice. It does not constitute a recommendation to buy or sell any stock, and does not take account of your objectives, or your financial situation. We aim to bring you long-term focused analysis driven by fundamental data. Note that our analysis may not factor in the latest price-sensitive company announcements or qualitative material. Simply Wall St has no position in any stocks mentioned.
Companies discussed in this article include BMO.TO.
Have feedback on this article? Concerned about the content? Get in touch with us directly. Alternatively, email editorial-team@simplywallst.com