
Animal procedures and ethics statement
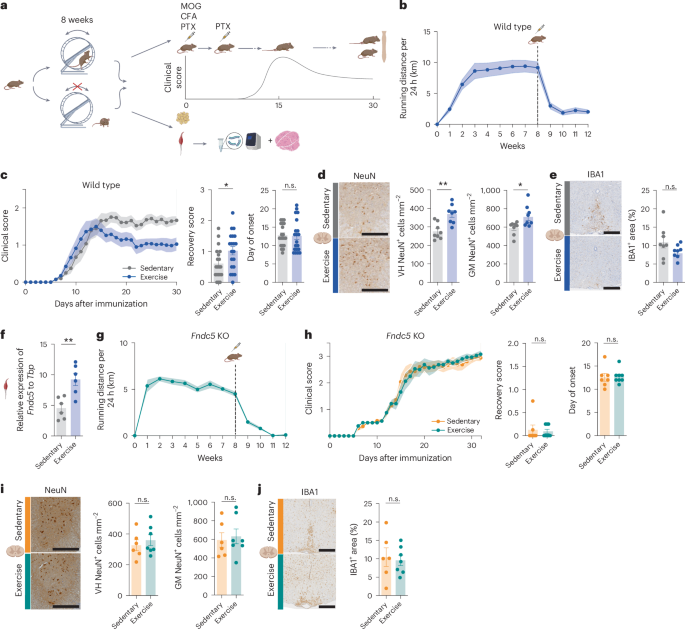
All animal procedures were approved by the Institutional Animal Care and Use Committee (IACUC) of the Massachusetts General Hospital (MGH) or the State Authority of Hamburg, Germany. C57BL/6J (000664, JAX) were used as WT mice. We published the generation and phenotyping of the global Fndc5-KO mice in Kim et al.35 and Islam et al.3. Fndc5-KO mice were maintained with het-to-het breedings on a C57BL6 background. All experimental animals were housed in the specific pathogen-free environment animal facility at MGH with a regular 12 h light and 12 h dark cycle from 07:00 to 19:00, at 20–22 °C and 30–70% humidity. All procedures were carried out during the light-phase. Mice had free access to water and standard chow (Prolab IsoPro RMH 3000, or Altromin 1310, irradiated). Mice were group-housed except for running experiments. For the WT voluntary free-wheel running EAE experiments, 6–8-week-old male mice were used. For all other experiments, 7–13-week-old female mice were used. Assignment to experimental groups was random. Tissues were collected at the indicated timepoints. All procedures were carried out in accordance with the Animal Research: Reporting of in Vivo Experiments (ARRIVE) guidelines45. Genotype for Fndc5-KO mice was confirmed by PCR from tail snips.
EAE
We immunized mice subcutaneously with either 200 μg MOG35–55 peptide (Schafer-N) in Complete Freund’s Adjuvants (CFA) (Difco, cat. no. DF0639–60–6) containing 2 mg ml−1 Mycobacterium tuberculosis (Difco, cat. no. DF3114-33-8) or with the commercially available kit (Hooke Kit MOG35–55/CFA). In addition, we injected 100 ng (WT voluntary wheel-running EAE experiment) or 200 ng pertussis toxin (all other experiments) (Calbiochem, cat. no. CAS70323-44-3, or Emulsion PTX, cat. no. EK-2110) intraperitoneally (i.p.) on the day of immunization and 48 h later. We scored animals daily for clinical signs by the following system: 0, no clinical deficits; 1, tail weakness; 2, hind limb paresis; 3, partial hind limb paralysis; 3.5, full hind limb paralysis; 4, full hind limb paralysis and fore limb paresis; 5, premorbid or dead. Animals reaching a clinical score ≥4 were killed according to the regulations of the local animal welfare legal authorities. All animals were monitored for dehydration and weighed daily. DietGel 76A gels (Clear H2O) were provided to support nutrition. The investigators were blind to the treatment in the AAV8–irisin or recombinant irisin cohorts. Behavioural experiments and tissue collections were performed at the indicated timepoints.
Tail-vein injections of AAV8s
Mice were injected into the tail vein with AAV8–GFP or AAV8–irisin–Flag (1 × 10¹⁰ GC per mouse; UPenn Vector Core) diluted in PBS to a final volume of 100 μl. For details of the generation of the AAV vector, see Islam et al. and Kim et al.3,35. EAE was induced on the same day as the AAV injections.
Recombinant irisin–His injections
Recombinant human/mouse irisin containing a C-terminal His tag was produced in HEK293 (Proteos). The endotoxin level was determined to be <0.500 EU ml−1. The final irisin–His has the correct predicted molecular weight of ~15 kDa in the unglycosylated state and ~25 kDa in the glycosylated form. Healthy WT mice or mice at the peak of EAE were injected with 5 mg kg−1 body weight sterile recombinant irisin–His or PBS i.p. for 2 days, followed by a third injection at 10 mg kg−1 body weight on the next day. After 1 h of the last injection, the animals were killed and tissues collected as described below.
Voluntary free-wheel running paradigm
Mice were weighed and placed individually in type III cages with free access to functional running wheels (Ø, 13 cm), which were either blocked with a magnet (sedentary) or not blocked (voluntary free-wheel running). No other enrichment was present. Running activity was tracked using a magnetic contact-counting instrument (set-up built by Torsten Renz). Similarly, in the Fndc5-KO voluntary wheel-running cohorts, animals were placed in individual cages with either blocked (sedentary) or not-blocked (voluntary wheel running) stainless-steel running wheels (Starr Life Sciences), and running activity was tracked every hour using a revolution counter (VitalView Animal Activity v1.4, Starr Life Science). Running distance and body weights were monitored a minimum of twice per week. After 8 weeks of voluntary access to running wheels or blocked running wheels, EAE was induced. Mice that did not run a minimum of 1 km per 24 h on average were excluded (one WT voluntary wheel-running EAE mouse excluded). We report all information on the basis of the recently published recommendations for minimal reporting criteria for MS exercise studies in animals15.
CFC
CFC was used on day 35 and day 36 of EAE or in healthy age-matched WT mice. Mice were placed in a conditioning chamber (17 cm × 17 cm × 25 cm, Maze Engineers) with Plexiglas sides and a steel bar floor. They explored the chamber for 2 min before receiving two 2-s foot shocks (0.5 mA), spaced 2 min apart. Then, 1 min after the final shock, the mice were removed. A total of 24 h later, they were returned to the conditioning chamber (context A) for 3 min without receiving any additional shocks. Freezing behaviour during this session was recorded and analysed using ANY-maze software (Stoelting). Freezing served as a proxy for memory performance, as it reflected the mice’s recall of the previous shock experience in context A on day 1, expected to result in marked freezing episodes on day 2. After testing in context A, mice were placed in an alternate context chamber (context B) with no grid floor and newly patterned walls for 3 min, as before. Mice that did not exhibit freezing on day 1 after receiving shocks were excluded from analysis, as freezing could not be used as a measure of learning or memory for these animals. All tests were performed at the same time during the light phase in a dedicated behavioural suite. Experimenters were blinded to the treatment.
Perfusion and tissue collection
Brain, spinal cord, liver, gastrocnemius muscle, epididymal/perimetrial fat pads, blood and eyeballs were collected for molecular, histological and ultrastructural analysis34. In the WT and the WT voluntary wheel-running experiment, mice were anesthetized i.p. with 100 µl solution (10 mg ml−1 esketamine hydrochloride (Pfizer) and 1.6 mg ml−1 xylazine hydrochloride (Bayer) dissolved in water) per 10 g of body weight. The epididymal fat pads were dissected and weighed. Then, mice were perfused with ice-cold PBS and the gastrocnemius muscle was dissected. After EAE, mice were perfused with 4% paraformaldehyde (PFA)34 and the remaining tissues were collected. For the WT cohort (CFC test), AAV8–irisin cohort, Fndc5-KO voluntary wheel running and recombinant irisin–His cohort, the mice were anesthetized with isoflurane and blood was collected via the vena cava. Then, mice were perfused with ice-cold PBS alone, ice-cold PBS followed by 4% PFA or ice-cold PBS followed by 4% PFA, 1% glutaraldehyde (GA; G6403, Sigma) in 0.1 M phosphate buffer (BB-185, Boston BioProducts) (for transmission electron microscopy (TEM)). As indicated below, tissues were either snap-frozen with liquid nitrogen, directly frozen in embedding solution (Tissue-Tek O.C.T. compound), fixed in 4% PFA or fixed in a mixture of 4% PFA, 1% GA in 0.1 M phosphate buffer. Gastrocnemius muscle samples were snap-frozen with liquid nitrogen and then frozen in embedding solution for cryosectioning.
Irisin–Flag and irisin–His ELISA
At the end of the EAE experiments, where indicated, blood samples were collected in heparin-coated tubes (365985, BD Microtainer) and centrifuged to separate the plasma. The plasma fraction was stored at −80 °C until analysis. When indicated, prefrontal cortex and spinal cord tissue previously snap-frozen in liquid nitrogen were homogenized in RIPA buffer (R0278, Sigma) supplemented with protease (1861279, ThermoFisher Scientific) and phosphatase inhibitors (1862495, ThermoFisher Scientific). After protein quantification using a Pierce BCA protein assay kit (23225, ThermoFisher Scientific), the tissue supernatants normalized to the same total protein amount for all animals were used for analysis. For the irisin–Flag enzyme-linked immunosorbent assay (ELISA) assay, 96-well plates were coated with an anti-irisin capture antibody (MAB8880, R&D) in PBS and incubated overnight at 4 °C. The following day, plates were washed four times with 0.1% PBS with Tween (PBST), then blocked with 1% BSA for 1 h at room temperature (RT). After blocking, the plates were washed again with 0.1% PBST, and standards (0–200 ng ml−1) along with plasma samples were added to the wells, followed by a 2-h incubation at RT. Plates were then washed four times with 0.1% PBST and incubated with an anti-Flag detection antibody (14793S, CST) for 2 h at RT. After another wash with PBST, a horseradish peroxidase-conjugated secondary antibody was added for 30 min. Following additional washes, 3,3′,5,5′-tetramethylbenzidine (TMB) chromogen (ab171522, Abcam) was added as the detection reagent. Absorbance at 450 nm was measured using a plate reader (FLUOstar Omega, BMG Labtech) after stopping the reaction with stop solution (ab171529, Abcam). The irisin–His ELISA assay was performed similarly as above with the following adaptations: standards and samples were plated in a His Tag Antibody Plate (L00440C, GenScript) and incubated overnight at 4 °C, and an anti-irisin antibody (AG-25B-0027-C100, Adipogen) was used as detection antibody for 1 h at RT. The irisin concentration was determined by referencing a standard curve generated with either a recombinant irisin–Flag (AG-40B-0136-C010, Adipogen) or a recombinant irisin–His.
Longitudinal blood collection
For longitudinal tracking of immune-cell subsets, blood was collected by submandibular venipuncture 3 days before immunization (day −3), at symptom onset (day 8), at symptom peak (day 15) and in the chronic phase of EAE (day 22). Blood was collected in heparinized tubes and cryoprotected using 55-5 BloodStor media (STEMCELL Technologies) following manufacturer’s instructions. Cryoprotected blood samples were stored in liquid nitrogen until use.
Immunophenotyping by flow cytometry of blood and spinal cord tissue
To avoid technical batch effects, all blood samples collected during the longitudinal study were processed for flow cytometry at the same time, using the same reagents. Cryopreserved blood samples were washed and resuspended in PBS and stained using a Zombie NIR fixable dye (Biolegend) for 30 min. The cells were then washed and resuspended in PBS containing 1% fetal bovine serum, 0.01% sodium azide (RICCA Chemical) and 5% FcR blocking reagent (Miltenyi Biotec) for 10 min. Blocked cells were incubated for 30 min with fluorophore-conjugated primary surface antibodies (Supplementary Table 3). Surface-stained cells were washed and resuspended in fixation buffer (Biolegend) for 20 min, followed by permeabilization wash buffer (1×) (Biolegend). Permeabilized cells were incubated for 30 min with intracellular antibodies (Supplementary Table 3). All incubation steps were performed at 4 °C, protected from light. Cells were analysed on an Aurora spectral flow cytometer (Cytek) equipped with 355-nm, 405-nm, 488-nm, 561-nm and 640-nm lasers, using SpectroFlo software, version 3.3.0. At least 100,000 events were collected from each sample for analysis. Data were analysed using FlowJo software, version 10.8.1 (TreeStar).
Spinal cord immunophenotyping
The animals received an intravenous injection of 250 μg brefeldin A, a macrolide that disrupts protein exocytosis, to allow better detection of cytokines by flow cytometry46. In total, 4 h after brefeldin injection, the mice were anesthetized and the spinal cords were rapidly extracted in ice-cold PBS, transferred to microfuge tubes for mechanical trituration and then enzymatically dissociated for 25 min at 37 °C, using a papain-based method according to the manufacturer’s specifications (Miltenyi Biotec). Before immunolabelling, myelin was removed from cell suspensions using commercially available myelin depletion beads (Miltenyi Biotec). Resulting cell suspensions were labelled for flow cytometry as described above, with the antibodies presented in Supplementary Table 4. Samples were analysed by spectral flow cytometry as described above, and at least 1,000,000 events were collected from each sample for analysis.
Immunohistopathology
Cervical spinal cords were postfixed in 4% PFA for 60 min. Then, the tissue was dehydrated and cryoprotected in 30% sucrose solution in PBS for at least 1–2 days at 4 °C, frozen in embedding solution (Tissue-Tek O.C.T. compound) and cut into 12-μm-thick transverse cryosections. Brains or spines were postfixed for 24 h at 4 °C. Spines were decalcified, dehydrated and paraffinized and brains were dehydrated and paraffinized and cut into ~5-μm-thick transverse paraffin sections. Succinate dehydrogenase histochemistry (SDH)/cytochrome c oxidase (COX) histochemistry was performed according to the standard procedures of the University Medical Center Hamburg–Eppendorf (UKE) Mouse Pathology Facility. Briefly, gastrocnemius or cervical spinal cord sections were incubated for 60 min at 37 °C with SDH (0.2 M sodium succinate, 50 mM Tris-Cl and 50 mM MgCl2) or COX reaction media (diaminobenzidine tetrahydrochloride, cytochrome c and bovine catalase (all from Sigma) in 0.2 M phosphate buffer) and embedded with Aquatex (Merck). Images of tissue sections at 200× magnification were scanned using a Zeiss MIRAX MIDI Slide Scanner (Carl Zeiss, MicroImaging GmbH). Paraffin sections were stained for H&E, LFB and with antibodies directed against CD3, GFAP, NeuN, Chat, MBP and IBA1 that were visualized using the avidin–biotin complex technique with 3,3′-diaminobenzidine (brown stain) (UltraView Universal DAB Detection Kit, Roche) with the Ventana BenchmarXT (Roche) according to the standard procedures of the UKE Mouse Pathology Facility34. Images were analysed with QuPath version 0.3.0 software (https://qupath.github.io). Muscle fibres that were positive for SDH and COX were counted, and the percentage of positive-to-negative fibres or area of positive SDH staining was calculated. For quantification of complex IV activity in the spinal cord, for each annotated region (grey matter or ventral horn), the mean DAB optical density was calculated. Numbers and areas of H&E+ inflammatory foci per spinal cord section and numbers of Chat+ motor neurons per area were quantified manually. We used customized counting masks for CD3+ cells and NeuN+ cells and thresholding masks for the IBA1+ area, the GFAP+ area and the LFB- and MBP-stained area. All analysis conditions were standardized. For quantification, the hippocampus was divided into up to three sections per animal, the spinal cord was divided into up to four sections per animal and the mean per animal was calculated, which was used for subsequent statistical comparisons.
Immunofluorescence
Brains or cervical spinal cords were postfixed in 4% PFA for 60 min. Then, the spinal cords were dehydrated and cryoprotected in 30% sucrose solution in PBS for at least 1–2 days at 4 °C, frozen in embedding solution (Tissue-Tek O.C.T. compound) and cut into 12-μm or 40-µm-thick transverse cryosections. Then, immunofluorescence staining was carried out on slides or free-floating sections33. Slices were washed three times with PBS, permeabilized with 0.25% Triton X-100 in 1× PBS for 15 min, blocked with either 10% normal donkey serum in PBS containing 0.05% Triton X-100 or 3% BSA, 3% normal goat serum and 0.1% Triton X-100 in 1× PBS for 45 or 60 min (followed by Fc block with fab fragment for 60 min at RT for the integrin αV/β5 staining) and subsequently stained overnight in a humidified slide staining system at 4 °C with primary antibodies (NeuN, Synapsin1/2, IBA1, irisin, integrin αV/β5; Supplementary Table 1). All additional steps were carried out at RT. Secondary antibodies were used according to Supplementary Table 2 for a 2-h incubation in a humidified chamber, and slices were embedded in ROTIMount FluorCare 4′,6-diamidino-2-phenylindole (DAPI) (Carl Roth, cat. no. HP20.1) or Fluoromount-G (E3325-RH35, SouthernBiotech). Paraffin-embedded spinal cord slices were dewaxed, rehydrated and processed by antigen retrieval for 10 min in boiling 10 mM sodium citrate buffer (pH 6.0). Slices were permeabilized with 0.1% Triton X-100 and blocked with 5% BSA in PBS with 0.1% Triton X-100 for 1 h, followed by incubation of the primary antibodies in 3% BSA/PBS with 0.1% Triton X-100 overnight at 4 °C. Images were captured in Z-stack mode using a confocal microscope with a 20× or 60×/0.8 objective (LSM 900, Zeiss). Average intensity projections were used for analysis. NeuN+ neurons in the hippocampus of WT mice were manually counted within regions of interest (ROI) of the same size and comparable localization between mice. Counterstaining with DAPI was used to identify and separate neuronal cell bodies. Synapsin+ puncta in the ventral horn were quantified by a customized counting mask in ImageJ. The ROI of the motor neurons for the integrin αV/β analysis was manually determined. Mean fluorescence intensity (MFI) of irisin was calculated by using Fiji (ImageJ, NIH) with background subtraction. NeuN or GFAP immunofluorescence was used to define ROIs corresponding to neuronal cells or astrocytes. NeuN+ or GFAP+ ROIs were further filtered to include only those overlapping with DAPI+ nuclear masks, and the mean irisin intensity was measured within these DAPI-confirmed NeuN+ or GFAP+ ROIs (Supplementary Data 6). Analysis was standardized across conditions and performed to respective controls. For quantification, the hippocampus was divided into up to two sections per animal and the spinal cord into up to four sections per animal.
Eyes were postfixed in 4% PFA for 4 h and afterwards transferred to 30% sucrose (in PBS) for cryoprotection. Retinas were dissected from the eyes and four even cuts were made to create a flat retina, which was then processed for RGC staining. Retina samples were then stained with Anti-BRN3A antibody47. Briefly, optic nerves were dissected and evenly divided into three parts, vertically placed into Tissue-Tek mould (10 mm × 10 mm × 5 mm) filled with O.C.T., snap-frozen directly on dry ice, cross-sectioned at 16-μm thickness and then mounted on slides for further immunofluorescence staining with IBA1 and GFAP. After three washes with PBS, the slices were incubated with fluorophore-conjugated secondary antibody in the dark for 2.5 h, washed with PBS three times and then mounted in ROTIMount FluorCare DAPI (Carl Roth, cat. no. HP20.1)47. Fluorescent images of the retina or optic nerve were acquired with Zeiss Axio Observer Z1. Constant exposure settings were used between samples. In each retina section, 12 regions (central, middle and peripheral; four locations each) were selected and the number of BRN3A+ RGCs was determined using a semi-automated MATLAB algorithm previously developed48. The positive area of IBA1 and GFAP was calculated for proximal, middle and distal regions of optic nerves using Fiji (ImageJ, NIH). Manual thresholding was applied and kept consistent between samples. Each reported value represents the average of quantifications from the three regions within each optic nerve47.
TEM
After dissection and postfixation in 4% PFA and 1% GA in 0.1 M phosphate buffer, cervical spinal cords were cut in 1-mm transverse sections and postfixed in 1% osmium tetroxide (OsO4) for 1 h. Following osmication, the sections were dehydrated using ascending steps of ethyl alcohol concentration, followed by two rinses in propylene oxide. Infiltration of the embedding medium was performed by immersing the pieces in a 1:1 mixture of propylene oxide and Epon and finally in neat Epon and hardened at 60 °C. Semithin sections (0.5 µm) were prepared for light microscopy, mounted on glass slides and stained for 1 min with 1% Toluidine blue. Ultrathin sections (60 nm) were cut and mounted on copper grids. Sections were stained using uranyl acetate and lead citrate. Thin sections were examined, and motoneurons from the anterior horn were photographed using an EM900 (Zeiss) electron microscope equipped with a TRS 2K digital camera (A. Trondle, Germany). Panoramic overview images of single motoneurons were obtained by tiling 3 × 3 TEM images obtained at a magnification of 7,000×. Five motor neurons per animal were analysed for synapses. Numbers of synapses and synaptic contacts were quantified. A synaptic contact with an active zone was defined as a postsynaptic density on the motor neuron connected to a presynapse with visible vesicles. For each motor neuron, we additionally quantified the percentage of cell membrane covered by synaptic contacts. Ten motor neurons per animal were analysed for mitochondrial density and elongation. ROIs of the same size were defined within the cytoplasm of the motor neuron, and the mitochondria within the ROI were counted. The mitochondria count was used to calculate mitochondrial density per area of the ROI. Furthermore, the mean mitochondrial size and the elongation (aspect ratio) were calculated. The analysis was performed using ImageJ (NIH).
Antibodies
All primary and secondary antibodies, with source, dilutions and validations, are presented in tables in the Supplementary Information.
Nucleus isolation and flow cytometric sorting of the spinal cord
After the mice were perfused with ice-cold PBS, the spinal cords were dissected out into ice-cold HBSS and snap-frozen in liquid nitrogen until nuclei isolation. The spinal cord was homogenized with potters (25× loose, 20× tight) in 2 ml EZ lysis buffer (10 mM Tris pH 7.4, 10 mM NaCl, 5 mM MgCl2, 0.5% NP-40) with Recombinant RNase Inhibitor (Takara Bio 2313 A). The preparation was spun down at 500g for 4 min at 4 °C to remove debris. The nuclei suspension was resuspended in 1,000 μl ice-cold nucleus incubation buffer (340 mM sucrose, 2 mM MgCl2, 25 mM KCl, 65 mM glycerolphosphate, 5% glycerol, 1% EDTA, 2% BSA) with P1000 with RNAse-free filter tips. The nuclei suspension is transferred through a 30-μM filter (preseparation filter for 15 ml falcon) on top of 15 ml falcon. The suspension was then stained with anti-NeuN 1:500 (Alexa Fluor 647 tagged anti-NeuN antibody ab190565) and Hoechst 33342 (Invitrogen H3570) with RNAseI inhibitor 15 min before sorting using a BD FACSAria II Cell Sorter (MGH Pathology: Flow Cytometry Core, nozzle 100 µm). NeuN+ and NeuN− nuclei fractions were collected in 5 ml PBS with 1% endotoxin-free BSA with RNAseI Inhibitor and snap-frozen.
qRT–PCR
Total RNA was isolated from the gastrocnemius muscle, liver or sorted nuclei using the RNeasy Mini Kit (Qiagen) according to manufacturer’s instructions. For the gastrocnemius muscle, RNA was reverse transcribed to cDNA with the RevertAid H Minus First Strand cDNA Synthesis Kit (Thermo Fisher). Gene expression was analysed by qPCR with reverse transcription (qRT–PCR) performed in an ABI Prism 7900 HT Fast Real-Time PCR System (Applied Biosystems) using TaqMan Gene Expression Assays (Thermo Fisher) for Ppargc1a (Mm00464452_m1), Fndc5 (Mm01181543_m1) and Tbp(Mm01277042_m1). Gene expression was calculated as 2−ΔCT relative to Tbp as endogenous control. qRT–PCR was performed in triplicates using Power SYBR Green PCR Master Mix (4367660, Thermo Fisher Scientific) in a QuantStudio5 Real-Time PCR system (Applied Biosystems). For liver tissue, first-strand cDNA was generated using equal amounts of RNA and the High Capacity cDNA Reverse Transcription Kit with RNase Inhibitor (4374967, Thermo Fisher Scientific). For sorted nuclei from the spinal cord, first-strand cDNA was generated using equal amounts of RNA and the Superscript IV first-strand synthesis system (18091050, Invitrogen, Thermo Fisher Scientific). qRT–PCR was performed using Power SYBR Green PCR Master Mix (4367660, Thermo Fisher Scientific) in a QuantStudio5 Real-Time PCR system (Applied Biosystems). Relative quantification of gene expression normalized to Rps18 (liver) or Tbp (sorted nuclei) was determined by the comparative Ct method (ΔΔCt). Primers were custom designed and ordered from Integrated DNA Technologies. Primer sequences are presented in the Supplementary Information as Supplementary Table 5.
RNA-seq and data analysis
RNA extraction, library preparation and sequencing reactions from fluorescence-activated cell-sorted nuclei were conducted at GENEWIZ. Trimmomatic v.0.36 was used to trim sequence reads, removing any adaptor sequences and low-quality nucleotides. The reads were aligned to the Ensembl mouse reference genome (GRCm38) using STAR v.2.5.2b. with default parameters. The overlap with annotated gene loci was quantified using featureCounts v.1.5.2. Differential expression analysis was performed with DESeq2 (v.3.12) with a two-sided Wald test followed by Bonferroni–Hochberg correction. Genes were called differentially expressed with a minimal log2(FC) of |1| and false discovery rate (FDR)-adjusted P < 0.05. Gene lists were annotated using biomaRt (v.4.0). Principle component analysis was executed using the scikit-learn package (v. 1.5.1). GSEA was conducted with the clusterProfiler package (v. 4.12.5) and the similarity between gene sets was calculated using the Jaccard correlation coefficient (Supplementary Data 6). Data processing was performed on a local machine with the same computational environment settings.
Data integration with scRNA-seq data from voluntary free-wheel running mice
In Sun et al., young (2 months old) and old (16-months old) male C57BL/6J mice underwent a 12-month voluntary running wheel regimen, spinal cord tissues were collected and snRNA-seq was performed (CRA007207)33. The publicly available DEG list was filtered for: spinal cord tissue, neuronal cell type and young and old running animals. DEGs were defined as genes with adjusted P value <0.05. These DEGs were subsequently compared with our DEG (data reported in Supplementary Data 3).
Data integration with motor neuron BAC-TRAP data from EAE mice
In Schattling et al., RNA from spinal cord motor neurons from EAE and healthy control mice were collected during the acute phase using BAC-TRAP technology and bulk RNA-seq was performed (GSE104899)27. In Woo et al., RNA from spinal cord NeuN+ nuclei from EAE and healthy control mice was analysed using bulk RNA-seq (GSE249192)29. EAE-dysregulated genes were defined as genes with a minimal log2(FC) <−1 and FDR-adjusted P < 0.05 in both datasets. These DEGs were subsequently compared with our DEG list results (data reported in Supplementary Data 4 and 5).
Analysis of published EAE sequencing datasets to identify cell type-specific EAE-regulated genes
Raw count matrices and metadata from publicly available RNA-seq datasets were retrieved from the Gene Expression Omnibus (GEO) repository. GSE118948 contains a single-cell sequencing dataset of CD45+ leucocytes in EAE isolated from the spinal cords of EAE mice 15 days after immunization. Analysis of the single-cell data was performed using Seurat. The provided cell type annotation from the original publication24 was used to perform Wilcoxon-test differential expression analysis of T cells, neutrophils, dendritic cells, macrophages, monocytes, CNS-associated monocytes and microglia of healthy and acute EAE mice. Bulk sequencing data from GSE194071 (ref. 25) were used to analyse spinal cord microglia of acute and chronic recovery EAE mice, GSE100329 (ref. 26) was used to analyse spinal cord astrocytes from acute and chronic progressive EAE mice, GSE104899 (ref. 27) and GSE279707 (ref. 29) were used to analyse spinal cord motor neurons from acute EAE mice and GSE249192 (ref. 28) was used to analyse cortical motor neurons from acute and chronic EAE mice. Bulk sequencing data were analysed using DESeq2. We calculated the signed −log10 FDR-adjusted P value for the visualization. The methodological details for the stimulations, treatments or preparations can be found in the respective references.
Marker analysis
Published marker genes for reactive astrocytes31, disease-associated astrocytes30 and activated microglia32 were compared with our GFP versus treatment differential expression data from spinal cord NeuN− nuclei. Genes were visualized using log2(fold change, FC) and adjusted P values from our RNA-seq analysis.
Statistical analyses
The complex bioinformatic analyses of the RNA-seq data are described above in detail. Statistical analysis of the remaining data was performed using GraphPad Prism 10.3.1. Significance was assigned to differences with a P value less than 0.05 unless stated otherwise. Data are expressed as mean ± s.e.m. unless stated otherwise. Sample size was based on previously published studies using similar methodologies. Statistical analyses were performed using the appropriate test indicated in the figure legends. To determine the appropriate sample size for the Fndc5-KO EAE exercise experiment, we performed a power analysis (GPower 3.1.9.7. software)49 on the basis of the effect size and variance measured in the WT experiments. Using the standard α error of 0.05 and a power of 0.80, the required sample size is seven animals to detect a significant difference between running and sedentary animals. For most analyses, animals were considered the biological replicates. For single-cell electron microscopy imaging analyses of synapses, mitochondria or confocal imaging analysis of irisin binding on individual cells, we considered the individual cells as the biological replicate, as it is well documented that phenotypic heterogeneity exists between cell populations in the same tissue owing to variance in the local microenvironment (reviewed in Mattiazzi Usaj et al.)50. Figures show biological replicates. Outlier identification was first performed via ROUT (Q = 0.2%). The Shapiro–Wilk test was used to analyse normality. In normally distributed data, differences between two experimental groups were determined using an unpaired, two-tailed Student’s t-test with Bonferroni correction where applicable; in non-normally distributed data, differences between two experimental groups were determined using an unpaired, two-tailed Mann–Whitney test. Statistical analysis of the clinical scores in the EAE experiments was performed by applying a Mann–Whitney U test to the recovery score (maximum score − final score) for each animal. Only mice that had a minimum EAE score of 1 were included in these analyses. Missing values in the statistical analysis of EAE clinical scores (chronic EAE cohorts) were handled by conservative mean imputation. Specifically, for each missing daily score, we replaced the value with the mean clinical score of the corresponding experimental group on that same day. This approach ensured that the imputed values did not bias the analyses towards higher or lower disease severity. In total, three animals required imputation: one in the Fndc5-KO cohort, one in the WT voluntary wheel-running cohort, and one in the AAV8–irisin cohort. For the AAV8–irisin cohort, only AAV8–irisin–Flag mice with a minimum increase of 5% irisin expression compared with AAV8–GFP control animals were included. For the WT running and AAV8–irisin EAE, data were pooled from two separate experiments. qRT–PCR mRNA expression levels of irisin in the liver and irisin plasma levels are only shown for animals analysed for EAE. Data for the MFI analysis of irisin in NeuN+ ROI and GFAP+ ROI were pooled from two separate experiments, and data were normalized to the respective healthy control. Significant results are indicated with an asterisk: *P < 0.05, **P < 0.01, ***P < 0.001, ****P < 0.0001. For CFC, exclusion criteria were pre-established following published guidance51. Mice that did not freeze after receiving the shocks on day 1 were excluded from that analysis, as we cannot use freezing as a proxy for learning or memory. One-way analysis of variance (ANOVA) with uncorrected Fisher’s least significant difference (LSD) was used for analysis. For all experiments, all stated replicates are biological replicates. Two-way ANOVA with Šídák’s multiple comparisons test or repeated-measures-two-way ANOVA with Tukey’s post hoc test were used. Operators were blinded to the true experimental groups during data collection and image analysis by de-identifying all samples with generic unique IDs.
Reporting summary
Further information on research design is available in the Nature Portfolio Reporting Summary linked to this article.