

Canadian inflation is expected to tick higher on a monthly basis in July.The headline Consumer Price Index is seen declining to 1.7% YoY.The Canadian Dollar remains mired within a consolidation range.
Statistics Canada will issue the Consumer Price Index (CPI) for July on Tuesday. This will attract the market’s attention since it will provide the Bank of Canada (BoC) with fresh information on how inflation is changing, which they use to set interest rates.
Economists anticipate that the headline inflation rate will fall to 1.7% in July, below June’s 1.9%. On a monthly basis, the inflation is seen gaining 0.4%.
The BoC will also release its core inflation measure, which excludes food and energy costs. In June, this primary indicator was 2.7% higher than in the same month the previous year and up 0.1% from a month earlier.
Even while there are indications that pricing pressure is reducing, analysts are still quite worried about the possibility of US tariffs causing domestic inflation to rise. Both markets and policymakers are anticipated to be circumspect in the coming weeks since the inflation forecast is now less clear.
What can we expect from Canada’s inflation rate?
The Bank of Canada left its benchmark rate unchanged at 2.75% on July 30, a move that broadly matched market expectations.
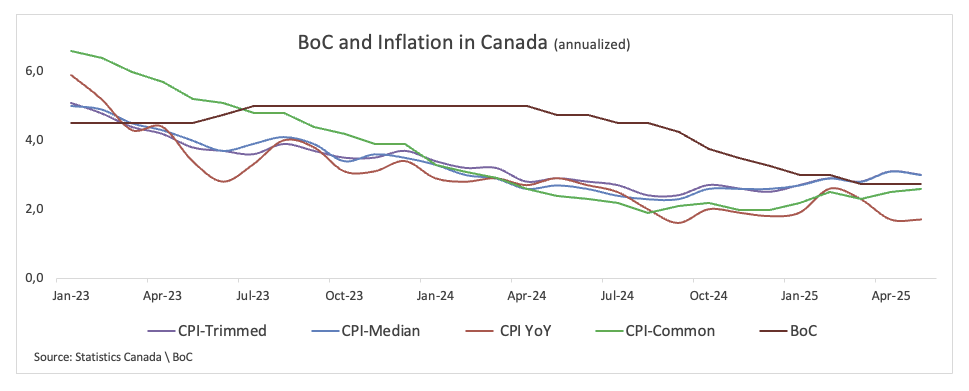
In his press conference, Governor Tiff Macklem said the bank’s decision to hold rates steady was influenced by fresh signs of stickiness in underlying inflation. He pointed out that the BoC’s preferred core measures — the trim mean and trim median — have been hovering around 3%, while a broader set of indicators has also edged higher. That shift, he acknowledged, has caught policymakers’ attention and will be watched closely in the months ahead.
At the same time, Macklem sought to reassure that not all of the recent strength in inflation is likely to persist. He argued that several forces should help ease price pressure: the Canadian Dollar (CAD) has regained ground after a bout of weakness, wage growth has slowed, and the economy remains in excess supply, with output thought to have contracted in the second quarter. In his view, these dynamics should combine to put downward pressure on inflation as the year progresses.
Markets will react to the headline number, but policymakers will be looking under the hood at the trim, median and common measures. According to the latest releases, the trim and median gauges have picked up pace, raising concerns among policymakers. The common gauge, however, has been more subdued.
 When is the Canada CPI data due, and how could it affect USD/CAD?
Statistics Canada will release its July inflation data on Tuesday at 12:30 GMT, and markets are bracing for signs that price pressure could re-emerge.
A stronger-than-expected print would support the view that tariff-related costs are beginning to feed into consumer prices. That could push the BoC to tread more cautiously, lending short-term support to the Canadian Dollar (CAD) while also keeping a close eye on developments on the trade front.
FXStreet’s senior analyst, Pablo Piovano, notes that the CAD has settled into a range-bound pattern so far in August, with USD/CAD holding close to the 1.3800 area. He argues that renewed selling pressure could initially drive the pair back toward its provisional 55-day Simple Moving Average (SMA) at 1.3699, ahead of the monthly floor at 1.3721 (August 7). South from here emerge minor support levels at 1.3575 (weekly trough on July 23) and then the July valley at 1.3556 (July 3), all preceding the 2025 bottom of 1.3538 set on June 16.
On the topside, Piovano sees resistance at the August ceiling at 1.3879 (August 1), prior to the May peak at 1.4015 (May 13), which is bolstered by the critical 200-day SMA at 1.4031.
From a broader view, he suggests that the bearish bias will persist as long as spot trades below its 200-day SMA.
He also argues that momentum signals remain inconclusive: the Relative Strength Index (RSI) has retreated to nearly the 56 mark, suggesting some loss of upside impulse as of late, while the Average Directional Index (ADX) near 20 is indicative that the prevailing trend is slowly gaining steam.
US-China Trade War FAQs
Generally speaking, a trade war is an economic conflict between two or more countries due to extreme protectionism on one end. It implies the creation of trade barriers, such as tariffs, which result in counter-barriers, escalating import costs, and hence the cost of living.
An economic conflict between the United States (US) and China began early in 2018, when President Donald Trump set trade barriers on China, claiming unfair commercial practices and intellectual property theft from the Asian giant. China took retaliatory action, imposing tariffs on multiple US goods, such as automobiles and soybeans. Tensions escalated until the two countries signed the US-China Phase One trade deal in January 2020. The agreement required structural reforms and other changes to China’s economic and trade regime and pretended to restore stability and trust between the two nations. However, the Coronavirus pandemic took the focus out of the conflict. Yet, it is worth mentioning that President Joe Biden, who took office after Trump, kept tariffs in place and even added some additional levies.
The return of Donald Trump to the White House as the 47th US President has sparked a fresh wave of tensions between the two countries. During the 2024 election campaign, Trump pledged to impose 60% tariffs on China once he returned to office, which he did on January 20, 2025. With Trump back, the US-China trade war is meant to resume where it was left, with tit-for-tat policies affecting the global economic landscape amid disruptions in global supply chains, resulting in a reduction in spending, particularly investment, and directly feeding into the Consumer Price Index inflation.
Economic Indicator
BoC Consumer Price Index Core (MoM)
The BoC Consumer Price Index Core, released by the Bank of Canada (BoC) on a monthly basis, represents changes in prices for Canadian consumers by comparing the cost of a fixed basket of goods and services. It is considered a measure of underlying inflation as it excludes eight of the most-volatile components: fruits, vegetables, gasoline, fuel oil, natural gas, mortgage interest, intercity transportation and tobacco products. The MoM figure compares the prices of goods in the reference month to the previous month. Generally, a high reading is seen as bullish for the Canadian Dollar (CAD), while a low reading is seen as bearish.
Read more.
Last release:
Tue Jul 15, 2025 12:30
Frequency:
Monthly
Actual:
0.1%
Consensus:
–
Previous:
0.6%
Source:
Statistics Canada