
Noaa.gov
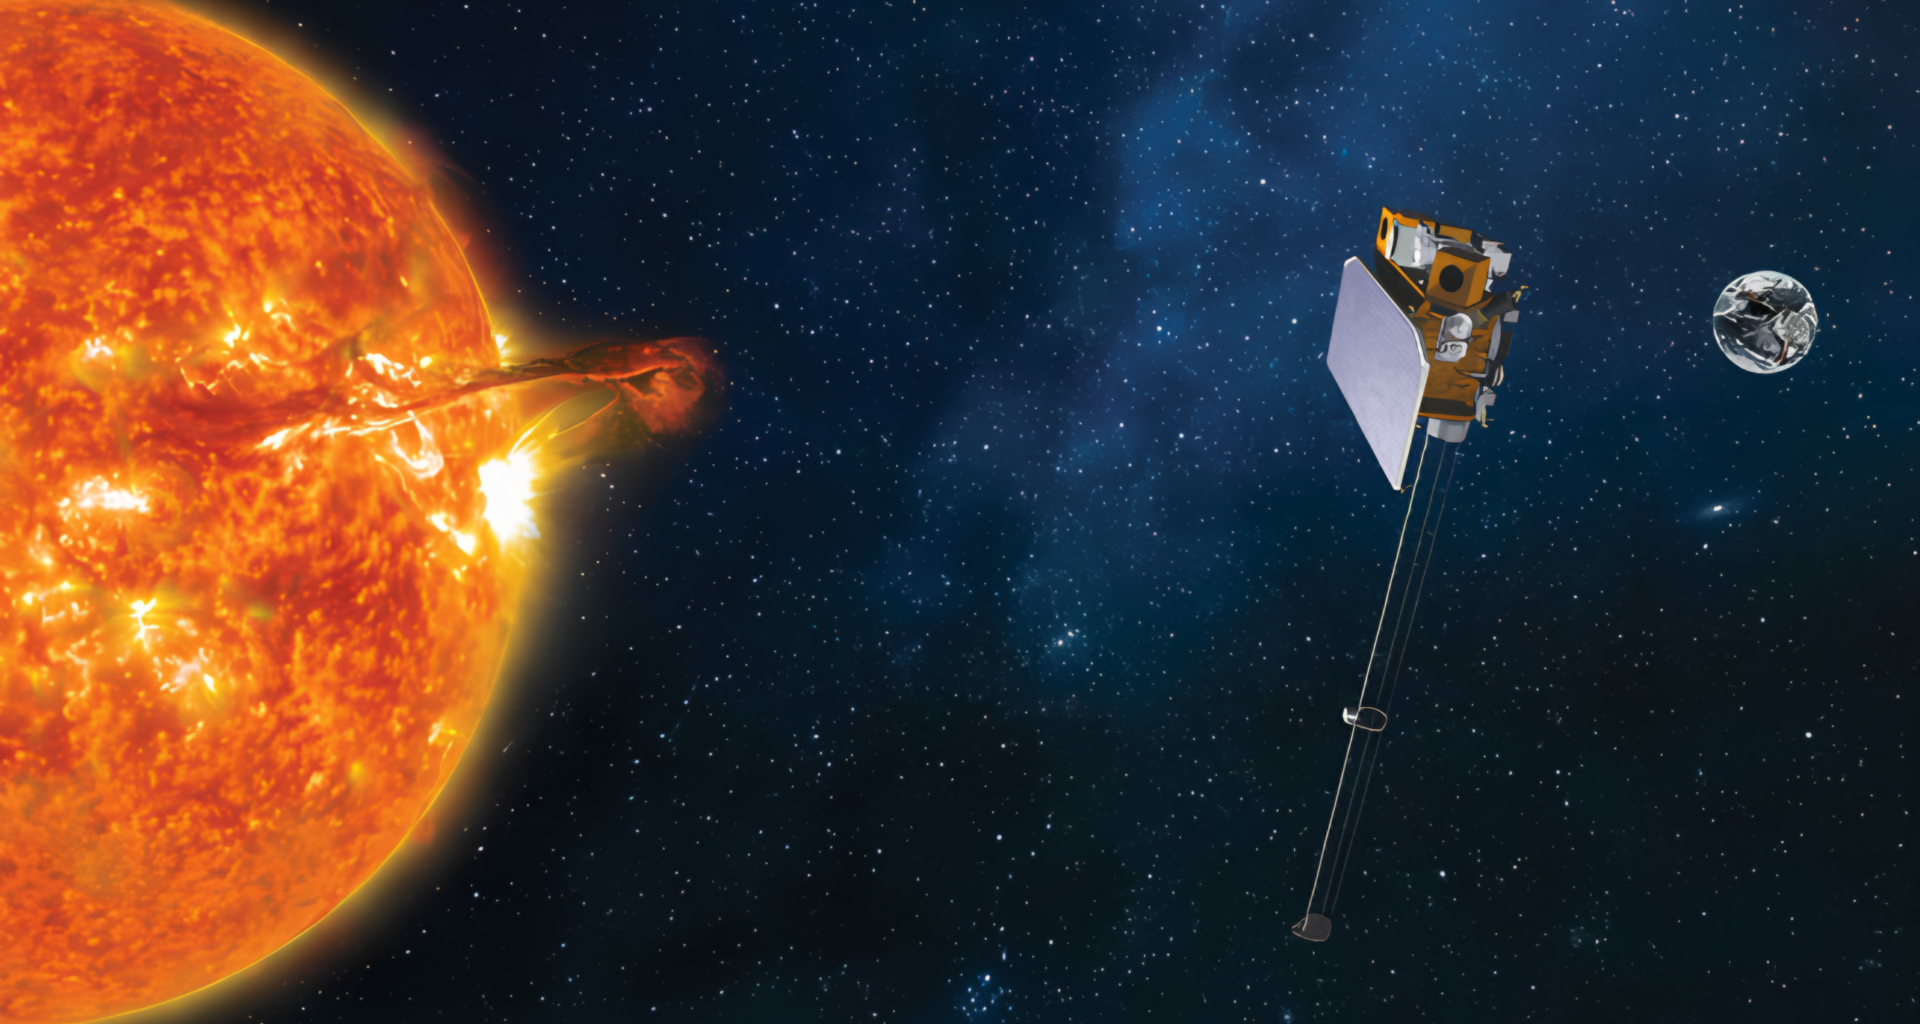
Earth’s magnetic field absorbed a G2 (Moderate) geomagnetic storm on Sunday as a coronal mass ejection from Active Region 4492 arrived nearly on schedule — with NOAA’s Space Weather Prediction Center confirming a three-hour planetary Kp index of 5.67, squarely within the G1-G2 forecast issued more than 48 hours earlier by the NOAA SWPC WATA30 watch. The storm is the first this summer where a CME from a relatively modest solar flare delivered what its radio signature suite promised — validating a forecasting pipeline that failed spectacularly on July 4, when a G3 storm arrived two levels above prediction.
What made this forecast work was not the M1.9 X-ray classification, which sits near the lower end of moderate solar flares. It was the constellation of radio signals that erupted from the Sun’s northwest quadrant on July 30 — signals that told forecasters the eruption was more energetic, and the plasma cloud more substantial, than the flare class alone would imply.
What the Radio Signals Told Forecasters Before Any Plasma Left the Sun
At 17:00 UTC on July 30, Active Region 4492 (classified N15W82, Hax/alpha configuration) produced a long-duration M1.9 flare coinciding with an approximately 8-degree-long filament eruption centered near N20W67. Long-duration flares are categorically different from brief impulsive events: their extended energy release phase is statistically associated with faster, wider CMEs because the underlying magnetic reconnection continues operating over a longer interval, expelling a larger volume of plasma.
But the flare class and duration were only the opening signal. Within minutes, NOAA’s solar radio monitoring network recorded a radio signature suite that forecasters use as a more direct proxy for CME velocity and energy than any X-ray measurement can provide.
The first signal was a pair of Type II radio sweeps — the diagnostic signature of a shock wave propagating through the solar corona faster than the local Alfvén speed. Type II bursts appear as slowly drifting emission lanes in radio dynamic spectra, shifting from high to low frequencies as the shock moves outward through plasma of decreasing density, a pattern documented in comprehensive statistical studies of Type II radio bursts and space weather phenomena. The drift rate translates directly to a velocity estimate: the first sweep at 16:27 UTC returned an estimated shock speed of 853 km/s (530 mph); the second, recorded at 16:45 UTC, returned 1,681 km/s (1,044 mph). That nearly 2-to-1 difference between the two velocity estimates is not a contradiction — it reflects emissions from different regions of the shock structure, most likely the faster CME nose versus a slower flank, or separate CME components from the simultaneous flare and filament eruption.
A Type IV radio burst at 16:31 UTC confirmed what the Type II sweeps suggested: a significant CME had been produced. Type IV emissions come from electrons trapped in post-flare loops or in the body of the CME itself, and their presence is a reliable indicator that the eruption was eruptive rather than confined.
The last piece of the radio suite was a Tenflare — a 10-centimeter microwave burst peaking at 190 solar flux units (sfu) at 16:43 UTC and lasting 17 minutes. A solar flux unit equals 10⁻²² watts per square meter per hertz; the background 10.7 cm flux that serves as NOAA’s daily solar activity proxy typically runs between 100 and 250 sfu across the solar cycle. A transient burst of 190 sfu on top of the background — sustained for 17 minutes — indicates substantial electron heating in the chromosphere and low corona, consistent with a flare coupling its energy effectively into the erupting plasma.
Together, the dual Type II sweeps, the Type IV confirmation, and the 17-minute Tenflare constituted a radio signature suite telling forecasters: this eruption produced a fast CME with significant energy content, even though the M1.9 X-ray classification places it well below what headlines normally flag.
Radiation Storm Precedes the Plasma
Energetic protons, accelerated to near-relativistic speeds by the flare and filament shock, arrived at Earth ahead of the much slower CME plasma. At 18:45 UTC on July 30, the greater-than-10 MeV proton flux crossed the S1 (Minor) solar radiation storm threshold, peaking at 18 particle flux units (pfu) — nearly double the 10 pfu minimum for S1 designation — at 20:55 UTC before dropping below the threshold at 00:30 UTC on July 31. The flux crossed back above the threshold on July 31, prompting NOAA to retain a chance of renewed S1 conditions through August 1.
The radiation storm’s arrival served a dual purpose. In operational terms, it elevated risk for passengers and crew on polar airline routes and for satellites in orbit, as energetic protons can degrade electronics and increase cumulative radiation dose for astronauts. In scientific terms, the proton flux arrival timing provided an independent confirmation of the CME’s velocity estimates from the Type II sweeps — because the protons travel at near-light speed, their arrival time constrains the acceleration region geometry in the solar corona, consistent with a fast, shock-driven event at the velocities the radio data measured.
How WSA-Enlil Translated the Signals into a Storm Window
Once the CME was confirmed in coronagraph imagery — appearing as a partial-halo signature in GOES CCOR2 beginning at 17:15 UTC and as a full-halo signature in STEREO COR2 beginning at 16:53 UTC — NOAA’s Space Weather Prediction Center ran the WSA-Enlil model.
WSA-Enlil is a two-component physics-based system. The Wang-Sheeley-Arge (WSA) component is a semi-empirical model driven by photospheric magnetic field maps from the Global Oscillations Network Group (GONG) — a chain of ground-based solar telescopes that produce continuous synoptic maps of the Sun’s surface magnetic field. WSA uses these maps to approximate solar wind conditions at the base of the corona, roughly 21.5 solar radii from the Sun’s center. The ENLIL component is a three-dimensional magnetohydrodynamic numerical solver that propagates the resulting solar wind and any injected CME through the inner heliosphere from that inner boundary to 1 AU and beyond.
A CME enters ENLIL as a simplified “cone model” — a spherical shape defined by its coronagraph-measured speed, angular width, and direction. For the AR4492 event, the velocity inputs derived from the Type II sweeps (placing the CME shock at the faster end of the moderate-event distribution) informed the cone model parameters. The model output placed CME arrival at Earth early on August 2, with G1-G2 (Minor-Moderate) geomagnetic storm conditions anticipated.
NOAA issued a formal G2 watch — Watch WATA30 — at 11:05 UTC on July 31, providing grid operators, satellite controllers, and aviation authorities more than 40 hours of advance warning before the CME arrived.
The model’s limitation remains what it has always been: WSA-Enlil cannot predict the Bz component of the arriving CME’s magnetic field — the north-south orientation that ultimately determines how much energy the storm transfers into Earth’s magnetosphere. On July 4, a G3 storm exceeded a G1 forecast primarily because the arriving Bz turned unexpectedly southward. For the August 2 event, the Bz orientation also played a role in reaching G2 from what forecasters estimated as a G1-G2 range — but the model’s arrival timing and intensity bracket proved accurate.
G2 Conditions: What They Mean for Infrastructure and Viewers
The G2 designation sits in the middle of NOAA’s five-point geomagnetic scale. Its practical consequences span several sectors that most people depend on without knowing it.
At G2 intensity, high-latitude power systems can experience voltage alarms as geomagnetically induced currents (GICs) — quasi-DC currents produced by rapid changes in Earth’s magnetic field — flow through long transmission lines. Transformer cores designed for alternating current can be partially saturated by these DC-like signals, generating heat and harmonic distortion. Spacecraft in low Earth orbit experience increased atmospheric drag as the upper atmosphere expands under solar heating; satellite operators need to perform corrective burns or accept faster orbital decay. High-frequency radio propagation fades at higher latitudes, with consequences for polar-route aviation dispatchers who rely on HF as a primary communication channel when satellites are unavailable.
The February 2022 loss of 40 out of 49 Starlink satellites during a geomagnetic storm remains the most-cited illustration of how elevated atmospheric drag at even moderate geomagnetic levels can produce significant infrastructure losses — a precedent that satellite operators active during this August 2 event had already incorporated into contingency planning.
For skywatchers, the G2 storm pushed the auroral oval into mid-latitudes, with aurora forecast as far south as New York and Idaho under favorable dark-sky conditions. A full moon complicated naked-eye viewing — the bright lunar disk competes with faint auroral displays at the lower edge of the viewing zone — but cameras with multi-second exposures regularly detect aurora that the human eye cannot distinguish from a moonlit sky. Disturbances are expected to continue into August 3.
Why This Forecast Worked When July 4’s Did Not
The July 4, 2026 G3 storm — driven by an X1.1 flare from AR4479 — arrived two full levels above NOAA’s G1 forecast. The miss traced to the Bz measurement gap: neither WSA-Enlil nor any instrument positioned closer to the Sun than the L1 Lagrange point can read the CME’s magnetic field orientation before it arrives. When the July 4 CME’s Bz turned strongly southward at L1, forecasters had 15 to 60 minutes of warning — too late to revise the forecast issued hours earlier.
The August 2 event illustrates a different scenario: a case where the radio signature suite provided enough velocity and energy information to bracket the forecast correctly, and where the arriving CME’s Bz — while not predictable in advance — landed within the G2 band that the model estimated. The contrast matters for how readers should interpret space weather forecasts going forward. When the radio signatures and coronagraph imagery produce a clear, consistent picture — two Type II sweeps both showing velocities well above average, a Type IV confirming an eruptive event, a Tenflare signaling substantial energetic-particle coupling — the WSA-Enlil output deserves significant confidence. When the eruption is impulsive, the radio signatures are ambiguous, or multiple CMEs are interacting in transit, the Bz gap becomes dominant and the forecast uncertainty widens.
Solar Cycle 25 and the Declining-Phase Paradox
The August 2 G2 storm occurred during Solar Cycle 25’s declining phase. NASA and NOAA announced in October 2024 that the Sun had reached solar maximum, with the smoothed sunspot number peaking at approximately 161 in October 2024 — well above the 115 predicted by the international panel in 2019. Solar activity has trended downward since, but the descent is gradual and irregular.
Historically, the most intense individual events of a solar cycle frequently occur during the declining phase rather than at the maximum. Solar Cycle 23, which peaked in 2001, produced ten flares exceeding the X10.0 classification — with four occurring years after the cycle’s official maximum. The AR4492 event is consistent with this pattern: a region in the northwest quadrant near the Sun’s western limb, just before it rotated out of Earth-facing view, producing a long-duration eruption that delivered a textbook G1-G2 storm to forecasters who read its radio signatures correctly.
Space weather researchers characterize the period from early 2026 through mid-2027 as a window of sustained elevated risk for satellite infrastructure and high-latitude power grids, not a return to the quiet conditions of 2019 and 2020. The declining phase is quieter on average — but quieter is not the same as safe.
How to Monitor the Storm Through Tonight
For those hoping to see the aurora before disturbances ease, the primary real-time resource is NOAA’s Space Weather Prediction Center website, which publishes the planetary Kp index updated every three minutes. A Kp reading of 5 or above indicates G1 (Minor) conditions; Kp 6 or above signals G2 (Moderate). The optimal viewing window is the hours around local magnetic midnight — typically 11 p.m. to 2 a.m. local time — with dark skies and a northward horizon. Cameras with exposures of three to five seconds will detect auroral activity well before the naked eye can confirm it.
NOAA’s SOLAR-1 satellite at the Sun-Earth L1 Lagrange point — approximately 1.5 million km (930,000 miles) sunward of Earth — provides the real-time solar wind measurements that determine how conditions evolve through the night. The critical variable remains the Bz component of the interplanetary magnetic field: a sustained southward Bz sustains the storm; a northward shift allows it to ease. That reading is available in real time on NOAA’s Space Weather Prediction Center dashboard and on aggregator sites including SpaceWeatherLive.com.
Frequently Asked QuestionsWhat is a Type II solar radio burst, and why does it matter for storm forecasting?
A Type II radio burst is produced when a CME-driven shock wave moves through the solar corona faster than the local Alfvén speed — the speed at which magnetic disturbances propagate through magnetized plasma. The shock accelerates electrons, which generate radio waves at the local plasma frequency. Because plasma density decreases with distance from the Sun, those radio waves drift from high to low frequencies over time, producing the characteristic slowly drifting emission lane visible in radio dynamic spectra. The drift rate corresponds to the shock’s velocity through the corona. In the AR4492 event, two Type II sweeps returned velocities of 853 km/s (530 mph) and 1,681 km/s (1,044 mph) — providing NOAA with independent velocity estimates before a single atom of CME plasma had traveled more than a fraction of the distance to Earth.
Why did NOAA forecast G1-G2 for this storm but G1 for the July 4 storm that hit G3?
Both forecasts used WSA-Enlil, the same physics-based model. The difference lies in the quality of the radio signal input. The AR4492 event on July 30 produced a rich radio signature suite — two Type II sweeps at clearly elevated velocities, a Type IV burst confirming an eruptive CME, and a substantial Tenflare — giving the model velocity and energy inputs that pointed toward a more powerful-than-average CME for a moderate-class flare. The July 4 event’s X1.1 flare was nominally stronger by X-ray classification but arrived as part of a complex multi-CME environment where the interacting plasma clouds made internal field orientation harder to predict. When the July 4 CME arrived with strongly southward Bz — a parameter the model cannot forecast — the storm escalated well beyond what the model estimated. The August 2 event’s Bz also contributed to reaching G2, but the model’s G1-G2 intensity bracket proved accurate.
What does a G2 geomagnetic storm actually do to infrastructure?
At G2 (Moderate) intensity, high-latitude power systems can experience voltage alarms and, during prolonged events, transformer stress from geomagnetically induced currents in long transmission lines. Satellites in low Earth orbit experience increased atmospheric drag — the same mechanism responsible for SpaceX losing 40 of 49 Starlink satellites in a February 2022 storm — requiring operators to perform corrective burns. High-frequency radio propagation fades at higher latitudes, affecting polar aviation communications. GPS receivers experience marginally reduced accuracy. The effects are manageable with warning time — which the NOAA SWPC watch provided more than 40 hours before arrival — but they are real and require active response from infrastructure operators, not just skywatchers.
Can I still see the aurora tonight, and where?
Disturbances are expected to continue through August 3, so there may still be an opportunity. Aurora viewing at G2 levels is typically possible for observers at geomagnetic latitudes of roughly 50 degrees and higher, which in North America includes Seattle, Minneapolis, Toronto, and points farther north. A full moon is complicating naked-eye viewing at the southern edge of this zone, but cameras on three-to-five-second exposures often detect auroral colors the eye misses. Monitor NOAA’s real-time Kp index for readings of 5 or above, face north from a dark-sky location, and allow at least 20 minutes for your eyes to adjust. The hours around local magnetic midnight — roughly 11 p.m. to 2 a.m. local time — offer the best geometry.