

Overview
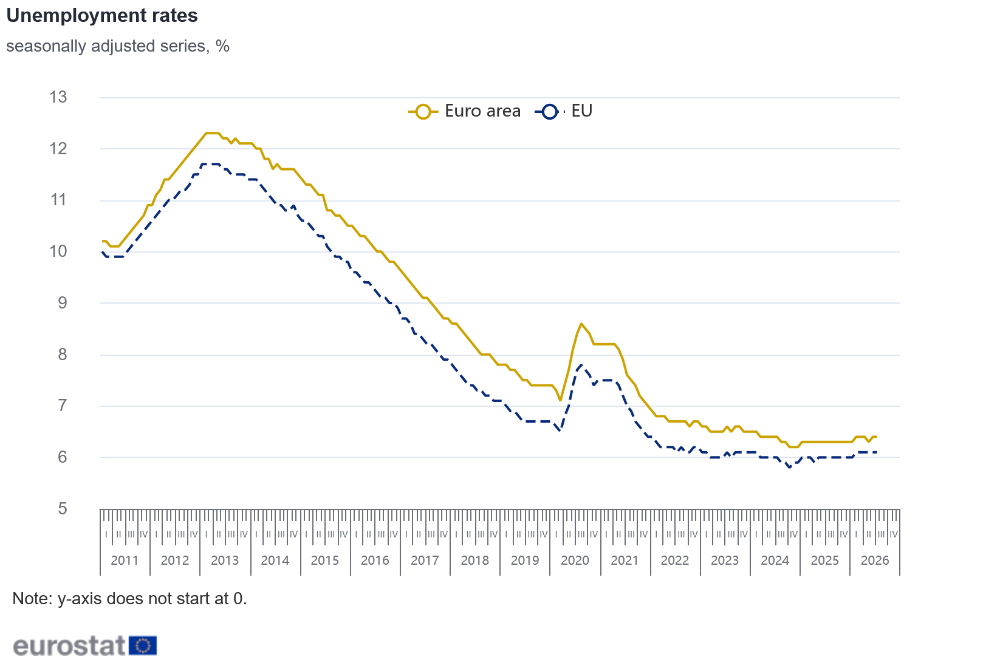
In July 2026, the euro area seasonally adjusted unemployment rate was 6.4%, stable compared with June 2026 and up from 6.3% in July 2025. The EU unemployment rate was 6.1% in July 2026, also stable compared with June 2026 and up from 6.0% in July 2025. These figures are published by Eurostat, the statistical office of the European Union.
Eurostat estimates that 13.516 million persons in the EU, of whom 11.264 million in the euro area, were unemployed in July 2026.
Compared with June 2026, unemployment decreased by 41 thousand in the EU, while it remained unchanged in the euro area.
Compared with July 2025, unemployment increased by 296 thousand in the EU and by 175 thousand in the euro area.
Youth unemployment
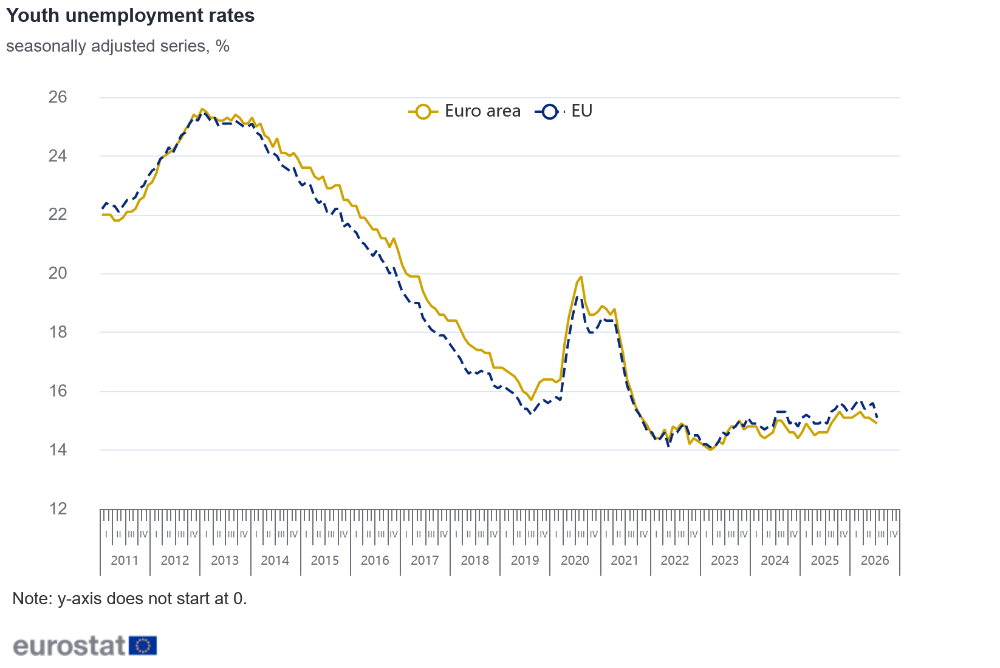
In July 2026, 2.930 million young persons (under 25) were unemployed in the EU, of whom 2.371 million were in the euro area. In July 2026, the youth unemployment rate was 15.1% in the EU, down from 15.6% in the previous month, and 14.9% in the euro area, also down from 15.0% in June 2026.
Compared with June 2026, youth unemployment decreased by 98 thousand in the EU and by 26 thousand in the euro area.
Compared with July 2025, youth unemployment increased by 29 thousand in the EU and by 40 thousand in the euro area.
Unemployment by sex
In July 2026, the unemployment rate for women was 6.3% in the EU and the unemployment rate for men was 5.9%, both stable compared with the previous month. In the euro area, the unemployment rate for women was 6.6% and the unemployment rate for men was 6.2%, both also stable compared with June 2026.
Additional labour market indicators
The estimates in this News Release are based on the globally used International Labour Organisation (ILO) standard definition of unemployment, which counts as unemployed people without a job who have been actively seeking work in the last four weeks and are available to start work within the next two weeks.
To capture in full the labour market situation, the data on unemployment have been complemented by additional indicators, e.g. underemployed part-time workers, persons seeking work but not immediately available and persons available to work but not seeking, released together with EU Labour Force Survey (EU-LFS) data for the first quarter of 2026.
EU-LFS data for the second quarter of 2026 will be released on 11 September 2026.
Tables
Seasonally adjusted unemployment, totals
Rates (%)
Number of persons (in thousands)
Jul-25
Apr-26
May-26
Jun-26
Jul-26
Jul-25
Apr-26
May-26
Jun-26
Jul-26
6.3
6.4
6.3
6.4
6.4
11 089
11 245
11 199
11 264
11 264
6.0
6.1
6.1
6.1
6.1
13 220
13 504
13 467
13 557
13 516
6.1
6.3
6.3
6.3
6.0
333
344
349
344
329
3.8
3.2
3.4
3.5
3.6
114
98
102
106
107
2.8
3.1
2.9
3.2
3.3
152
168
159
176
180
6.5
7.0
7.0
6.6
6.7
214
234
232
223
224
3.8
3.9
3.9
4.0
4.0
1 656
1 706
1 716
1 729
1 740
8.0
6.3
6.5
6.9
6.9
61
47
48
51
51
5.0
4.9
4.9
5.0
5.1
147
145
146
147
150
8.9
9.0
7.8
8.1
7.9
422
430
371
384
377
10.6
10.2
10.2
10.1
10.0
2 627
2 570
2 570
2 553
2 553
7.7
8.3
8.4
8.3
8.3
2 460
2 673
2 687
2 657
2 647
4.8
4.4
4.4
4.4
4.3
86
79
79
78
78
5.9
5.5
5.4
5.8
5.8
1 504
1 418
1 399
1 507
1 490
4.3
3.8
3.7
3.8
3.9
23
20
20
20
21
7.1
6.8
6.9
7.1
7.3
68
65
66
68
70
6.8
6.4
6.4
6.2
6.2
107
101
100
97
97
6.4
7.1
7.0
7.1
7.1
23
25
25
25
25
4.3
4.6
4.4
4.5
4.5
212
223
212
217
221
2.5
3.6
3.6
3.5
3.5
8
12
12
12
12
3.8
3.9
3.9
3.8
4.0
388
397
399
393
404
5.6
5.9
6.0
5.8
6.2
265
281
285
278
296
3.1
3.3
3.4
3.4
3.4
556
587
605
608
598
5.8
5.7
5.6
5.7
5.7
324
323
316
323
320
5.9
6.8
6.7
6.8
6.4
485
560
550
555
527
3.8
4.1
4.0
3.8
3.5
39
43
42
39
36
5.5
5.8
5.7
5.7
5.7
151
159
158
158
158
9.9
10.5
10.5
10.5
10.5
283
303
302
301
302
8.8
8.7
8.7
8.7
8.7
507
504
503
503
503
4.3
5.6
5.6
5.7
5.8
10
13
13
13
13
4.6
4.6
4.6
4.5
4.5
141
142
140
139
138
4.9
5.1
5.1
5.1
:
252
263
266
264
:
4.3
4.3
4.3
4.2
4.1
7 234
7 365
7 300
7 088
6 904
Seasonally adjusted youth (under 25s) unemployment
Rates (%)
Number of persons (in thousands)
Jul-25
Apr-26
May-26
Jun-26
Jul-26
Jul-25
Apr-26
May-26
Jun-26
Jul-26
14.6
15.1
15.1
15.0
14.9
2 331
2 405
2 409
2 397
2 371
14.9
15.4
15.5
15.6
15.1
2 901
2 982
3 009
3 028
2 930
18.5
18.9
18.9
18.9
:
88
93
93
93
:
15.5
12.3
12.8
13.6
14.1
18
16
16
17
18
10.1
9.8
8.6
13.0
12.2
33
31
28
44
40
12.2
12.5
14.8
15.8
10.8
62
62
78
82
57
6.9
7.4
7.3
7.3
7.2
315
326
324
322
320
25.7
21.0
22.2
25.9
26.1
18
13
14
17
17
12.6
11.5
11.6
11.8
12.3
46
41
42
43
44
20.4
18.2
17.0
21.1
16.8
54
45
43
57
45
24.9
24.0
24.0
23.4
22.9
461
460
465
455
452
18.9
21.7
21.6
21.2
20.7
644
747
742
721
701
18.4
16.4
16.4
16.4
:
21
19
19
19
:
19.3
17.6
17.2
18.7
18.9
253
223
214
236
233
13.0
11.9
11.9
11.9
:
4
3
3
3
:
13.0
12.6
13.6
14.2
15.4
9
9
10
10
11
13.4
12.8
12.4
11.5
12.1
14
12
12
11
11
19.1
19.8
19.4
20.0
20.1
5
5
5
5
5
13.7
12.8
12.8
13.5
15.2
41
36
36
40
45
7.5
9.2
9.0
9.5
9.8
2
3
3
3
3
8.4
8.7
8.7
8.5
8.6
151
157
157
152
154
9.9
9.9
8.6
10.6
12.2
50
52
45
55
65
12.4
12.0
11.8
11.5
11.2
140
136
135
130
126
19.5
17.9
19.8
19.9
20.1
76
67
74
75
76
25.9
30.8
30.8
30.8
:
127
147
147
147
:
13.3
14.2
14.2
14.2
:
10
12
12
12
:
15.7
18.6
18.8
18.5
18.0
21
24
24
24
23
22.5
23.0
23.3
23.4
23.4
73
76
76
76
76
24.0
24.3
24.3
24.4
24.4
167
173
174
174
174
9.4
11.7
11.6
11.4
11.2
4
4
4
4
4
14.1
11.3
14.4
14.0
12.1
63
51
65
64
55
8.4
9.0
9.5
9.0
:
50
53
57
54
:
Seasonally adjusted unemployment rates (%), by sex
Males
Females
Jul-25
Apr-26
May-26
Jun-26
Jul-26
Jul-25
Apr-26
May-26
Jun-26
Jul-26
6.1
6.2
6.1
6.2
6.2
6.5
6.6
6.6
6.6
6.6
5.8
5.9
5.9
5.9
5.9
6.2
6.3
6.3
6.3
6.3
6.6
6.7
6.9
6.9
6.6
5.5
5.8
5.7
5.6
5.4
3.9
3.7
3.9
4.1
4.1
3.6
2.8
2.8
2.9
3.0
2.6
2.7
2.5
2.8
2.7
3.1
3.6
3.5
3.7
4.1
7.0
7.1
6.1
6.9
5.8
6.1
6.9
7.9
6.4
7.7
4.1
4.2
4.2
4.2
4.3
3.4
3.6
3.6
3.6
3.7
8.8
6.1
6.5
6.6
6.6
7.2
6.5
6.6
7.2
7.2
5.0
4.7
4.7
4.8
4.9
5.0
5.2
5.2
5.2
5.3
7.1
6.1
5.3
6.3
5.9
11.0
12.6
10.9
10.2
10.4
9.2
9.0
9.1
9.0
8.9
12.1
11.5
11.4
11.3
11.2
7.8
8.6
8.6
8.4
8.4
7.7
8.1
8.2
8.2
8.2
5.4
4.8
4.8
4.9
4.9
4.2
3.9
3.9
3.8
3.7
5.4
5.1
5.1
5.4
5.2
6.5
6.1
6.0
6.4
6.6
4.1
3.7
3.6
3.6
3.7
4.7
3.9
3.9
4.0
4.2
7.9
7.5
7.9
8.1
8.2
6.3
6.1
6.0
6.2
6.5
7.8
7.1
7.0
6.7
6.7
5.9
5.7
5.7
5.7
5.8
6.2
6.8
6.8
6.9
6.9
6.7
7.3
7.2
7.4
7.3
4.4
4.4
4.3
4.3
4.4
4.2
4.8
4.4
4.7
4.7
2.9
3.7
3.7
3.6
3.5
1.9
3.4
3.4
3.4
3.4
3.7
3.8
3.8
3.8
4.0
3.9
4.0
4.0
4.0
3.9
5.7
6.4
6.3
6.4
6.7
5.5
5.3
5.6
5.2
5.7
2.8
3.2
3.4
3.4
3.3
3.5
3.4
3.4
3.5
3.4
5.3
5.4
5.0
5.0
4.9
6.3
6.0
6.1
6.4
6.4
6.1
6.4
6.6
6.6
6.2
5.6
7.4
7.0
7.1
6.7
3.6
3.8
3.7
3.4
3.2
4.0
4.4
4.4
4.2
3.9
5.2
5.5
5.5
5.5
5.6
5.8
6.1
6.1
6.0
6.0
10.6
11.0
11.0
10.9
10.8
9.1
10.0
10.0
10.1
10.1
8.8
8.8
8.7
8.7
8.7
8.7
8.6
8.6
8.6
8.7
4.4
5.3
5.2
5.1
5.1
4.2
5.9
6.0
6.5
6.7
4.8
4.9
4.8
4.9
4.5
4.2
4.2
4.1
4.3
3.9
5.0
5.2
5.2
5.2
:
4.8
5.0
5.1
5.0
:
Notes for users
Revisions and timetable
The data in this News Release can be subject to revisions, caused by updates to the seasonally adjusted series whenever new monthly data are added; the inclusion of the most recent EU-LFS data in the calculation process; update of seasonal adjustment models with complete annual data.
Compared with the rates published in the News Release of 30 July 2026, the June 2026 unemployment rate for the EU has been revised from 6.0% to 6.1% and the unemployment rate for the euro area has been revised from 6.3% to 6.4%. Among EU Member States, the rate has been revised by more than 0.1 percentage points (pp) downwards for Lithuania (by 0.7 pp). The rate has been revised by more than 0.1 percentage points (pp) upwards for Cyprus (by 0.8 pp), Bulgaria and Romania (by 0.5 pp each) as well as for Estonia, Latvia and Poland (by 0.3 pp each).
Country notes
Germany, the Netherlands, Finland, Sweden as well as Iceland and Norway: the trend component is used instead of the more volatile seasonally adjusted data.
Estonia and Portugal: 3-month moving averages of EU-LFS data are used instead of pure monthly indicators.
Methods and definitions
Eurostat publishes harmonised unemployment rates for individual EU Member States, the euro area and the EU. These unemployment rates are based on the definition recommended by the International Labour Organisation (ILO). The measurement is based on a harmonised data source, the European Union Labour Force Survey (EU-LFS).
Based on the ILO definition, Eurostat defines unemployed persons as persons aged 15 to 74 who:
The unemployment rate is the number of people unemployed as a percentage of the labour force.
The labour force is the total number of people employed plus unemployed. In this news release unemployment rates are based on employment and unemployment data covering persons aged 15 to 74.
The youth unemployment rate is the number of people aged 15 to 24 unemployed as a percentage of the labour force of the same age. Therefore, the youth unemployment rate should not be interpreted as the share of jobless people in the overall youth population.
When data for the most recent month are not available for a Member State, EU and EA aggregates are calculated using the latest data available for that Member State.
Geographical information
Euro area (EA21): Belgium, Bulgaria, Germany, Estonia, Ireland, Greece, Spain, France, Croatia, Italy, Cyprus, Latvia, Lithuania, Luxembourg, Malta, the Netherlands, Austria, Portugal, Slovenia, Slovakia and Finland.
European Union (EU 27): Belgium, Bulgaria, Czechia, Denmark, Germany, Estonia, Ireland, Greece, Spain, France, Croatia, Italy, Cyprus, Latvia, Lithuania, Luxembourg, Hungary, Malta, the Netherlands, Austria, Poland, Portugal, Romania, Slovenia, Slovakia, Finland and Sweden.
For more information