

Released: 2026-09-14
Consumer Price Index
August 2026
3.0% 
(12-month change)
Food purchased from stores
August 2026
2.8%
(12-month change)
Shelter
August 2026
1.5%
(12-month change)
Transportation
August 2026
7.5%
(12-month change)
The Consumer Price Index (CPI) rose 3.0% year over year in August, matching the 3.0% increase in July.
Year over year, prices for gasoline rose at a slower pace in August compared with July, putting downward pressure on the all-items CPI. Excluding gasoline, the CPI rose 2.4% in August, after increasing 2.2% in July.
In August, the slowdown in gasoline prices on an annual basis was offset by higher prices for travel tours and rent.
The CPI fell 0.1% month over month in August. On a seasonally adjusted monthly basis, the CPI rose 0.2%.
Chart 1

The 12-month change in the Consumer Price Index (CPI) and CPI excluding gasoline
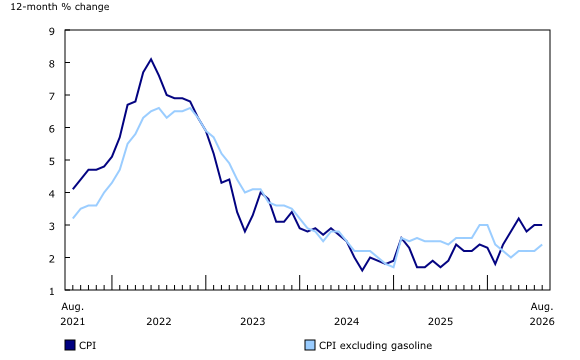
Chart 2
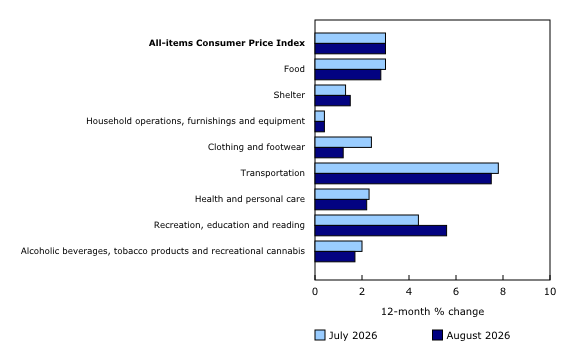
Prices increase at a slower pace in five major components in August
Prices for travel tours accelerate on a base-year effect
Year over year, prices for travel tours rose at a faster pace in August (+26.1%) compared with July (+15.2%), partly due to a base-year effect. Canadian travel to the United States declined sharply in 2025, putting downward pressure on prices for airfares and travel tours. Given that this decline has now stopped affecting the 12-month price movement, along with the introduction of fuel surcharges amid higher prices for jet fuel, upward pressure has been put on the travel tours index.
On a monthly basis, prices for travel tours fell 2.9% in August.
Gasoline prices increase at a slower pace
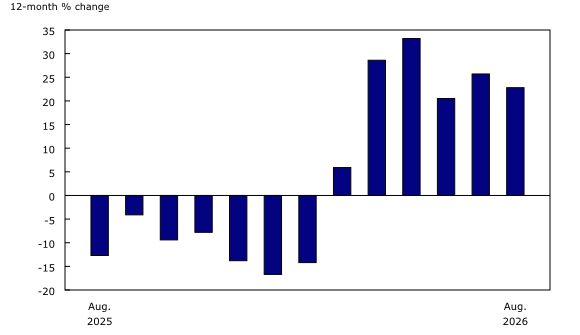
Prices for gasoline rose 22.8% year over year in August, following a 25.7% increase in July. Despite the year-over-year slowdown, prices for gasoline remained elevated, as the conflict in the Middle East continued in August.
Chart 3
Prices for gasoline decelerate year over year
Consumers pay less for clothing
On a year-over-year basis, consumers paid less for clothing in August (-1.1%) compared with July (+0.9%). The decline was driven by lower prices for men’s clothing (-2.3%) and children’s clothing (-1.9%), following increases of 2.0% for men’s clothing and 4.0% for children’s clothing in July.
Conversely, women’s clothing was unchanged (+0.0%) year over year in August, after falling 0.7% in July, moderating the decline in clothing prices.
Grocery price growth falls below headline inflation
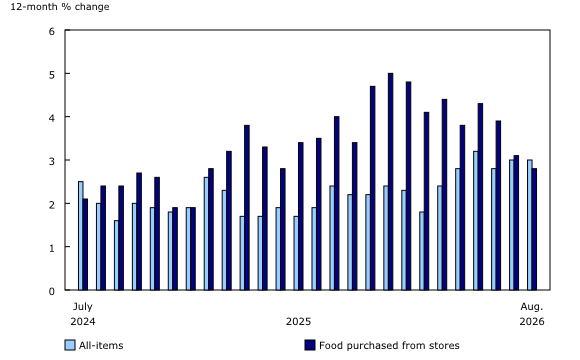
Price growth for food purchased from stores continued to slow in August, rising 2.8% year over year after increasing 3.1% in July. For the first time since July 2024, grocery price growth increased at a slower pace than the all-items CPI in August 2026.
Prices for dairy products led the deceleration in grocery prices; they rose 0.7% year over year in August compared with a 3.1% rise in July. Cheese and yogurt were the top contributors to the slowdown in dairy prices.
Smaller price increases for fresh or frozen pork (+1.6%), condiments, spices and vinegars (+0.7%) and fresh fruit (+4.7%) also contributed to the year-over-year slowdown in grocery inflation in August.
Although prices for groceries decelerated this month, prices have increased 29.0% since August 2021.
Chart 4
Grocery prices increase at a slower pace than the all-items Consumer Price Index
Regional highlights
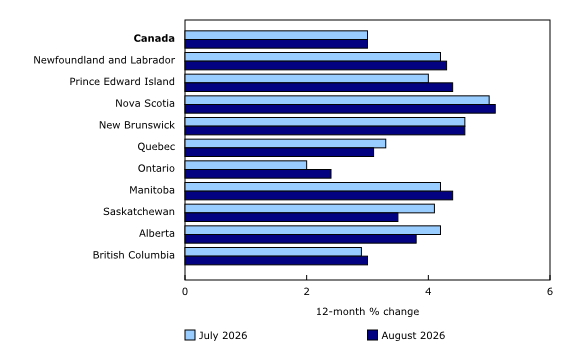
Year over year, prices rose at a faster pace in six provinces in August compared with July.
Among the provinces, the Atlantic provinces had the highest rates of inflation in August, with price growth accelerating in Prince Edward Island, Newfoundland and Labrador and Nova Scotia. Prices for fuel oil and other fuels rose at a faster pace in August (+43.7%) compared with July (+29.5%), putting upward pressure on prices in these provinces, where fuel oil is more commonly used.
At the national level, prices for rent increased 2.8% year over year in August compared with a 2.5% increase in July. Higher prices in Manitoba (+4.3%) and Ontario (+2.4%) drove this acceleration.
Chart 5
The Consumer Price Index increases at a faster pace in six provinces
Products
The “Consumer Price Index Data Visualization Tool” is available on the Statistics Canada website.
More information on the concepts and use of the Consumer Price Index (CPI) is available in The Canadian Consumer Price Index Reference Paper (Catalogue number62-553-X).
For information on the history of the CPI in Canada, consult the publication Exploring the first century of Canada’s Consumer Price Index (Catalogue number62-604-X).
Two videos, “An Overview of Canada’s Consumer Price Index (CPI)” and “The Consumer Price Index and Your Experience of Price Change,” are available on Statistics Canada’s YouTube channel.
The podcast ”Eh Sayers Episode 18 – Why Food Inflation Is Such A Hard Nut To Crack” is also available.
Find out answers to the most common questions posed about the CPI in the context of the COVID-19 pandemic and beyond.
Contact information
For more information, or to enquire about the concepts, methods or data quality of this release, contact us (toll-free 1-800-263-1136; 514-283-8300; infostats@statcan.gc.ca) or Media Relations (statcan.mediahotline-ligneinfomedias.statcan@statcan.gc.ca).