
Human heart samples
Human myocardial tissue samples were acquired from patients through the Utah Cardiac Recovery Program at the University of Utah under an approved IRB protocol (IRB-00030622). All samples were collected with informed consent from patients, organ donors or their guardians. Samples were acquired from consented patients who had chronic advanced heart failure with reduced ejection fraction at the time of heart transplantation. Non-failing donors that were ineligible for heart transplant due to non-cardiac reasons (such as donor–recipient size mismatch or infection) were used as a control. Myocardial tissue was collected in the operating room and immediately frozen in liquid nitrogen and subsequently stored in −80 °C until further use.
Animal care
All procedures were approved by the Institutional Animal Care and Use Committee (IACUC) of the University of Utah. Mice were housed at 22–23 °C using a 12 h light:12 h dark cycle. Mice were maintained on irradiated chow diet (Teklad Diet 2920x) with ad libitum access to water at all times. Food was only withdrawn during experiments starting at the beginning of the light cycle.
Adult cardiac-specific MPC1-knockout (Mpc1fl/fl; αMHCMerCreMer) mice were generated as previously described51. Mct1fl/fl mice were generated as previously described52. Cardiac-specific Cre recombinase was introduced by crossing mice with αMHCMerCreMer mice (Jackson Laboratories strain 005657). 8-week-old Mct1fl/fl:αMHCMerCreMer+/− and Mct1fl/fl; αMHCMerCreMer−/− littermates were injected intraperitoneally with 40 mg kg−1 tamoxifen for 3 consecutive days to yield adult Mct1iCKO and Mct1fl/fl (control) littermates.
Adult cardiac-specific MCT4-knockout (Mct4fl/fl; αMHC-MerCreMer) mice were generated as follows. Three embryonic clones carrying Slc16a3 tm1a (sencoding MCT4) were obtained from European Conditional Mouse Mutagenesis program/European Mouse Mutant Archive (EUCOMM/EMMA; http://www.infrafrontier.eu/). All clones were from the cell line JM8A3.N1 (background strain C57Bl/6NTac with agouti coat colour distribution). These embryonic stem cell clones were injected into the blastocoel of 3.5-day-old mouse blastocysts (host strain C57Bl/6 Tyrc-Brd). Injected embryos were transferred to the uterine horns of appropriately timed pseudopregnant recipient C57BL/6-Tyrc-Brd females. The chimeras with highest embryonic stem cell contribution were bred with C57Bl/6J mates to test for germline transmission of the targeted allele. The pups were screened for the presence of germline transmitted tm1a and those positive were further propagated (first allele knockout tm1a, reporter-tagged insertion with conditional potential). Mice carrying the appropriate flox alleles were crossed with αMHCMerCreMer mice as described above. Experiments on all mice began 4 weeks post-injection (at 12 weeks of age).
Echocardiographic assessment
Mice were anaesthetized with 1.5% isoflurane (Vet One, NDC 13985-046-60). Echocardiographic images were captured using the Vevo imaging system (VisualSonics) sequentially. Both 2D long-axis and short-axis views were obtained and analysed with Vevo Strain software (v3.1.1). All measurements were conducted using three consecutive cardiac cycles. Limb leads were affixed using conductive cream to facilitate electrocardiogram (ECG) recording.
Osmotic minipump model
Twelve-week-old C57BL/6 mice were divided into four groups, weighed, and screened before surgery by echocardiography to establish baseline cardiac parameters. Surgical instruments were sterilized using a glass bead sterilizer prior to the surgery and aseptic technique was utilized during the procedure. The osmotic minipumps (Alzet, model 2006) were filled with angiotensin II (1.5 μg g day−1) and phenylephrine (50 μg g day−1) in 0.9% NaCl at 0.15 μl h−1 for 42 days (Model 2006) according to the manufacturer’s instructions. The pumps were surgically implanted subcutaneously on the back through a small incision, under isoflurane (1.5% in O2) anaesthesia. After the pump was implanted, and the incision was closed, the mice were placed in a clean, warm cage and monitored for any signs of distress. Next, mice were weighed and screened weekly via echocardiography. After 42 days of treatment with AngII/PE, the mice were euthanized by cervical dislocation and blood and heart tissue were taken for further analysis.
TAC experiments
Baseline echocardiograms were acquired, and TAC was surgically performed on both male and female Mct1fl/fl and Mct1iCKO mice aged 12–14 weeks, as previously described53,54. In brief, before surgery, a subcutaneous dose of sustained-release Buprenorphine SR (0.15 mg kg−1) was administered for analgesia. Mice were anaesthetized with 2–3% isoflurane in oxygen, delivered via nosecone connected to a VetFlo vaporizer. The aortic arch was visualized and constricted using a titanium clip. The surgical incision was closed using 6-0 sutures in layers. During recovery, regular-release buprenorphine was given as needed, for up to 48 h. Unclipped Mct1fl/fl and Mct1iCKO mice (sham) served as controls, undergoing anaesthesia and a small incision without aortic constriction or cardiac damage. Following surgery, mice received weekly echocardiograms for six consecutive weeks to assess cardiac function and structure.
Ischemia–reperfusion experiments
The experimental protocol was conducted on 20–30 g, 12–14-week-old Mct1iCKO and Mct1fl/fl mice, 4 weeks after tamoxifen injection and before the onset of heart failure symptoms. Mice were anaesthetized with 2–3% isoflurane, intubated using a 22 G IV catheter, and ventilated at 100 breaths per min with a small rodent respirator. Mice were placed supine on a warming pad at 38 °C, and chest hair was removed with depilatory cream, which was rinsed off with water or saline to avoid skin irritation. The skin was then prepped with betadine and alcohol. A thoracotomy was performed to access the heart, and a retractor was used to improve visibility. The pericardium was carefully removed, avoiding myocardial damage. Under a dissecting microscope, the left anterior descending coronary artery (LAD) was located, and a 6-0 silk suture was placed under it. A loose double knot was tied with a 2–3 mm diameter loop, through which a 2–3 mm piece of PE-10 tubing was placed. The tubing, pre-soaked in 100% ethanol and rinsed with sterile water, was used to tighten the loop around the artery, achieving coronary occlusion for 30 min. Successful LAD ligation was confirmed by a paler colour on the LV anterior wall. After 30 min, the knot was untied, and the tubing was removed, confirming reperfusion by the return of a red colour to the LV wall, which continued for 2 h.
In acute experiments, the coronary artery was briefly re-occluded after injury, and Evans blue dye was injected into the left atrium to mark the area at risk. Hearts were excised, perfused with saline, weighed and sectioned into 1 mm slices using a vibratome, or separated into ischemic and non-ischemic samples and flash-frozen in liquid nitrogen. Slices were incubated in 1% triphenyltetrazolium chloride at 38 °C for 20 min to stain viable myocardium, then fixed in 10% formalin to distinguish between viable and necrotic tissue. Tissue sections were imaged the next day, and myocardial salvage was quantified using ImageJ by blinded researchers. For chronic experiments, mice underwent 30 min of ischemia, after which the ligature was removed, and the incisions were closed with sutures. Mice were placed in a warm cage, monitored for distress, weighed, and screened weekly via echocardiography.
Exercise capacity testing
12–14-week-old mice (Mct1fl/fl and Mct1iCKO) practiced a 5-day treadmill acclimation protocol prior to any maximal exertion. This allowed for familiarity with the procedure, but did not produce any training effect on the mice55. In brief, following a day of rest, mice were weighed, and the maximal treadmill test was performed. The test started with a warm-up period of 10 min, a treadmill speed of 10 m min−1, and an incline of 10% grade. After this, the speed was increased by 5 m min−1 every 2 min until the mouse resisted a physical stimulus (touching the tail or backside of the mouse with a bristle brush) to run for more than 20 s or sat on the back of the non-moving treadmill belt five times in a 30 s period. If either occurred the time was recorded, the test was finished, and the mouse was returned to its cage to recover. Maximal treadmill speed did not exceed 30 m min−1 throughout the exercise testing. Total work (in kg m−1) and time to exhaustion (in min) were then calculated for each mouse. Blood lactate (in mmol l−1) was measured at 10, 20, and 30 m min−1, and 10% grade to assess the systemic effects of lactate production in the Mct1iCKO compared with the Mct1fl/fl controls.
Jugular vein catheterization surgery
Sterile mouse jugular vein catheters were purchased from SAI Infusion Technologies and one channel vascular access button from Instech Laboratories. Mice were fasted before surgery, pre-operatively shaved and administered bupivacaine before anaesthesia. A dissection microscope (Leica S9i Stereo) was utilized during the placement of the catheter. Mice were provided standard recovery support and allowed at least 5 days recovery before further use in experiments. Mice with impaired vital signs, activity or reflexes were euthanized and not included in experimental studies.
Stable isotope infusions
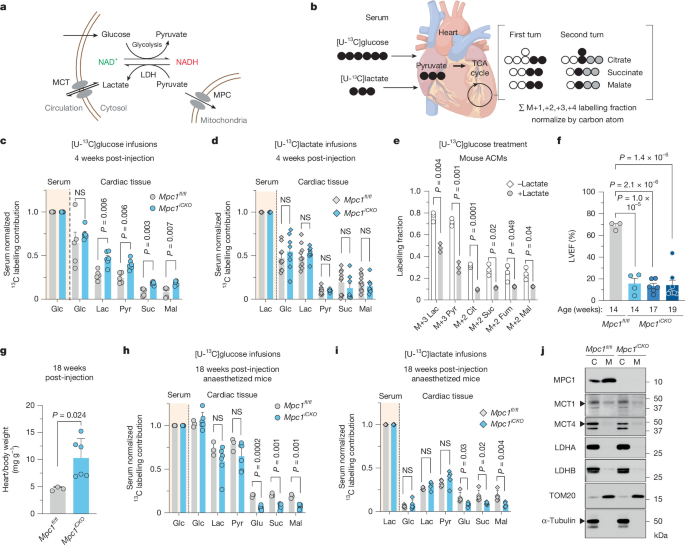
12-week-old surgically catheterized mice were maintained on a normal light cycle (06:00–18:00). On the day of infusion experiment, mice were transferred to new cages without food at 06:00 (beginning of their sleep cycle) and infused for 2–3 h (metabolite-specific) starting at around 12:00 to reach serum steady state based on previously published studies. The infusion setup (Instech Laboratories) included a swivel and tether to allow the mouse to move around the cage freely. Water-soluble isotope-labelled metabolites (Cambridge Isotope Laboratories) were prepared as solutions in sterile normal saline. To make 13C-labelled fatty acid solutions, the fatty acids were complexed with bovine serum albumin in a molar ratio 4:1. The infusion rate was set to 0.1 μl min−1 g−1 for water-soluble metabolites and 0.4 μl min−1 g−1 for fatty acids. Final infusion solutions and times were 200 mM [U-13C]glucose for 3 h, 490 mM [U-13C]sodium lactate for 2 h, 50 mM [U-13C]3-hydroxybutyrate, 8 mM [U-13C]oleic acid or 4 mM [U-13C]sodium palmitate all for 3 h. [U-13C]glucose infusion with AZD treatment was achieved by dosing mice with 100 mg kg−1 AZD or vehicle (0.5% HPMC (hydroxypropyl methylcellulose), 0.1% Polysorbate 80) by oral gavage 6 h prior to infusion start and again at start of infusion. [U-13C]glucose was infused using the same parameters as other experiments and mouse blood and tissue harvested as described. Blood was collected by tail snip (~10 μl) and transferred into blood collection tubes (Microvette CB 300 Z). Blood samples were stored on ice and then centrifuged at 5,000g for 5 min at 4 °C to collect serum. Tissue harvest was performed at the end of the infusion after euthanasia by cervical dislocation. Tissues were quickly dissected, rinsed in cold PBS, clamped with a pre-chilled Wollenberger clamp, and dropped in liquid nitrogen.
Tail vein infusion
Mice were anaesthetized with 2% isoflurane inhalation and maintained under anaesthesia for the duration of the infusion. A 30G catheter was inserted into the mouse tail vein, and the stable isotopes were administered as described below. For glucose infusion, 0.2 M [U-13C] glucose was administered as a bolus of 1.6 μl g−1 min−1 for 2 min, followed by a constant infusion rate 0.1 μl g−1 min−1of for 30 min. For lactate infusion, 1.67% [U-13C] lactate was administered as a bolus of 0.96 μl g−1 min−1 for 2 min, followed by a constant infusion rate 0.3 μl g−1 min−1of for 30 min. Blood was collected retro-orbitally during the procedure, and tissues were harvested immediately at the end of the infusion as described for jugular vein catheter infusions.
Tissue and serum metabolite extraction
Serum (4 μl) was diluted with 140 μl of ice-cold 80% methanol:20% water solution and vortexed. Seventy-two microlitres of chloroform was added, the solution vortexed again and centrifuged at 15,060g for 10 min at 4 °C to enforce phase separation. Aqueous supernatant was used for LC–MS analysis. For tissue extractions, 30-40 mg sections of snap frozen mouse tissue were transferred to pre-chilled Safe-Lock tubes (Eppendorf, 022363352) containing a cold 5/16-inch-diameter stainless steel ball (Grainger, 4RJL8). The tissue was disrupted by shaking at 25 Hz for 30 s under liquid nitrogen using the Retsch CryoMill (Retsch, 20.749.0001). Fifteen microlitres per milligram of tissue of −80 °C polar metabolite extraction solution containing 40:40:20 acetonitrile:methanol:water and 0.1% formic acid was added to homogenized tissue. Samples were briefly vortexed before neutralizing with 8 μl of 15% ammonium bicarbonate per 100 ml of extraction solvent. The solution was centrifuged at 16,000g for 10 min at 4 °C. The supernatant was collected and the pellet extracted a second time with 525 μl of chilled 40:40:20 methanol:acetonitrile:water. Both supernatants were combined and 525 μl of chloroform was added. The mix was vortexed and centrifuged at 16,000g for 10 min at 4 °C, and final aqueous layer transferred to LC–MS tubes for analysis.
LC–MS analysis of polar metabolites
Extracted polar metabolite samples were analysed by LC–MS. Separation was achieved by hydrophilic interaction liquid chromatography (HILIC) using a Vanquish HPLC system (ThermoFisher Scientific). The column was an Xbridge BEH amide column (2.1 mm × 150 mm, 2.5 µm particle size, 130 Å pore size, Waters) run with a gradient of solvent A (20 mM ammonium hydroxide, 20 mM ammonium acetate in 95:5 acetonitrile:water, pH 9.5) and solvent B (100% acetonitrile) at a constant flow rate of 150 μl min−1. The gradient function was: 0 min, 90% B; 2 min, 90% B; 3 min, 75% B; 7 min, 75% B; 8 min, 70% B; 9 min, 70% B; 10 min, 50% B; 12 min, 50% B; 13 min, 25% B; 14 min, 25% B; 16 min, 0% B; 20.5 min, 0% B; 21 min; 90% B; 25 min, 90% B. Autosampler temperature was 4 °C, column temperature 30 °C and injection volume 3 µl. Samples were injected using electrospray ionization into a QExactive HF orbitrap mass spectrometer (ThermoFisher Scientific) operating in negative ion mode with a resolving power of 75,000 at m/z of 200 and a full scan range of 75–1,000. Data were collected using the Xcalibur software suite. Data were analysed using the EL-MAVEN software package and specific peaks assigned based on exact mass and comparison with known standards56. Extracted peak intensities were corrected for natural isotopic abundance using the R package AccuCor57. Untargeted LC–MS data were analysed using MetaboAnalyst.
TCA cycle labelling contribution analysis
Total carbon atom fractional contributions were determined by dividing the natural isotope abundance corrected experimental labelling fractions by the number of carbons of each metabolite to determine a single carbon weighted labelling fraction for each metabolite. These were normalized to the serum tracer weighted labelling fraction (presented as 1 in all graphs)38,58.
Langendorff ex vivo heart perfusion
Mice were administered heparin (100 IU, intraperitoneally) 20 min before anaesthesia with 3% isoflurane followed by cervical dislocation. Hearts were rapidly excised and cannulated on a Langendorff perfusion apparatus (flow rate: 2.6 ml min−1). The modified Krebs–Henseleit buffer contained 118 mM NaCl, 4.7 mM KCl, 2.5 mM CaCl2, 1.2 mM KH2PO4, 1.2 mM MgSO4, 24 mM NaHCO3, 0.5 mM EDTA, 0.7 mM oleic acid complexed to 2% albumin, 11 mM glucose, 50 μM L-carnitine, 1.5 mM lactate, 0.2 mM pyruvate, 0.8 nM insulin and 5 nM adrenaline to reproduce the non-fasted substrate and hormone conditions in mice as previously described1. The buffer was equilibrated with 95% O2/5% CO2 and maintained at 37 °C.
Hearts were retrograde perfused in non-recirculating mode for 30 min while beating spontaneously. For isotope tracing, unlabelled substrates were replaced with their labelled counterparts: [U-13C]glucose, [U-13C]lactate, or [2-2H]lactate. Electrocardiogram leads connected to an AD Instruments PowerLab 8/35 were positioned on the cannula (just above the aorta) and the apex of the heart to measure heart rate. Heart rate was averaged over a 30 s interval, 1 min before termination of perfusion. Hearts were clamped with a pre-chilled Wollenberger clamp and dropped in liquid nitrogen or mitochondria were isolated as described above.
Adult cardiomyocyte isolation
Isolation of adult cardiomyocytes followed previously established protocols16,38. In brief, 12-week-old adult mice were anaesthetized with isoflurane before the heart was excised and attached to an aortic cannula. The heart was then perfused with oxygenated solutions maintained at 37 °C and pH 7.3. A 0 mM Ca2+ solution was perfused for 5 min, followed by a further 15 min of perfusion with the same solution containing 1 mg ml−1 collagenase and 0.1 mg ml−1 protease. This was succeeded by 1 min of perfusion with stopping solution (the same solution containing 20% serum and 0.2 mM CaCl2), all at a flow rate of 2 ml min−1. After removal of the atria, ventricles were teased apart with forceps, gently rocked for 10 min, and filtered through a nylon mesh. Following gravity sedimentation, the resulting cells were stored at 37 °C in normal HEPES buffered solution before plating as described below. The resulting isolated myocytes displayed a rod-shaped morphology with distinct striations and exhibited no spontaneous contractions.
ACM culture and growth assays
ACMs were incubated with tracers in DMEM or human plasma-like medium (HPLM) as indicated. HPLM was made in-house as previously described59. Glucose or lactate was selectively excluded and replaced with heavy isotope tracers as required. Additionally, the plating media for both DMEM or HPLM consisted of 100 μg ml−1 Primocin, 100 U ml−1 penicillin-streptomycin, 10 mM HEPES, 5% dialysed fetal bovine serum, and 10 mM 2,3-butanedione monoxime. Primary adult cardiomyocytes were isolated (as described above) and enriched through gravity sedimentation in increasing concentrations of Ca2+. Following isolation, cells were plated on Laminin-coated Petri dishes or coverslips and allowed to adhere for at least 1 h in a 5% CO2 incubator. Subsequently, cells were transitioned to an HPLM or DMEM-based culture medium supplemented with Primocin, penicillin-streptomycin, HEPES, insulin-transferrin-selenium, 0.1 mg ml−1 BSA, and a physiological BSA-conjugated fatty acid mix, as previously described60.
Permeabilized ACM assay and imaging
ACMs were isolated and cultured in HPLM without 2,3-butanedione monoxime and allowed to adhere for at least 1 h on a laminin-coated 24-well plate. Cells were washed with warm PBS followed by 5-min incubation with 0, 25 or 100 μg ml−1 saponin in mitochondrial assay buffer (MAB) for permeabilization. Cells were then washed 1× with MAB and incubated at 37 °C in MAB. MAB composition was as follows: 2 mM KH2PO4, 120 mM KCl, 3 mM HEPES, 1 mM EGTA, 3 g l−1 BSA (essentially fatty acid-free), 1 mM lactate, 50 μM pyruvate, and 1 mM glutamine. The pH of the buffer was adjusted to 7.2 using 5 N KOH. Incucyte Cytotox NIR dye (Sartorius 4846) was added at 0.6 μM during final MAB incubation and cells were imaged at 20× on Incucyte Live-Cell Analysis system using the near-infrared optical module (excitation 648–674 nm, emission 685–756 nm). After imaging, cells and supernatant (1:1) were collected in RIPA for downstream analysis of cytochrome c by immunoblotting. For confocal imaging, ACMs were plated on laminin-coated 35 mm Quad μ-Dish (ibidi 80416) and permeabilizaed as described above. After incubation in MAB, cells were incubated in 1 μg ml−1 DAPI (ThermoFisher D3571) for 5 min followed by incubation in 150 nM MitoTracker Red CMXRos (ThermoFisher M7512) and MitoTracker Green FM (ThermoFisher M7514) for 20 min. Cells were imaged at 40× magnification in Zeiss LSM 880 Airyscan confocal microscope. All cells were acquired at the same power and gain settings. Image analysis was performed using ImageJ.
For stable isotope tracing, ACMs were plated on laminin-coated 10 cm plate and permeated with 25 μg ml−1 saponin as described above. After 5 min, saponin was removed and new MAD containing [U-13C]lactate added. After 10 min with tracer, MAB was aspirated and metabolites were extracted with ice-cold 80:20 methanol:H2O as described above. For AZD (10 μM) treatment, inhibitor was added to the saponin incubation, PBS washes and maintained throughout tracing.
Mitochondrial isolation
One whole mouse heart was homogenized in ice-cold CP-1 buffer (100 mM KCl, 50 mM Tris HCl, 2 mM EGTA; pH 7.4) using a Teflon pestle and glass tube (30–50 strokes, or until a homogenous mixture was obtained). The sample was transferred to a 1.5 ml Eppendorf tube and centrifuged at 700g for 10 min at 4 °C. The supernatant was then transferred to a new 1.5 ml Eppendorf tube and centrifuged at 10,500g at 4 °C. The supernatant was discarded and the pellet was washed with 1 ml fresh ice-cold CP-1 buffer, then centrifuged at 10,500g. Following 2 consecutive wash and spin steps, the final pellet was resuspended in 300 µl CP-1 buffer and protein concentration was determined using the Pierce Dilution-Free Rapid Gold BCA assay (ThermoFisher Scientific A55860). The same protocol was performed for isolation of mitochondria from ACMs (using ACMs from one mouse heart), frozen human heart samples, and HEK293T cells (40,000 cells, freshly pelleted and washed once with PBS). This preparation was used for metabolomics and respirometry experiments. For the immunoblotting, immunoprecipitation and proteomics experiments, these preparations were further purified by ultracentrifugation on a two-step (1.33 M, 1.55 M) sucrose gradient. Gradients were centrifuged at 4 °C for 1 h at 22,500 rpm. Mitochondria formed a compact, brown-coloured band at the interface. An 18-gauge needle was used to carefully recover the mitochondrial band for further analysis.
Mitochondrial respiration measurements
Mitochondrial O2 utilization was measured using the Oroboros Oxygraph-2K system. Following BCA assay, freshly isolated mitochondria (25 µg) were added to the respirometry chambers containing 2 ml of assay buffer Z (pH 7.1, MES potassium salt 105 mM, KCl 30 mM, KH2PO4 10 mM, MgCl2 5 mM, BSA 1 mg ml−1). Respiration on lactate or pyruvate was measured with the following additional substrates: 0.5 mM pyruvate or 0.5 mM lactate with 1 mM ADP and 500 µM malate. Inhibitors of pyruvate and lactate metabolism were added to the buffer in the following concentrations: CPI-613 (PDH and αKGDH inhibitor) 240 μM, GSK 2837808 A (pan-LDH inhibitor) 8 μM, and 7ACC2 (MCT1 inhibitor) 10 μM or DMSO control.
LDH activity assay
Mitochondria were freshly isolated as described above. For mitochondria pretreated with proteinase K, proteinase K was added to freshly isolated mitochondria in CP-1 buffer at a concentration of 5 µg proteinase K per µg isolated mitochondria. Samples were incubated on ice for 5 min, and proteinase K activity was quenched with PMSF (final concentration, 18 mM). Reactions were performed in black wall, black bottom 96-well plates. Freshly isolated mitochondria (15–30 µg) were added to 175 µl buffer D (105 mM MES-potassium, 30 mM KCl, 10 mM KH2PO4, 5 mM MgCl2, 1 mM EGTA, 2.5 g l−1 BSA, 5 µM rotenone). Buffer D was supplemented with alamethicin (final concentration 30 µg ml−1) and/or oxamate (final concentration 50 mM) where listed. Finally, lactate and NAD+ were added at final concentrations of 3 mM and 1 mM, respectively. NADH autofluorescence was measured at 20 s intervals for 20 min immediately following the addition of lactate and NAD+ at 360/460 nm (excitation/emission) using a Biotek Synergy Neo2 multimodal plate reader (Agilent Technologies).
In vitro metabolite tracing
ACMs were plated as described in HPLM-FA medium. For tracing experiments, glucose- or lactate-free HPLM-FA medium was made in-house, and [U-13C]glucose or [U-13C]lactate was added to the medium. Cells were incubated for 4 h. Isolated mitochondria were treated identically as reactions were carried out at 37 °C in HPLM-FA medium with appropriate 13C-tracers and quenched with −80 °C cold methanol. Cell plates were washed with ice-cold PBS 2× and then 80:20 methanol:water was added at 60× the packed cell volume (MidSci, TP87005) count. The resulting mixture was incubated on dry ice, scraped, collected into a microfuge tube, vortexed, rested on dry ice for 5 min and centrifuged at 16,000g for 10 min. Supernatant was placed into a fresh tube which was then centrifuged again at 16,000g for 10 min. The supernatant was placed in an MS tube (Agilent 5188-2788) for downstream analysis.
Rapid isolation of cardiomyocyte mitochondria from heart tissue
All procedures for mitochondria isolation were performed on ice. Heart tissue was rapidly excised and rinsed in ice-cold PBS prior to homogenization. Approximately 30 mg of heart tissue was homogenized in 2 ml of KPBS (135 mM KCl, 10 mM KH2PO4, pH 7.25, in LC–MS water) supplemented with 5 mM sodium oxamate using a Dounce homogenizer. The homogenate was centrifuged at 1,000g for 2 min at 4 °C. The resulting supernatant was subjected to immunoprecipitation with prewashed anti-HA beads for 3.5 min, followed by washing in KPBS 3 times. In the final wash, 10% of the bead suspension was reserved for protein extraction. The remaining beads were then extracted with a solution consisting of 80% (v/v) LC–MS grade methanol and 20% (v/v) LC–MS grade water, and the extracts were analysed with LC–MS.
Immunoblotting
Samples were washed with PBS and lysed in RIPA buffer (50 mM Tris, 150 mM NaCl, 0.1% SDS, 0.5% sodium deoxycholate, 1% NP-40) containing protease and phosphatase inhibitors. Protein concentrations were determined using the Pierce BCA Protein Assay Kit. Samples were combined with 4× sample loading buffer and heated at 95 °C for 5 min. A total of 20 μg of protein lysate was separated on an SDS polyacrylamide gel following standard procedures at 20 mA per gel, then transferred to a 0.45 μm nitrocellulose membrane (GE Healthcare) using a Mini Trans-blot module (Bio-Rad) at a constant voltage of 100 V for 2 h. The membrane was blocked with 5% non-fat milk (Serva) in Tris-buffered saline with 0.05% Tween 20 (TBS-T) overnight at 4 °C and then incubated for 3 h to overnight in 5% non-fat milk or 5% bovine serum albumin (Sigma) in TBS-T with primary antibodies against MPC1 (Cell Signaling 14462, 1:1,000), MPC2 (Cell Signaling 46141, 1:1,000), VDAC (Cell Signaling 4866, 1:5000), MCT1 (Santa Cruz sc-365501, 1:500, Proteintech 20139-1-AP, 1:1,000), MCT2 (Invitrogen PA5-88516, 1:1,000), MCT4 (Proteintech 22787-1-AP, 1:1,000), LDHA (Proteintech 19987-1-AP, 1:1,000), LDHB (Proteintech 14824-1-AP, 1:1,000), COX IV (Cell Signaling 4850, 1:1,000), ATP5A (Cell Signaling 18023, 1:1,000), TOM20 (Cell Signaling 42406, 1:1,000), TOM70 (Santa Cruz sc-390545, 1:1,000), ACO2 (Cell Signaling 6922, 1:1,000), LC3B (Cell Signaling 2775, 1:1,000), OPA1 (Cell Signaling 80471, 1:1,000), Na, K-ATPase (Cell Signaling 3010, 1:1,000), calreticulin (Cell Signaling 2891, 1:1,000), TIM23 (Cell Signaling 34822, 1:1,000), AIF (Cell Signaling 4642, 1:1,000), citrate synthase (Cell Signaling 14309, 1:1,000), HA tag (Cell Signaling 3724, 1:1,000), vinculin (Cell Signaling 13901, 1:1,000) and α-tubulin (Cell Signaling 3873, 1:1,000, Proteintech 11224-1-AP, 1:1,000). The membrane was then washed with TBS-T and incubated with the appropriate fluorophore-conjugated secondary antibody (Rockland Immunochemical, 1:10,000) or HRP-conjugated secondary antibody in 1% non-fat milk/TBS-T for 30 min. After a final wash with TBS-T, fluorescence was detected using the Odyssey CLx imaging system (LI-COR Biosciences) or with incubation with SuperSignal West Pico PLUS Chemiluminescent Substrate (ThermoFisher) or Western Lightening Plus Chemiluminescent reagent (Revvity, NEL105001EA) and visualization using a Bio-Rad luminescent imaging system or exposure to X-ray film.
MCT1 immunoprecipitation
For proteomic confirmation of mitochondrial MCT1 localization, mitochondria were purified from mouse hearts, subjected to anti-MCT1 immunoprecipitation, and analysed by LC–MS/MS. Mitochondrial preparations were washed twice with ice-cold PBS before being pelleted by centrifugation at 1200 rpm for 3 min. The pellets were lysed in 50 µl of RIPA lysis buffer on ice for 10–20 min. Lysates were then centrifuged at 16,100g for 10 min, and the supernatants were transferred to fresh tubes. For each condition, immunoprecipitations were performed as follows: Experimental immunoprecipitation: mouse anti-MCT1 was added to the supernatant at a ratio of 1.5–2 µl antibody per sample. Control immunoprecipitation: normal mouse IgG (Cell Signaling 61656) was diluted to match the concentration of the experimental antibody and added to a separate sample of lysate. Both immunoprecipitation reactions were incubated overnight at 4 °C with rotation. The next day, samples were washed three times with lysis buffer. For each immunoprecipitation, 25–35 µl of prewashed magnetic protein G beads were added to the samples, and incubated with rotation for 2 h at 4 °C. Beads were then collected by a magnet, and washed three times with lysis buffer. After washing, beads were eluted and immunoprecipitated proteins separated by SDS–PAGE and either immunoblotted for MCT1 or the MCT1-sized band was excised and sent directly for proteomic analysis. Gel bands were excised, and their protein content was digested in-gel with trypsin61,62. The extracted peptides were desalted via StageTip, dried using vacuum centrifugation, and reconstituted in 5% acetonitrile with 5% formic acid for LC–MS/MS processing63.
Proteomics via tandem mass spectrometry
Mass spectrometric data were collected on Orbitrap Fusion Lumos instruments coupled to a Proxeon NanoLC-1200 UHPLC. The 100 µm capillary column was packed with 35 cm of Accucore 150 resin (2.6 μm, 150 Å; ThermoFisher Scientific) at a flow rate of 360 nl min−1. The scan sequence began with an MS1 spectrum (Orbitrap analysis, resolution 60,000, 350–1,350 Th, automatic gain control (AGC) target 100%, maximum injection time of 118 ms). Data were acquired for 60 min per sample. The hrMS2 stage consisted of fragmentation by higher energy collisional dissociation (HCD, normalized collision energy 36%) and analysis using the Orbitrap (AGC 2 × 10⁵, maximum injection time 60 ms, isolation window 1.2 Th, resolution 7.5 K). Data were acquired using the FAIMSpro interface the dispersion voltage set to 5,000 V, the compensation voltages were set at −40V, −60V, and −80V, and the TopSpeed parameter was set at 1 s per compensation voltage. Mass spectra were processed using a Comet-based in-house software pipeline. Mass spectra were converted to mzXML using a modified version of ReAdW.exe. Database searching included all entries from the human UniProt database (downloaded November 2021), which was concatenated with a reverse database composed of all protein sequences in reversed order. The digest was set to semi-tryptic. Searches were performed using a 50 ppm precursor ion tolerance and the product ion tolerance was set to 0.02 Th. Oxidation of methionine residues (+15.9949 Da) was set as a variable modification. PSM filtering was performed using a linear discriminant analysis, as described previously64, while considering the following parameters: XCorr (cross-correlation score), ΔCn (delta correction score), missed cleavages, peptide length, charge state, and precursor mass accuracy. Peptide-spectral matches were identified, quantified, and collapsed to a 1% false discovery rate and then further collapsed to a final protein-level false discovery rate of 1%.
Proteinase K protection assay
Freshly isolated mitochondria (50–100 µg) were resuspended in 50–100 µl of the following assay buffers for a final concentration of 1 µg mitochondrial isolate per µl: isotonic (225 mM mannitol, 75 mM sucrose, 1 mM EGTA, 10 mM HEPES; pH 7.4), hypotonic (10 mM HEPES; pH 7.4), and detergent (isotonic buffer + 1% Triton X-100). For proteinase K-positive samples, buffers were prepared with Proteinase K at a final concentration of 5 µg µl−1. After 5 min (isotonic, hypotonic) or 10 min (detergent) of incubation on ice, PMSF was added to quench proteinase K activity (final concentration, 18 mM). Following gentle agitation and 5 additional minutes of incubation on ice, isotonic and hypotonic samples were centrifuged at 10,000g for 10 min at 4 °C. Supernatants were removed and pellets were resuspended in 50–100 µl of isotonic or hypotonic buffer containing 1 mM PMSF (for a final concentration of 1 µg mitochondrial isolate per µl, based on the initial protein concentration of mitochondrial isolate). 4× Laemelli buffer and 1 M DTT were added for a final concentration of 1× Laemelli buffer and 50 mM DTT. Samples were then boiled at 95 °C for 5 min. Finally, 15 µl of each sample was loaded onto SDS–PAGE gels for analysis.
Quantitative PCR analysis
Total RNA from mouse hearts was isolated using RNeasy Mini Kits (Qiagen), according to the manufacturer’s instructions. Next, cDNA was synthesized using a cDNA Reverse Transcriptase Kit (New England Biolabs). TaqMan-based real-time quantitative PCR was then performed using a QuantStudio 7 Pro Real-Time PCR System (ThermoFisher). The housekeeping gene vinculin (Vcl) was used as an internal control for cDNA quantification and normalization of gene amplified products.
In vitro hypoxia–reoxygenation injury
Imaging was performed as described previously65. In brief, isolated cardiomyocytes were suspended in HPLM-FA medium and placed in an airtight chamber at 37 °C. To stimulate ischemic conditions, the chamber was flushed with a gas mixture containing 95% N2 and 5% CO2 to deplete the oxygen in the chamber. The chamber was then sealed, and the cells left for 2 h at 37 °C. After 2 h, the cells were removed from the chamber and placed under normal cell culture conditions (37 °C, room air supplemented with 5% CO2) for an additional 2 h to reoxygenate and model reperfusion. Control cells were suspended in supplemented HPLM medium and kept at 37 °C, in room air with 5% CO2 for 4 h. For imaging, the cells were loaded with either 20 nM of TMRM (Thermo Fisher), 5 μM MitoSox (Thermo Fisher) or 5 μM X-Rhod1 (Thermo Fisher) to measure mitochondrial membrane potential, mitochondrial ROS levels and mitochondrial Ca2+ levels, respectively. The cells were then placed onto glass-bottomed dishes (MatTek) and imaged using a Leica SP8 confocal microscope. All three dyes were measured with an excitation and emission at 548 nm and 574 nm. All cells were imaged at the same power and gain settings and images were collected within 30 min after removal from incubator following simulated reperfusion. Image analysis was performed using ImageJ66.
Blue Native PAGE and immunoblotting
Crude mitochondrial fractions were normalized to total protein content and separated by 3–12% BN-PAGE (Invitrogen, BN2011BX10). In brief, 100 µg of mitochondria from Mct1fl/fl or Mct1iCKO mice hearts were lysed on ice in 100 µl of 1× pink NativePAGE sample buffer (Invitrogen, BN2008) containing 1% digitonin for 15 min and spun down at 4 °C for 20 min at 20,000g. Cleared mitochondrial lysate was transferred to a new 1.5 ml Eppendorf tube and 5 µl of NativePAGE 5% G-250 sample additive (Invitrogen, BN2008) was added. 10 µg of mitochondrial protein extracts were separated by 3–12% BN-PAGE using the Invitrogen NativePAGE system (Invitrogen, BN2007). Mitochondrial proteins were transferred to a polyvinylidene difluoride membrane (Millipore Sigma, IPVH00010) and blocked with 5% non-fat dry milk. Immunoblotting was performed using an OXPHOS antibody cocktail as primary antibody at 1:1,000 dilution (Abcam, ab110413). The membrane was then incubated with the Immun-Star Goat Anti-Mouse (Bio-Rad Laboratories, 1705047) horseradish peroxidase-conjugated secondary antibody at 1:10,000 dilution and developed with Western Lightning Plus chemiluminescent detection solutions (NEL105001EA; Revvity) and exposed to X-ray film.
Seahorse assay
The Seahorse Mitochondrial Stress Test was performed following the manufacturer’s instructions on a Seahorse XF Pro Analyzer. Adult cardiomyocytes were plated in a 96-well seahorse plate in HPLM medium without BSA-conjugated fatty acids. The Seahorse assay was performed using 3 μM oligomycin, 1 μM FCCP and 1 μM rotenone/1 μM antimycin A, with a standard protocol of three measurement cycles for each phase (2 min mixing, 3 min waiting and 3 min measuring). After the assay, data were analysed in the Seahorse WAVE software through the XF Mito Stress Test Report.
Transmission electron microscopy
After euthanasia, the mouse coronary artery was retrogradely perfused through the aorta with 20 ml of ice-cold fixative (formaldehyde/glutaraldehyde 2.5% in 0.1 M sodium cacodylate buffer). All fixatives and chemicals used for transmission electron microscopy are from Electron Microscopy Sciences. After perfusion, left ventricles were sliced into 1 mm3 tissue sections, stored at 4 °C in fixative, and sent to the Electron Microscopy Laboratory at University of Utah for further processing. After post-fixation with 2% osmium tetroxide and prestaining with uranyl acetate, the ventricular tissue slices were dehydrated in graded ethanol and pure acetone, imbedded with epoxy resin, and sectioned at 70 nm using an ultramicrotome (Leica). Sections were poststained with acetate and lead citrate before imaging with JEM-1400Plus or JEM1200-EX (JEOL) transmission electron microscope with a CCD Gatan camera.
Mitochondrial morphology and cristae content analysis
Mitochondrial morphology and cristae content were analysed from transmission electron microscopy images using ImageJ software. The outer boundary of each mitochondrion, along with the contours of individual cristae within each mitochondrion, were manually traced using the freehand selection tool. Morphological parameters including mitochondrial area, circularity, roundness and the ratio of height/width were quantified to characterize mitochondrial shape. The surface area of each crista was measured, and the total cristae surface area per mitochondrion was calculated as the sum of the individual cristae areas. Cristae volume density was estimated by dividing the total cristae surface area by the corresponding mitochondrial area. Matrix volume density was subsequently derived by subtracting the cristae volume density from 100%.
Statistical analysis
We used GraphPad Prism software (v10.3.1) for all statistical analysis. To determine if our data were normally distributed, we used the Shapiro–Wilk and D’Agostino–Pearson omnibus tests. For in vivo experiments, we utilized Grubb’s method (extreme Studentized deviate (ESD) to detect one outlier and robust outlier detection (ROUT) to detect multiple outliers) to expose any significant outliers (P < 0.05) in our data. If outliers were detected, they were removed subsequent statistical analysis. For all our data we present it as the mean ± s.e.m. and applied two-tailed tests for all comparisons. When analysing two discrete groups (such as Mct1fl/fl versus Mct1iCKO), we used an unpaired Student’s t-test for normally distributed data, if the data were non-parametric, we used the Mann–Whitney U test. Multiple comparisons correction for unpaired t-tests was performed using the Holm–Sídák method for adjusted P values. For datasets with more than two variables one and two-way ANOVA was used with Tukey’s multiple comparison test. For evaluating serial echocardiographic data and multiple group comparisons, we used a repeated measures ANOVA (mixed-effects model) with a Geisser–Greenhouse correction, followed by a Tukey’s multiple comparison test for individual comparisons. We set an α level of P < 0.05 a priori and any value below this setpoint was considered statistically significant.
Ethics statement
Animal experiments were conducted in accordance with the institutional guidelines for the care and use of laboratory animals. Our protocols were reviewed and approved by the Institutional Animal Care and Use Committee (IACUC) are the University of Utah (21-02003). For experiments involving the use of human myocardial tissue, our ethical approval was obtained from the Institutional Review Board (IRB) at the University of Utah (00030622) and all patients provided written informed consent prior to their inclusion in the study.
Reporting summary
Further information on research design is available in the Nature Portfolio Reporting Summary linked to this article.