
Abstract
Temporary foreign workers (TFWs) are playing an increasingly important role in addressing labour shortages in Canada’s health care sector. This study uses an integrated longitudinal administrative database and examines the number and characteristics of TFWs employed in the health care sector since 2000. It also tracks their transition to permanent residency (PR) and analyzes the percentage of individuals who remain in the sector after gaining PR.
The number of TFWs in the health care sector grew significantly from 3,200 in 2000 to 57,500 in 2022. In the early 2000s, most TFWs held health-occupation-specific work permits and were primarily employed in ambulatory health care services or hospitals. Since 2010, other work permit holders (with non-health occupations or open work permits) have become more prevalent among TFWs in the health care sector, with a growing share employed in nursing and residential care facilities. Since 2017, India has surpassed the Philippines as the top source country for TFWs in the health care sector. Additionally, TFWs have become more concentrated in Ontario, British Columbia and Quebec.
More recent TFW cohorts have shown higher rates of transition to PR. Five years after starting work in the health care sector, 54.5% of the 2000-to-2004 cohort obtained PR, compared with 59.6% of the 2010-to-2014 cohort. One year after transitioning to PR, nearly two-thirds of TFWs remained working in the health care sector. Moreover, industrial retention rates were higher among those who previously held health-occupation-specific work permits compared with other permit holders.
Authors
Yuqian Lu and Feng Hou are with the Economic and Social Analysis and Modelling Division, Analytical Studies and Modelling Branch, at Statistics Canada.
Acknowledgments
The authors would like to thank Huda Masoud, Katie Scrim, Heejae Yang and Marc Frenette for their advice and comments on an earlier version of this paper.
Introduction
Canada’s health care system has long faced challenges in maintaining adequate staffing levels to meet the growing demand for health care services, and the issues have intensified since the onset of the COVID-19 pandemic in 2020. According to the Job Vacancy and Wage Survey, in the fourth quarter of 2024, the job vacancy rate was 5.6% in hospitals and 5.0% in nursing and residential care facilities, compared with the all-industries average rate of 2.9% (Statistics Canada, 2024a). Moreover, 19% of the employees in health occupations (except management) worked overtime in 2024, and the share was particularly high among nursing and allied health professionals, at 25% (Statistics Canada, 2024b).
To address the labour shortage in the health care sector, the Canadian government has been actively recruiting internationally trained health care workers. Recent measures include new dedicated streams under the Economic Mobility Pathways Pilot, an invitation round for health workers to apply for permanent residency (PR) and a temporary public policy to facilitate the issuance of permanent resident visas for physicians (Government of Canada, 2023). The government’s 2025-2027 Immigration Levels Plan also gives priority to temporary and permanent residents with health care credentials and experience (Government of Canada, 2024b).
In addition to granting immigration priority to foreign health workers, temporary work permit programs and other temporary resident programs have played an increasingly important role in addressing labour shortages in health care, although the presence of temporary foreign workers (TFWs) in this sector was relatively smaller than in some other industrial sectors (Lu & Hou, 2023). Not only did TFWs temporarily fill labour gaps to reduce the burden on overworked domestic health care staff, but many of them also subsequently applied for PR. Accordingly, TFWs can contribute to the Canadian health care workforce in the long term, helping to ensure smoother operation of the health care system.
Leveraging integrated administrative data from the Non-permanent Resident File and the Longitudinal Worker File, this study focuses on TFWs who worked in the health care sectorNote in Canada. TFWs in this study are defined as people from outside Canada who held valid temporary residence status and earned paid income in the health care sector in Canada.Note
This study first examines the number and characteristics of TFWs who worked in the health care sector from 2000 to 2022. The analysis further tracks TFWs’ rates of transition to PR and the percentage of individuals who remain in the health care sector after gaining PR. In doing so, the study considers variations by permit type, province of work and source country. Understanding these dynamics can inform policies and strategies to address labour market needs effectively.
The number of temporary foreign workers in the health care sector increased significantly during the COVID-19 pandemic
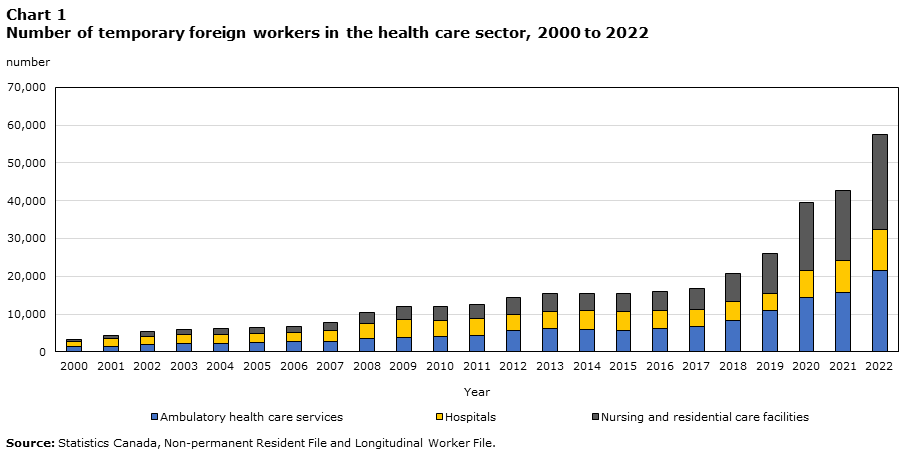
The number of TFWs in the health care sector grew significantly from 2000 to 2022. In 2000, 3,200 TFWs were working in the health care sector. By 2022, the latest year for which data are available, this number was 17 times larger, at 57,500 (Chart 1).
Growth among TFWs in this sector accelerated in the years just before the pandemic. The onset of the pandemic further accelerated the growth rate, and the number of TFWs in the health care sector increased by 50%—from 26,100 workers in 2019 to 39,300 in 2020.
Data table for Chart 1
Data table for Chart 1
Table summary
The information is grouped by Year (appearing as row headers), Ambulatory health care services, Hospitals, Nursing and residential care facilities and Total, calculated using number units of measure (appearing as column headers).
Year
Ambulatory health care services
Hospitals
Nursing and residential care facilities
Total
number
Note: Numbers are rounded to the nearest 100.
Source: Statistics Canada, Non-permanent Resident File and Longitudinal Worker File.
2000
1,300
1,300
700
3,200
2001
1,500
1,900
900
4,400
2002
1,800
2,300
1,200
5,400
2003
2,100
2,500
1,400
6,000
2004
2,300
2,400
1,500
6,200
2005
2,400
2,400
1,600
6,300
2006
2,600
2,500
1,600
6,700
2007
2,800
2,900
2,100
7,800
2008
3,400
4,100
2,800
10,300
2009
3,900
4,700
3,500
12,100
2010
4,100
4,200
3,600
11,900
2011
4,400
4,400
3,800
12,600
2012
5,700
4,300
4,400
14,400
2013
6,100
4,600
4,800
15,500
2014
6,000
4,800
4,700
15,500
2015
5,700
5,000
4,700
15,400
2016
6,200
4,700
5,100
16,000
2017
6,600
4,600
5,600
16,800
2018
8,400
4,800
7,400
20,500
2019
10,800
4,700
10,600
26,100
2020
14,300
7,200
17,900
39,300
2021
15,800
8,300
18,600
42,700
2022
21,600
10,900
24,900
57,500
Since the late 2000s, trends have diverged among the three subsectors. The number of TFWs working in hospitals remained steady, fluctuating from 4,000 to 5,000 until 2019, before rising sharply by 50% to above 7,000 in 2020 as the COVID-19 pandemic affected the country. By contrast, the number of TFWs in ambulatory health care services and in nursing and residential care facilities rose continuously throughout the 2010s, with sharp increases after 2019.
In 2022, TFWs represented 3.0% of the total workforce in ambulatory health care services, 1.2% of the workforce in hospitals, and 4.9% of the workforce in nursing and residential care facilities. Moreover, TFWs had a larger presence in some industry groups, such as home health care services (an industry group of ambulatory health care services), where their proportion reached 7.9%.
Major programs to recruit temporary foreign workers in the health care sector shifted over time
Temporary residents usually need a work permit to work in Canada. There are two different work permit programs: the Temporary Foreign Worker Program (TFWP) and the International Mobility Program (IMP). The former is designed to address temporary labour shortages that cannot be filled by qualified Canadians, while the latter focuses on meeting the country’s broad socioeconomic needs and interests. All work permits issued under the TFWP are employer-specific, while those under the IMP are either open or employer-specific. For more information, see Work in Canada temporarily.
In addition, international students can work without a work permit under some circumstances. For example, international students enrolled full time at a designated learning institution for a postsecondary program that lasts at least six months can work off campus without a work permit. For more information, see Work off campus as an international student.
Among TFWs employed in the health care sector, common TFWP health occupations include registered nurses; physicians; and nurse aides, orderlies and patient service associates. Furthermore, some TFWP permit holders working in the health care sector were non-health professionals, such as home child care providers.
By contrast, many IMP permit holders working in the health care sector held open work permits issued to, for example, eligible international students (during study and after graduation), refugee claimants or participants under reciprocal youth exchange arrangements.
According to the type of permits they held during the year, TFWs in the health care sector can be broadly classified into six mutually exclusive groups: (1) health-occupation-specific TFWP worker permit holders, (2) other occupation-specific TFWP work permit holders, (3) health-occupation-specific IMP work permit holders, (4) IMP work permit holders with non-health or unspecified occupations (open work permit), (5) study permit holdersNote and (6) other temporary residents.
Data table for Chart 2
Data table for Chart 2
Table summary
The information is grouped by Year (appearing as row headers), Temporary Foreign Worker Program, health occupations, Temporary Foreign Worker Program, other , International Mobility Program, health occupations, International Mobility Program, other, Study permit holders without a work permit and Other temporary residents, calculated using number units of measure (appearing as column headers).
Year
Temporary Foreign Worker Program, health occupations
Temporary Foreign Worker Program, other
International Mobility Program, health occupations
International Mobility Program, other
Study permit holders without a work permit
Other temporary residents
number
Note: Numbers are rounded to the nearest 100.
Source: Statistics Canada, Non-permanent Resident File and Longitudinal Worker File.
2000
900
700
200
1,200
200
100
2001
1,400
900
200
1,600
200
100
2002
1,800
900
200
2,200
200
100
2003
1,900
800
300
2,700
200
100
2004
1,800
1,000
200
3,000
200
100
2005
1,700
1,000
200
3,100
200
100
2006
1,600
1,100
300
3,400
200
100
2007
1,800
1,500
300
3,900
100
100
2008
3,000
1,800
300
4,900
100
100
2009
3,800
2,000
300
5,800
100
100
2010
3,400
1,800
300
6,300
100
100
2011
2,400
1,700
700
7,600
100
100
2012
1,700
3,200
1,000
8,400
100
100
2013
1,500
2,900
1,100
9,700
100
100
2014
1,400
2,200
1,100
10,400
400
100
2015
1,100
1,500
1,300
10,100
1,200
100
2016
800
1,300
1,300
11,000
1,400
100
2017
500
1,000
1,300
12,000
1,900
100
2018
400
700
1,200
15,400
2,700
100
2019
500
700
1,400
19,900
3,500
100
2020
800
800
1,800
30,800
5,100
100
2021
1,300
700
1,600
32,800
6,100
200
2022
2,100
900
1,900
42,000
10,400
200
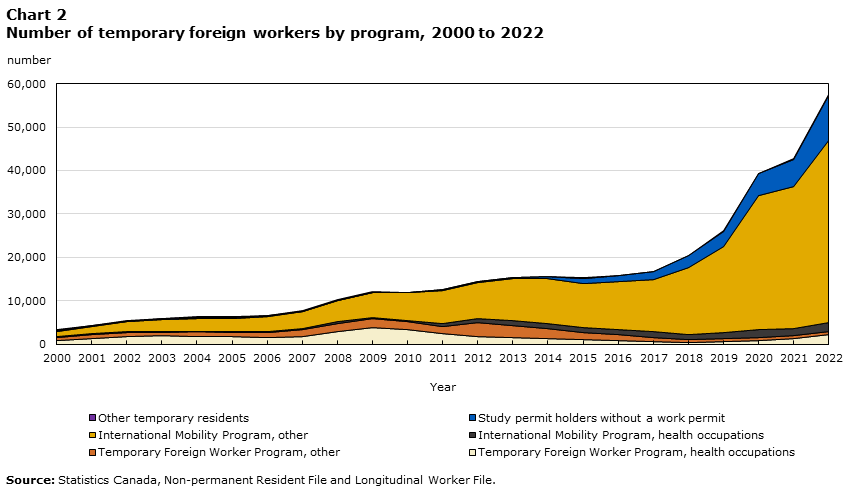
As Chart 2 shows, the overall growth in TFWs working in the health care sector was largely driven by IMP work permit holders whose permits were not designated for health occupations. Estimates from the 2021 Census suggest that around 60% of TFWs in the health care sector worked in health occupations, implying that many open work permit holders worked in health occupations.
The program composition of TFWs varied across the three health care subsectors. In the 2000s, the majority of TFWs working in hospitals held health-occupation-specific work permits, but their share declined rapidly over the next decade. By 2022, health-occupation-specific work permit holders accounted for 16% of the TFWs working in hospitals. By contrast, the majority of the TFW workforce in ambulatory health care services and in nursing and residential care facilities did not have health-occupation-specific work permits, especially the latter, where those without health-occupation-specific work permits accounted for 80% or more of TFWs in nearly all the years examined.
Temporary foreign workers represented an increasing share of the health care sector in all provinces
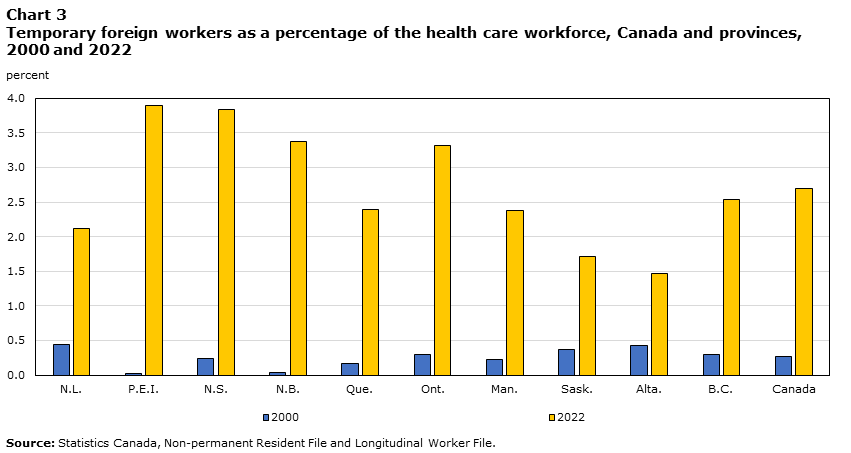
In 2022, four provinces had a higher share of TFWs in the health care sector than the national average (2.7%): Prince Edward Island (3.9%), Nova Scotia (3.8%), New Brunswick (3.4%) and Ontario (3.3%). The share of TFWs in the health care sector was relatively low in Saskatchewan (1.7%) and Alberta (1.5%) (Chart 3).
Data table for Chart 3
Data table for Chart 3
Table summary
This table displays the results of Data table for Chart 3 2000 and 2022, calculated using percent units of measure (appearing as column headers).
2000
2022
percent
Source: Statistics Canada, Non-permanent Resident File and Longitudinal Worker File.
Newfoundland and Labrador
0.4
2.1
Prince Edward Island
0.0
3.9
Nova Scotia
0.2
3.8
New Brunswick
0.0
3.4
Quebec
0.2
2.4
Ontario
0.3
3.3
Manitoba
0.2
2.4
Saskatchewan
0.4
1.7
Alberta
0.4
1.5
British Columbia
0.3
2.5
Canada
0.3
2.7
While the TFW population in the health care sector grew significantly in all provinces since the new millennium, the geographical distribution became more concentrated. In 2000, 39% of TFWs in the health care sector were employed in Ontario, 13% in Alberta, 15% in Quebec, 16% in British Columbia and the remaining 17% were distributed across other regions. In 2022, 43% of TFWs in the sector worked in Ontario, 26% in Quebec and 13% in British Columbia. Meanwhile, the share of TFWs in Alberta dropped sharply over the years, accounting for 4% of TFWs working in the health care sector nationwide.
In terms of subsectors, in 2022, 76% of TFWs in nursing and residential care facilities, 84% in ambulatory health care services, and 93% in hospitals were employed in Canada’s three largest provinces: Quebec, Ontario and British Columbia. Moreover, 52% of TFWs employed in ambulatory health care services were in Ontario. By contrast, 46% of TFWs employed in hospitals were in Quebec.
The source country composition of temporary foreign workers has changed considerably since 2000
In 2000, 59% of TFWs in the health care sector came from 10 countries,Note with the largest source being the Philippines (15%). Over the following two decades, the composition of the top source countries changed.
The number of Filipino workers increased rapidly from around 500 in 2000 to over 4,000 in 2012 and 2013, making up 32% of total TFWs. Notably, 46% of TFWs in ambulatory health care services were from the Philippines during those years. The number of Filipino health workers declined markedly afterwards but rebounded during the pandemic, reaching 6,100 in 2022.
In the 2000s, workers from India represented about 3% to 4% of TFWs. During the next decade, however, their number increased more than tenfold and surpassed that of Filipino workers in 2017. In 2022, there were close to 15,000 Indian workers employed in the health care sector, accounting for 32% of TFWs in ambulatory health care services, 14% of those in hospitals, and 25% of those in nursing and residential care facilities.
The majority of temporary foreign workers in the health care sector have transitioned to permanent residency
By 2023, 58% of TFWs who worked in the health care sector from 2000 to 2022 had obtained PR in Canada. TFWs from developing countries generally had higher PR transition rates than those from other regions. For example, 77% of Filipino workers and 57% of Indian workers had obtained PR status by 2023, compared with 43% of French workers.
Among new TFWs (defined as being employed in Canada for the first time) over the study period, more than one-quarter transitioned to PR within two years after their first employment in the health care sector (Table 1).
The cumulative rate of transition to PR increased for more recent cohorts. For example, 63% of new TFWs who worked in the health care sector from 2000 to 2004 became permanent residents within 15 years after their first job, while the same transition rate was achieved within 7 years for those who entered from 2005 to 2014.
Table 1
Cumulative rate of transition to permanent residency among new temporary foreign workers in the health care sector by arrival cohort
Table summary
The information is grouped by Year since first employment (appearing as row headers), 2000 to 2004, 2005 to 2009, 2010 to 2014, 2015 to 2019 and 2020 to 2021, calculated using percent, and number units of measure (appearing as column headers).
Year since first employment
2000 to 2004
2005 to 2009
2010 to 2014
2015 to 2019
2020 to 2021
percent
Note ..
not available for a specific reference period
Source: Statistics Canada, Non-permanent Resident File and Longitudinal Worker File.
1
12.5
12.6
9.7
9.0
10.7
2
27.0
29.5
25.7
25.6
26.9
3
40.5
44.8
42.8
45.1
.. not available for a specific reference period
4
49.3
53.9
53.6
58.4
.. not available for a specific reference period
5
54.5
59.7
59.6
.. not available for a specific reference period
.. not available for a specific reference period
6
57.3
63.8
62.6
.. not available for a specific reference period
.. not available for a specific reference period
7
59.0
66.4
64.7
.. not available for a specific reference period
.. not available for a specific reference period
8
60.1
67.8
65.8
.. not available for a specific reference period
.. not available for a specific reference period
9
60.8
68.7
66.4
.. not available for a specific reference period
.. not available for a specific reference period
10
61.4
69.2
.. not available for a specific reference period
.. not available for a specific reference period
.. not available for a specific reference period
11
61.9
69.5
.. not available for a specific reference period
.. not available for a specific reference period
.. not available for a specific reference period
12
62.3
69.7
.. not available for a specific reference period
.. not available for a specific reference period
.. not available for a specific reference period
13
62.5
69.8
.. not available for a specific reference period
.. not available for a specific reference period
.. not available for a specific reference period
14
62.7
69.9
.. not available for a specific reference period
.. not available for a specific reference period
.. not available for a specific reference period
15
63.0
.. not available for a specific reference period
.. not available for a specific reference period
.. not available for a specific reference period
.. not available for a specific reference period
number
person count
9,100
13,900
15,000
23,400
17,700
Characteristics of permanent residents who previously worked in the health care sector before their transition to permanent residency
Among 105,000 TFWs who worked in the health care sector and became Canadian permanent residents from 2005 to 2023,Note about three-quarters were female workers. Their average age decreased from 36.9 years in the 2005-to-2009 transition cohort to 33.3 years for those who obtained PR from 2020 to 2021.
While the majority of TFWs obtained PR through economic classes, the most popular streams changed over time. The Provincial Nominee Program and Canadian Experience Class were two of the major economic programs through which TFWs in the health care sector obtained PR over the period. In addition, from 2005 to 2019, about one-quarter of the TFWs received PR under the Live-in Caregiver Program, though the importance of this program diminished afterwards. Furthermore, 27% of the TFWs who landed in 2022 and 2023 did so under the Temporary Resident to Permanent Resident Pathway program—a limited-time policy that took effect in May 2021 and ended in November 2021 (Government of Canada, 2022).
The top two source countries for TFWs in the health care sector—the Philippines and India—also provided the majority of permanent residents over the 2005-to-2023 period. Filipinos accounted for more than 30% of the TFWs who received PR from 2005 to 2014, while over one-quarter of those who transitioned to PR from 2020 to 2023 were Indian.
Table 2
Characteristics at landing among former temporary foreign workers in the health care sector
Table summary
This table displays the results of Characteristics at landing among former temporary foreign workers in the health care sector Landing cohort, 2005 to 2009, 2010 to 2014, 2015 to 2019, 2020 to 2021 and 2022 to 2023, calculated using count, , years, and percent units of measure (appearing as column headers).
Landing cohort
2005 to 2009
2010 to 2014
2015 to 2019
2020 to 2021
2022 to 2023
count
Note: All former temporary foreign workers worked in the health care sector from 2000 to 2022 and landed from 2005 to 2023.
Source: Statistics Canada, Non-permanent Resident File and Longitudinal Worker File.
Person count
10,800
19,100
27,800
19,700
27,300
years
Average age at immigration
36.9
36.5
35.5
33.3
33.9
percent
Share of female workers
75.1
76.1
75.0
73.7
72.1
Immigration class
Economic class
68.6
75.2
78.8
69.9
72.3
Canadian Experience Class
0.7
10.6
18.7
33.6
10.8
Live-in Caregiver Program
26.4
26.3
23.5
0.6
0.5
Provincial Nominee Program
16.4
24.2
21.3
14.1
15.8
Temporary Resident to Permanent Resident Pathway
… not applicable
… not applicable
… not applicable
… not applicable
26.9
Other economic classes
25.1
14.2
15.4
21.7
18.3
Family class
13.0
9.1
12.2
7.7
7.4
Refugees
12.4
10.9
5.1
10.3
10.2
Other classes
6.1
4.8
3.8
12.2
10.1
Intended occupation at landing
Health occupations
23.2
26.1
18.4
19.3
19.8
Other occupations
76.8
73.9
81.6
80.7
80.2
Source region (country of birth)
North, South and Central America
14.2
15.5
11.7
12.9
13.4
Haiti
1.3
6.2
2.7
3.9
4.6
Europe
14.4
11.9
12.6
9.7
8.1
France
3.0
3.2
4.5
4.5
5.0
Africa
22.7
16.0
15.3
27.3
28.5
Nigeria
4.1
3.8
5.4
14.5
10.6
Asia
47.1
55.3
59.2
49.2
49.5
China
3.4
4.1
5.4
4.8
2.8
Philippines
30.2
36.0
28.1
7.2
9.3
India
3.6
7.1
16.9
27.0
27.5
Oceania
1.6
1.3
1.3
0.9
0.4
Most temporary foreign workers with health-occupation-specific work permits stayed in the same sector after their transition to permanent residency
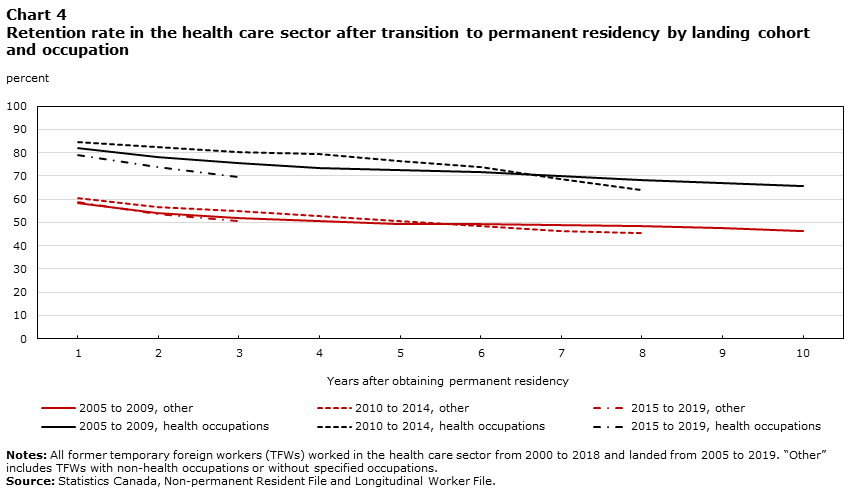
About two-thirds of the TFWs who worked in health care stayed in the sector one year after obtaining PR, and this retention rate remained at above half five years later. However, the industry retention rate varied across program types. As shown in Chart 4, TFWs holding health-occupation-specific work permits had a high industrial retention rate. One year after gaining PR, at least 80% of them remained in the health care sector. The rate was still above 75% by the 5th year (2010-to-2014 cohort) and remained around 65% by the 10th year (2005-to-2009 cohort) after obtaining PR.
By contrast, TFWs in the health care sector from other temporary resident programs had relatively lower industrial retention rates after their PR transition. One year after their transition, about 60% stayed in the health care sector, and the rate was less than 50% five years later.
Among those who left the health care sector after gaining PR, some may have moved to other industries or exited the labour market. The data used in this study lack sufficient labour force information, such as the specific occupation or wage rate, to better understand employment dynamics.
Data table for Chart 4
Data table for Chart 4
Table summary
The information is grouped by Years after obtaining permanent residency (appearing as row headers), Landing cohort and occupation, 2005 to 2009, other, 2010 to 2014, other, 2015 to 2019, other, 2005 to 2009, health occupations, 2010 to 2014, health occupations and 2015 to 2019, health occupations, calculated using percent units of measure (appearing as column headers).
Years after obtaining permanent residency
Landing cohort and occupation
2005 to 2009, other
2010 to 2014, other
2015 to 2019, other
2005 to 2009, health occupations
2010 to 2014, health occupations
2015 to 2019, health occupations
percent
Note †
not available for cohort
Notes: All former temporary foreign workers (TFWs) worked in the health care sector from 2000 to 2018 and landed from 2005 to 2019. “Other” includes TFWs with non-health occupations or without specified occupations.
Source: Statistics Canada, Non-permanent Resident File and Longitudinal Worker File.
1
58.5
60.5
58.6
81.8
84.7
79.0
2
54.1
56.6
53.5
78.3
82.3
73.7
3
51.9
54.9
50.5
75.5
80.2
69.6
4
50.6
52.9
† not available for cohort
73.5
79.6
† not available for cohort
5
49.3
50.4
† not available for cohort
72.3
76.6
† not available for cohort
6
49.2
48.4
† not available for cohort
71.7
73.7
† not available for cohort
7
49.0
46.3
† not available for cohort
69.8
68.7
† not available for cohort
8
48.3
45.3
† not available for cohort
68.1
64.0
† not available for cohort
9
47.8
† not available for cohort
† not available for cohort
67.0
† not available for cohort
† not available for cohort
10
46.3
† not available for cohort
† not available for cohort
65.5
† not available for cohort
† not available for cohort
Summary
Using an integrated administrative database, this study examines the number of TFWs who worked in Canada’s health care sector from 2000 to 2022, their distribution by permit type, their transition to PR and their retention in the sector.
The number of TFWs working in the health care sector has increased considerably since the new millennium, from 3,200 in 2000 to 57,500 in 2022. The composition of program types among TFWs in the health care sector has also changed over time. In the early 2000s, most TFWs held health-occupation-specific work permits, but other IMP work permit holders have become more prominent over time. In addition, TFWs’ distribution across health care subsectors also shifted over time. In the 2000s, nearly 40% of TFWs in the health care sector were in hospitals, but since 2019, more than 40% of TFWs have been employed in nursing and residential care facilities.
It is important to note that some TFWs without a health-occupation-specific work permit may work in health occupations. Furthermore, not all TFWs in the health care sector worked in health occupations. Therefore, restricting the analysis to work permit holders with specified health occupations would underestimate the overall impact of TFWs on the health care sector.
TFWs from India have gradually replaced Filipino workers as the largest foreign workforce in Canada’s health care sector, and the role of some traditional source countries has diminished. Meanwhile, the geographic concentration of TFWs in health care became more pronounced over time, with the majority located in the largest provinces: Ontario, British Columbia and Quebec.
The long-term viability of TFWs as a stable labour source depends on two factors: the number of workers who transition to PR and the percentage of those who continue to work in the sector after obtaining PR. This study found that recent TFW cohorts had higher rates of transition to PR compared with earlier cohorts, whereas recent PR policy changes may have had a positive impact on the transition rate. After transitioning to PR, TFWs holding health-occupation-specific work permits had higher industry retention rates in the sector than those who did not have health-occupation-specific work permits.
Data
The data on temporary residents are obtained from the Non-permanent Resident File, which contains information on all temporary residents who received a temporary permit (excluding visitor permits) to enter Canada from 1980 to 2023. Employment information is obtained by linking this file with the Longitudinal Worker File, which currently has individual records from the T1 and T4 administrative files up to 2022.
References
Government of Canada. (2022). Temporary public policies: Temporary Resident to Permanent Resident Pathway. Accessed October 8, 2024.
Government of Canada. (2023). Canada announces new immigration stream specific to health workers
Government of Canada. (2024a). Immigration matters in health care
Government of Canada. (2024b). 2025–2027 Immigration Levels Plan
Lu, Y. & Hou, F. (2023). Foreign workers in Canada: Distribution of paid employment by industry. Economic and Social Reports 3(12), 1-7.
Statistics Canada. (2024a). Table 14-10-0442-01 Job vacancies, payroll employees, job vacancy rate, and average offered hourly wage by industry sub-sector, quarterly, unadjusted for seasonality
Statistics Canada. (2024b). Table 14-10-0412-01 Employees working overtime (weekly) by occupation, annual