“The climate system is an angry beast and we are poking it with sticks.” — Dr. Wallace Broecker
Fossil fuel pollution is overheating Canadian forests, spawning an out-of-control wildfire crisis. Wildfire is now incinerating four times more forest carbon than during the 1990s. In addition to the surging immediate threats of choking smoke, wanton destruction and disrupted lives, rising wildfire is also pumping billions of tonnes of forest carbon into our atmosphere, intensifying long-term climate breakdown.
This accelerating new source of CO2 is adding to the already massive and growing emissions of CO2 caused by humans burning fossil oil, gas and coal. CO2 is a powerful and extremely long-lived greenhouse gas. It is piling up in an ever-thickening blanket in our atmosphere that will overheat generations to come. The extra heat being trapped by humanity’s CO2 now equals the explosions of 400,000 Hiroshima atomic bombs every day. And rising.
Canada’s continent-spanning forest is especially vulnerable to this rising heat. Its billions of trees, spread across hundreds of millions of hectares, are overheating at two to three times the global pace. This is one of the planet’s largest terrestrial-carbon reservoirs. And the rapidly rising heat is cooking ever larger swaths of it into explosive tinderboxes. Wildfires have responded with increasing fury from coast to coast.
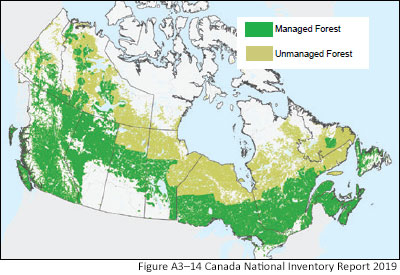
Note: Canada only reports forest carbon data for the part it “manages”. This is around two-thirds of its forested area, as shown on the map. The government’s most recent data covers 1990 to 2023. I’ve included my own wildfire estimates for 2024 and 2025 based on European satellite data.
An accelerating new source of CO2 is adding to the already massive and growing emissions of CO2 caused by humans burning fossil oil, gas and coal.
Let’s look at some charts.
The wildfire threat: four times more fire and rising
My first chart shows the dramatic increase in Canadian wildfire. The red bars show how much forest carbon has been burned by wildfires each year since 1990.
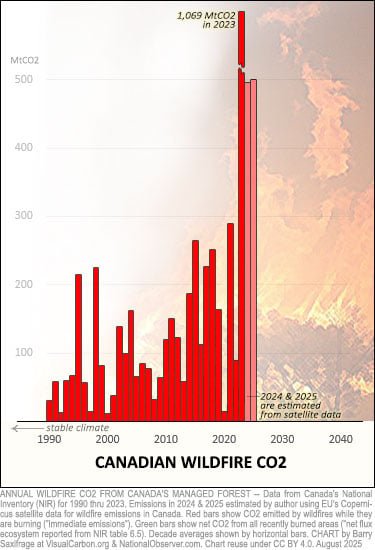
For example, the small bar on the far left shows that wildfires burned relatively little forest in 1990. Wildfire emissions totalled 30 million tonnes of CO2 (MtCO2) that year.
The much taller bar on the far right shows that this year’s wildfires have already burned massive amounts of forest. Emissions are around 500 MtCO2 so far, with many weeks of fire season still ahead.
The tallest bar on the chart shows the catastrophic wildfire year of 2023. Forest fires released more than a billion tonnes of CO2 that year. That’s literally off this chart. For perspective, there are 100 nations that combined emit less from fossil fuel burning each year. Canadian wildfires are becoming a globally significant new source of CO2.
In that chart of individual years you can see a dramatic surge in wildfire. But there is also a lot of short-term variability obscuring the underlying trend. To see the longer-term trend more clearly we can look at decade averages. I’ve added black horizontal lines showing these to the chart below.
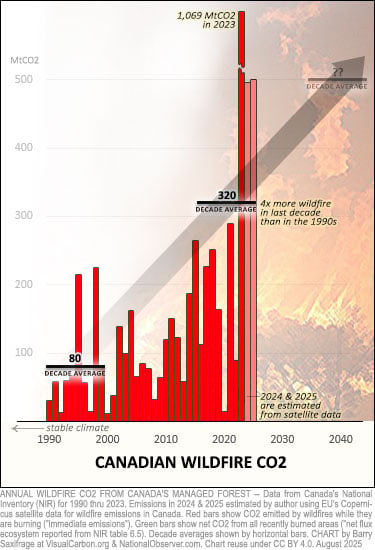
Let’s start with the 1990s. During that decade, wildfire emissions totalled 800 MtCO2. That’s an average of 80 MtCO2 per year. I’ve indicated this average with the black line in the lower left.
Compare that to the most recent decade (2016-2025). Over these 10 years, wildfires released four times more carbon than they did during the nineties – a total of 3,200 MtCO2. That works out to an average of 320 MtCO2 per year, as shown by the black bar in the center of the chart.
Our wildfire crisis is already at the point where our average year has become much worse than anything Canadians had to suffer through in the 1990s.
It is tempting to think that this current level of wildfire is our “new normal.” But it’s going to keep getting worse until we take our foot off the wildfire accelerator.
The science is clear that extreme fire weather conditions – heatwaves, droughts, wind and lightning – are growing ever more extreme as greenhouse gas levels in the atmosphere keep rising. And those levels will keep rising until we stop the primary source of them, fossil fuel burning.
As John Vaillant, Canadian author of the award-winning Fire Weather, The Making of a Beast, summarizes: “It ain’t rocket science — when it’s hotter and drier fires burn more easily and more explosively.”
Consider what it will look like if Canada’s wildfire trend continues. During the 2030s, our average wildfire year will be as bad as this year’s extreme coast-to-coast crisis. And what about another four-fold surge in Canadian wildfire? It is a hellish legacy we are leaving our kids, grandkids and future Canadian generations.
Burning fossil fuels burns Canada’s forests. Maybe we should stop and switch to safer energy sources.
The climate threat: a massive new CO2 source
So far, we’ve looked at the immediate impact of wildfires. That’s what most people focus on because of the immediate threats of burning homes, displaced lives and toxic smoke.
But wildfires also impact the climate system. And that climate impact unfolds over decades.
When an area of forest burns it typically emits CO2 for many years afterwards. That’s because wildfires only burn a small portion of the forest carbon, leaving a lot of newly dead branches and trunks in their wake. This big pulse of dead forest carbon creates a big increase in CO2 as it decays over the years and decades that follow.
At the same time, new growth in burned areas pulls CO2 out of the air, locking it away in new wood. This recaptures some of the CO2 emitted by the dead wood rotting next to it. It can take decades before new growth is big enough to pull in as much CO2 as the dead wood emits. When a burned area reaches that point, if it ever does, then the area switches from a CO2 source into a valuable CO2 sink.
Canada tracks the recovery of all recently burned forest areas in its managed forest. Each year it reports the net CO2 balance from all of these areas combined. I’ve added this yearly data to the chart below as green bars.
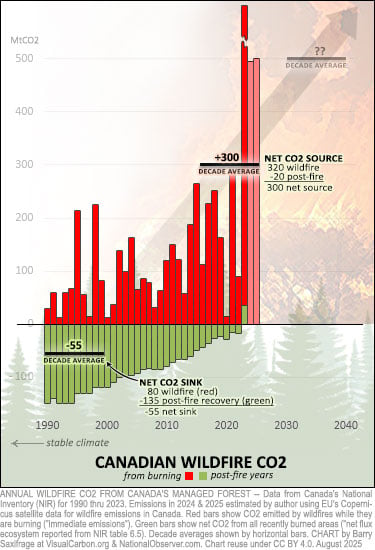
On the left, the green bars are long and pointing downward. That shows that burned areas acted as a big carbon sink back then. In fact, these were such a big carbon sink that they also recaptured all the additional CO2 emitted by new wildfires. And more.
For example, during the 1990s, the burned areas pulled 135 MtCO2 out of the atmosphere each year on average (green bars). In those same years, new wildfires emitted only 80 MtCO2 per year on average (red bars). Adding those together results in an overall carbon sink that averaged 55 MtCO2 per year during that decade. This is shown with a black line in the lower left.
Since then, burned areas have recaptured less and less CO2. That’s seen in the shrinking green bars. Those green bars have now shrunk to zero. The reason for this decline isn’t clear to me from the government’s reporting, but the trend certainly is.
During the previous decade, the combination of surging wildfire and struggling burned areas resulted in a massive CO2 source that averaged 300 MtCO2 per year. That’s the black line in the middle of the chart. This is a big new source of CO2 that didn’t exist before. These emissions now average more than all the emissions from Canadian cars, trucks, ships, planes, buildings and electricity generation — combined.
The big picture: wildfires plus logging overwhelm
Turbocharging wildfire isn’t the only way humans are draining carbon from Canada’s managed forest into the atmosphere. Logging still remains the largest source. But surging wildfires are starting to rival the impact from logging. Together these two forces have emitted 12 billion tonnes of forest CO2 since 1990. This has overwhelmed what new growth recaptured.
The oversized role of wildfire and logging is shown in my next chart.
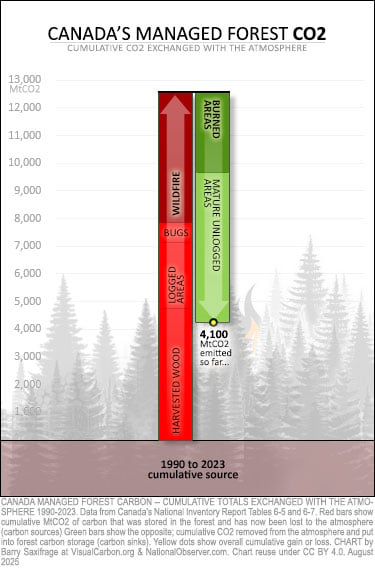
Canada breaks its forest carbon emissions into six main pieces. The bars on this chart show the cumulative emissions since 1990 for each.
Logging makes up two of those six pieces. These two are shown at the bottom of the red bar. The first is harvested wood, which has emitted around five billion tonnes of CO2 since 1990. The second is areas recovering from logging. These have emitted a couple billion more, bringing logging’s total to seven billion tonnes of CO2.
Wildfire is the dark red bar stacked on top of logging. Wildfires have emitted around five billion tonnes of CO2 since 1990. That’s now equal to harvested wood emissions. The dark green bar shows that areas recovering from wildfire have recaptured around half of that.
The remaining two bars are insect outbreaks and areas of mature unlogged forest. The red bar labelled “bugs” shows that these outbreaks have emitted around half a billion tonnes. The biggest green bar, labelled “mature unlogged areas”, shows that this is the forest’s major CO2 sink, removing more than five billion tonnes since 1990.
Overall, Canada’s managed forest has lost four billion tonnes of CO2 since 1990. All that CO2 was stored in the forest. Now it’s up in the atmosphere.
These forest carbon losses are new. During the 1990s, Canada’s managed forest was a small overall carbon sink. This is shown by the shorter bars I’ve added to the left of the chart.
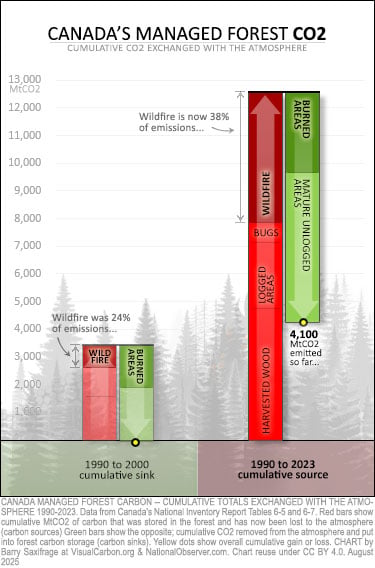
This comparison also lets you see the rising impact of wildfire.
Back in the 1990s, wildfires emitted one quarter of forest carbon emissions. That share had risen to more than a third by 2023. And we know from satellite data that this has jumped even higher with another billion tonnes of CO2 emitted in the last two years.
Another wildfire change shown on the chart is the amount of carbon recovered by burned areas.
Back in the 1990s, burned areas removed twice as much CO2 as wildfires emitted. But by 2023, cumulative removals from burned areas now cover only around half of what wildfires have emitted.
This one-two punch of more CO2 emitted by wildfire and less of it being removed by post-fire recovery is accelerating the climate impact. And, as we saw earlier, both of these trends are growing worse.
An accelerating threat
The huge scale of Canadian forest carbon emissions is a serious climate problem. The dizzying rate at which they are accelerating poses an even greater threat.
The soaring line on the next chart shows the same cumulative forest carbon emissions from all sources as in the last chart. But here you can see how they have built up over time.
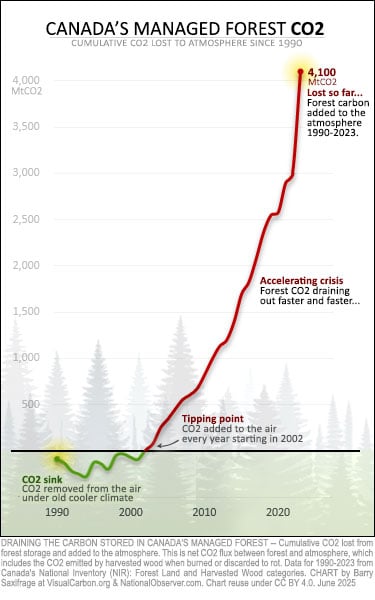
Notice that the line is green at the start. This indicates that Canada’s managed forest was a small overall CO2 sink during the 1990s.
But you can see signs of trouble emerging by the late 1990s as the green line stops falling and starts oscillating upwards. Years with annual CO2 losses start appearing between the years of annual CO2 gains.
The big tipping point was 2002. In that year, and every year since, Canada’s managed forest has lost carbon to the atmosphere. That’s 22 straight years of annual CO2 emissions. This clearly isn’t a problem caused by a few freak years. It’s an every-year crisis.
And the crisis is accelerating. You can see this in the way the line keeps curving steeper and steeper.
For example, it took nine years (from 2002 to 2011) for the first billion tonnes of CO2 to drain out of the forest. The next billion tonnes took six years. Then five years. And most recently just two years. This line ends in 2023, because that’s the end of the government data. But as mentioned earlier, satellites show that the wildfire component has emitted another billion tonnes since then. This rockets the line off the top of the chart.
This accelerating flood of CO2 pouring out of Canada’s managed forest now dwarfs the fossil fuel emissions of most nations.
The floodgates holding back one of Earth’s largest reservoirs of forest carbon are being cranked open by chainsaws and a fossil fuelled wildfire crisis. What started as a trickle of CO2 a couple of decades ago has turned into a surging flood pouring into our already destabilized atmosphere.
Take a look again at that skyrocketing CO2 line on the last chart. Does that look like a carbon-neutral forest to you? Not to me. That forest isn’t offsetting anything. It’s an out-of-control wildfire and climate threat that threatens to overwhelm us — and Canadian generations to come — if we don’t stop making it worse.
As an International Panel on Climate Change (IPCC) report highlights: “Every tonne of CO₂ emissions adds to global warming.” And once emitted, the extra heat is locked in. As the World Meteorological Organization warns: “the accumulation of CO2 in the atmosphere is irreversible on human timescales and will affect climate for millennia.”
What can we do?
Our peers have cut emissions. Canadians can too
Canada is one of the world’s all-time top-10 climate polluters. We’ve been promising to reduce our oversized climate impact for 36 years. But, as my last chart shows, Canada releases even more planet-heating gases now — 14 per cent more.
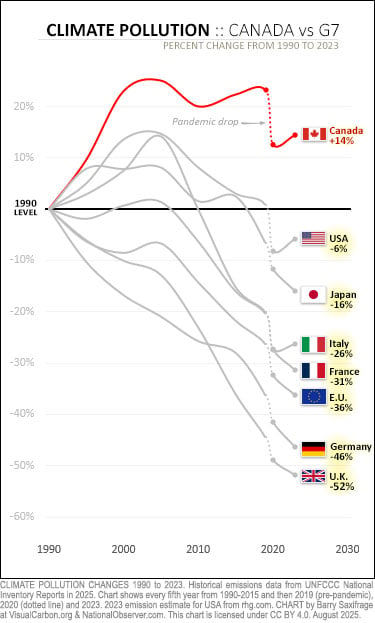
Fortunately, we can learn from our many peers who have reduced their emissions. In fact, every one of our peer nations in the Group of Seven (G7) advanced economies has reduced their climate-destabilizing emissions since 1990.
Collectively, these wealthy, industrialized nations emit one-third of global climate pollution and produce half the world’s GDP. These nations have the resources, talent and capacity to reduce their emissions.
Europeans have collectively reduced their climate pollution by 36 per cent since 1990. Germany and our Commonwealth peers in the United Kingdom have both cut emissions in half.
They did this using climate policies that reduced emissions across every sector in their economies. That’s what has to happen. But in Canada, we’ve allowed most of our sectors to increase emissions.
What this chart makes clear is that Canadians have plenty of proven, effective, peer-tested climate policies to choose from. Perhaps the single most effective climate policy I’ve ever come across is the U.K.’s landmark Climate Change Act of 2008. I’ve written about it many times over the years. Since they enacted that law, the British have reduced their emissions by 40 per cent.
Canadians have run out of excuses for our sky-high emissions. And now our exploding fossil-fuelled wildfire crisis means we are rapidly running out of time as well.
The climate beast is waking up. When will we?

