
One Global Service Provider, a microcap in healthcare services, has seen significant stock performance, with a notable increase over the past year and three years, outperforming the Sensex. Technical indicators present a mixed outlook, reflecting both bullish and bearish trends across different time frames.

One Global Service Provider, a microcap company in the healthcare services industry, has recently undergone an evaluation revision reflecting notable shifts in its technical indicators. The stock is currently priced at 285.00, up from a previous close of 274.75, with a 52-week high of 407.60 and a low of 134.25. Today’s trading saw a high of 297.00 and a low of 270.45.
The technical summary indicates a mixed performance across various metrics. The MACD shows a bullish trend on a weekly basis, while the monthly perspective remains mildly bearish. Bollinger Bands reflect bullish conditions for both weekly and monthly assessments. The moving averages present a mildly bearish outlook on a daily basis, contrasting with the weekly and monthly Dow Theory indicators, which are mildly bullish.
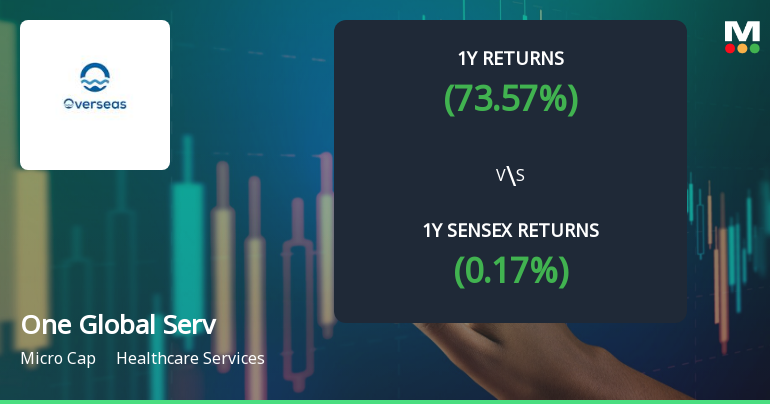
In terms of performance, One Global Service Provider has demonstrated significant returns over various periods. Over the past year, the stock has surged by 73.57%, vastly outperforming the Sensex, which recorded a mere 0.17% return. Over three years, the stock’s return stands at an impressive 834.43%, compared to the Sensex’s 40.53%. This trend highlights the company’s strong recovery and resilience in the healthcare sector, particularly when juxtaposed with broader market performance.