
A Muskoka grown mathematical model of primary care resources allocation
Muskoka, nestled in the vast lake region of the southern Canadian Shield, has been a longstanding cottage destination for urban inhabitants for over 100 years. As more people settle the endless miles of shoreline, upon pristine lakes surrounded by towering pines, the resources required to maintain the health of the growing population has also been growing. Sadly, the last decade has seen a rapid rise in the number of patients who are unattached to a family doctor or nurse practitioner, currently sitting at about one quarter of the population.
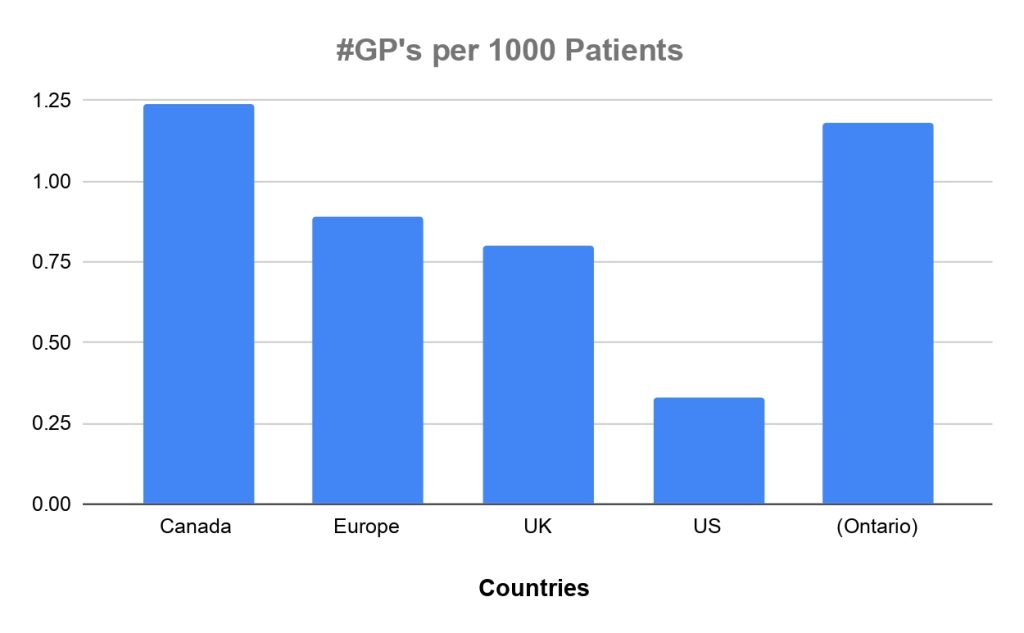
This issue is far from unique to Muskoka, as frustration echoes throughout communities across the country. Media headlines highlight the so-called “Doctor Shortage” as a root cause, while in reality, the patient to physician ratios are more favourable now than in decades before. Not only does Canada boast a significantly larger number of GP’s per 1000 patients than the US or EU, the actual number of patients per doctor has increased over the past 30 years (Annals of Family Medicine, May 2025).
Logically, if we truly have a healthy number of GP’s per capita in Muskoka, then why are so many patients without primary care? Perhaps if we examined the issue through the lens of mathematical modeling, we can better understand the true dynamic of this primary care resource shortage.
The HELP Formula, a concept developed in Muskoka, is a simple human resource modeling tool designed to address physician shortages in any global region, by utilizing pertinent mathematical variables that correlate with health care productivity.
Essentially, it equates the number of Patients (P) to the number of Health Providers (H). Moreover, it also factors in two very important, and often overlooked variables, Physician Efficiency (E) and Practice Work Load (L). This type of modeling is not unique to medicine, and shares features of other models in science and even economics. Take for instance “The Quantitative Theory of Money”, as envisioned by the likes of John Manard Keynes, that uses 4 key variables to quantify how prices correlate with money supply, in economic systems (MV=Py). In medical ecosystems, we can similarly correlate the number of patients that a given practitioner can manage by looking at efficiency and workload, just as the economic parallel computes quantity and velocity of money.
HELP Formula
H x E = L x P
H = # of Health Providers (GP, NP or AI)
E = Efficiency of Provider
L = Work Load per Patient
P = # of Patients per Provider
# Health Providers (H) – the number of primary care providers in a geography (GP, NP or AI).
Efficiency (E) – how effectively a provider can deploy quality care, ex. # evaluations per day.
Work Load (L) – average time spent on a patient. This includes high yield office bedside time, as well as lower yield paperwork time, frequently spent remotely from home. # Patients (P) – the number of patients a single provider can manage safely.
In underserviced communities, the immediate goal is to increase the number of Patients (P) by optimizing Efficiency (E) and minimizing Work Load (W), using some of the following mechanisms:
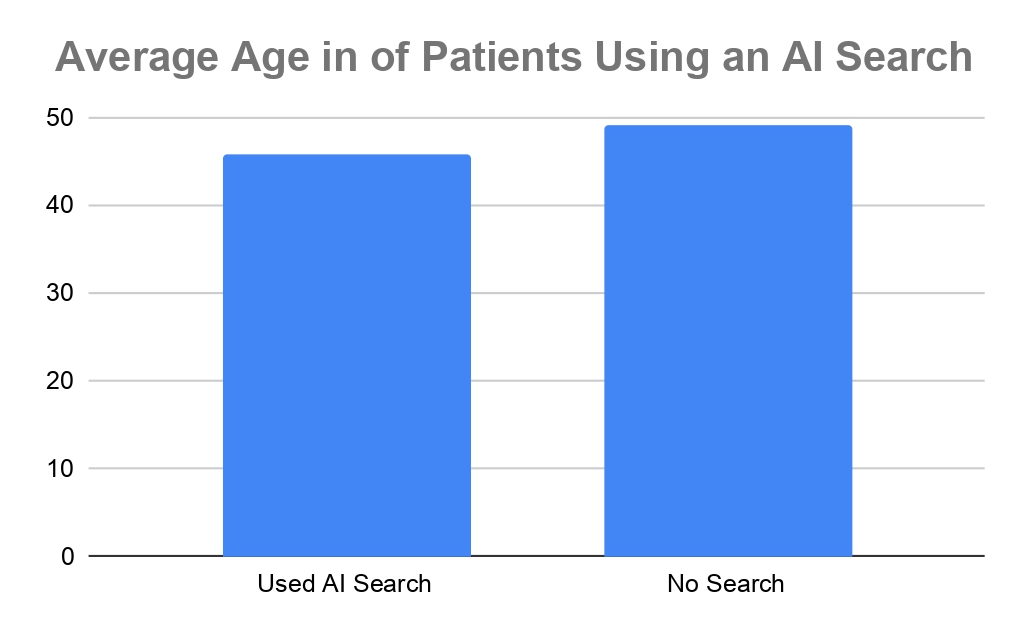
– Utilizing AI dictation systems, to optimize caregiver bedside time.
– Using online patient data, like eHealth Ontario, instead of faxing.
– Mitigate “Information Spamming” and send only relevant information to Primary Providers. – Avoid salarying providers, who become disincentivized to spend time at the clinical “bedside”. – Address the issue of physicians being coerced into unnecessary and harmful diagnostics.
A recent 2025 clinic based pilot survey was deployed in Muskoka by three students from the Royal College of Surgeons of Ireland, all born in Bracebridge, to better understand some of the local issues. The survey was randomly administered at the Bracebridge Medical Centre, to identify potential barriers to care.
Rural Ontario Access to Care
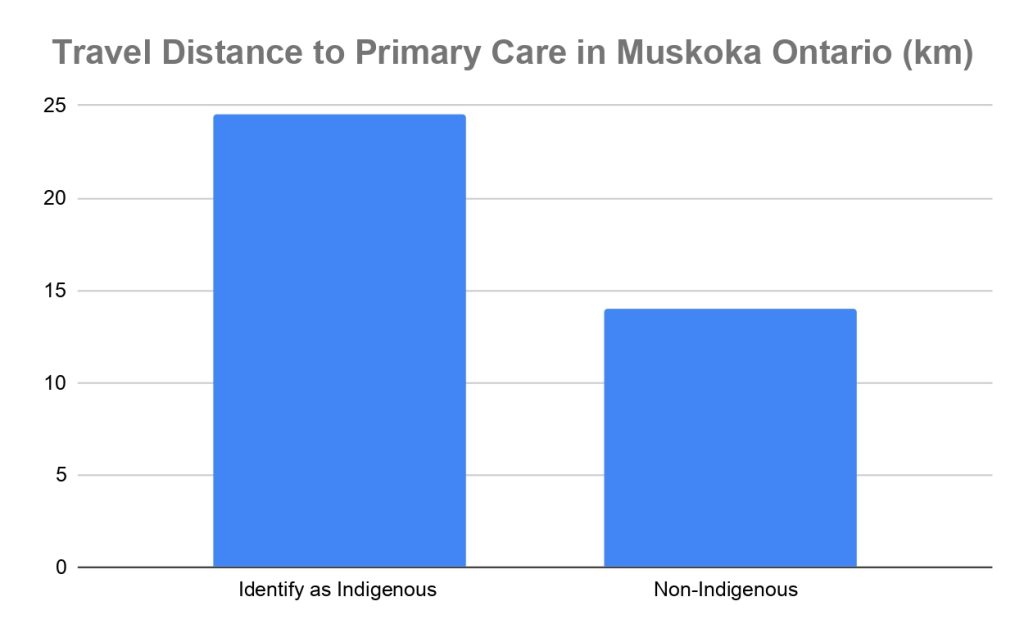
Unfortunately, this small survey suggested that Indigenous Canadians not only travel further for care, but a staggering 75% of those surveyed did not identify with having a regular primary care provider. Despite having more than 60 primary providers in the region, the permanent population of Muskoka continues to struggle with a staggering number of unattached patients. According to 2025 Muskoka data, from patient attachment action teams, the percentage of unattached patients stands at 24% for Gravenhurst, 27% in Bracebridge, and a staggering 30% in the town of Huntsville.
Despite the knee jerk reflex of policy makers to simply add more doctors, or throw more money at “pie in the sky” publicly funded projects, the reality remains that tax dollars can be better spent on simply doing more with what we already have. Fostering a culture that strives to improve services through technology and efficiency can improve the quantity and quality of care in a region, while being smart about how we deploy valuable public resources.
By Emir, Yasmine and Anisa Bawa and Dr. Faizal Bawa, MD CCFP, Asst Prof NOSM
Dr. Bawa’s research is based on work done at Dr. Bawa’s NOSM-affiliated GP teaching unit in Bracebridge. It was developed by Bawa and his children, all of whom were born and raised in Muskoka, and are currently medical students at the Royal College of Surgeons of Ireland, and have trained at Muskoka Algonquin Healthcare (MAHC).
Dr. Bawa has been practicing in Bracebridge for 27 years and holds privileges at MAHC, with a regular plus urgent care practice. He says the formula features a “Made in Muskoka” HR model that analyzes Primary Care resources, and can be extrapolated to any global geography.
Don’t miss out on Doppler!
Sign up here to receive our email digest with links to our most recent stories.
Local news in your inbox so you don’t miss anything!