

Composites construction
The schematic representation of bulk/interface by mutual diffusion of metal atoms to achieve FeSiAl:Sn/Al2O3 is depicted in Fig. 1a. In this process, SnO is generated by annealing SnCl2·2H2O in a nitrogen atmosphere on the surface of FeSiAl particles. This condition initiates a disproportionation reaction, yielding both SnO2 and metallic Sn29. Consequently, the Sn atoms diffuse inward and gradually substitute Al in the FeSiAl matrix30, while outward diffusion of Al atoms forming an Al-rich layer at the particle surface. As Al and SnO2 accumulate, an aluminothermic reaction is triggered, leading to the in-situ formation of an epitaxial Al2O3 insulating layer and thereby realizing the structure of FeSiAl:Sn/Al2O331,32,33. This Al2O3 insulating layer reduces inter-eddy loss attributed to electrical isolation between the FeSiAl particles (Fig. 1b). Furthermore, the substituting Sn heteroatoms can release lattice distortion during annealing treatment, resulting in reduced coercivity and mitigating hysteresis loss. Additionally, the Sn substitutions in the FeSiAl matrix enhance its electrical resistivity, contributing to a decrease in intra-eddy loss (Fig. 1c).
Fig. 1: Origination of FeSiAl:Sn/Al2O3 structure.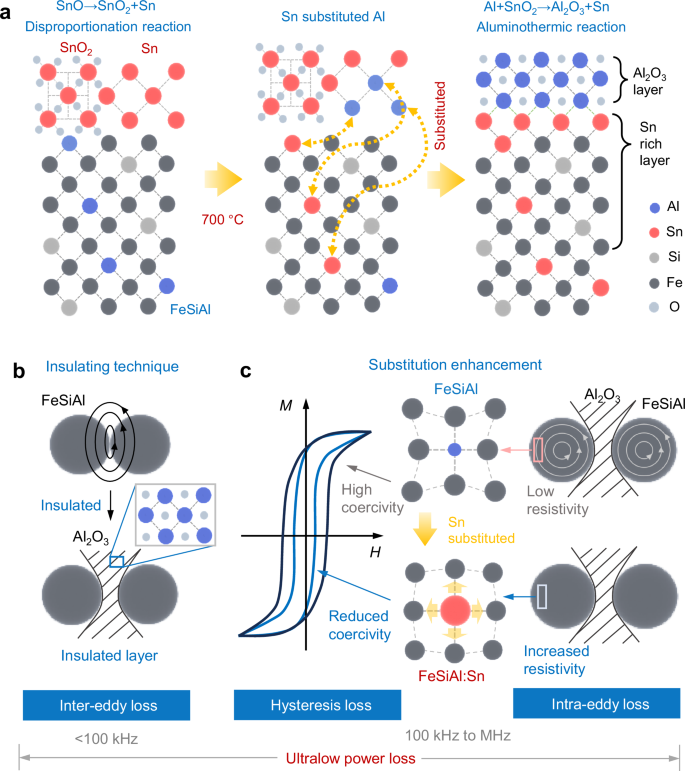
a Schematic diagram of the substitution of Sn and formation of Al2O3 by mutual diffusion. b, c Schematic representation of the power loss suppression mechanism in FeSiAl:Sn SMCs. Inter-eddy loss is effectively mitigated through the incorporation of an insulating Al2O3 layer (b). In parallel, hysteresis and intra-eddy losses are suppressed by substituting Sn for Al, which results in a reduction of coercivity and an increase in electrical resistivity (c).
To elucidate the underlying construction process, we employed a series of experimental characterizations and theoretical calculations. Initially, the occurrence of the disproportionation reaction was confirmed through X-ray diffraction (XRD), thermogravimetric analysis (TGA), and transmission electron microscopy (TEM) as depicted in Supplementary Fig. 1. The results indicate the formation of Sn and SnO2 following the annealing of SnCl2·2H2O. Subsequently, various substitution configurations were established: mono-substitution of Fe with Sn (Sn@Fe), Si with Sn (Sn@Si), and Al with Sn (Sn@Al), as well as bi-substitutions (2Sn@2Al) and tri-substitutions (3Sn@3Al). The most stable configurations of FeSiAl, Sn@Fe, Sn@Si, and Sn@Al are presented in Supplementary Fig. 2a. Notably, all formation energies for the Sn@Al configurations are found to be negative, in contrast to the positive formation energies of the other configurations (Supplementary Fig. 2b). This observation indicates that Al atoms exhibit a higher propensity for substitution by Sn atoms than Fe and Si atoms. Moreover, the formation energies of the 2Sn@2Al and 3Sn@3Al configurations were calculated at −0.017 eV and −0.025 eV, respectively, suggesting relatively low formation barriers for Sn substitution Al within the FeSiAl matrix.
In the context of the aluminothermic reaction, we examined variations in Gibbs free energy based on simulation models as illustrated in Supplementary Fig. 3a, b. Notably, the Gibbs free energy per unit of SnO2 is significantly higher than that of Al2O3 (Supplementary Fig. 3c). The Gibbs free energy decreases from −22.58 to −41.23 eV during the transformation from Al+SnO2 to Sn+Al2O3, providing strong support for the formation of Al2O3 and metallic Sn at the surface of FeSiAl through the aluminothermic reaction. To assess the phase composition of FeSiAl at various stages, we analyzed the XRD patterns of FeSiAl, annealed FeSiAl and FeSiAl:Sn particles as depicted in Supplementary Fig. 4a. Compared with FeSiAl, the annealed FeSiAl and FeSiAl:Sn samples reveal a complete DO3 phase (JCPDS: 451206)34, verified by electron backscatter diffraction (EBSD) results shown in Supplementary Fig. 4b, c. A right shift of the (220) peak to 44.963° in the annealed FeSiAl is observed ascribed to segregation of Al atoms in Supplementary Fig. 4d. However, the (220) peak has shifted back to 44.939° in the annealed FeSiAl:Sn, suggesting that lattice shrinkage is released due to the incorporation of Sn within the FeSiAl matrix. Furthermore, cross-sectional scanning electron microscopy (SEM) images, combined with energy dispersive spectroscopy (EDS) mapping of the FeSiAl:Sn SMC, provide additional insights into the heteroatom substitution and aluminothermic reaction (Supplementary Fig. 5). A distribution of Sn within the FeSiAl matrix and a distinct oxide layer on the FeSiAl particles are clearly detectable, indicating successful substitution and formation mechanisms.
Microstructure characterizations
To evaluate the microstructures of the FeSiAl:Sn/Al2O3, their interfacial structures have been characterized via transmission electron microscopy (TEM) as illustrated in Fig. 2. The selected area electron diffraction (SAED) pattern in Fig. 2a, reveals diffraction spots corresponding to the \((0\bar{2}2)\) and \((2\bar{2}0)\) planes, indicative of the DO3 structure in FeSiAl. Figure 2b, c depicts the interfacial structure and elemental distribution within the FeSiAl:Sn-0.8 SMC, where Sn-rich and Al2O3 layers are clearly observed encasing the FeSiAl matrix. Elemental distribution, extracted along the cyan arrow in Fig. 2c and summarized in Fig. 2d, further substantiates the FeSiAl:Sn/Al2O3 architecture as evidenced by the varying intensities of Al, Sn, and O elements with respect to position. Additionally, high-angle annular dark-field (HAADF) mapping and line scanning results (Supplementary Fig. 6) also corroborate these findings.
Fig. 2: Microstructure characterization.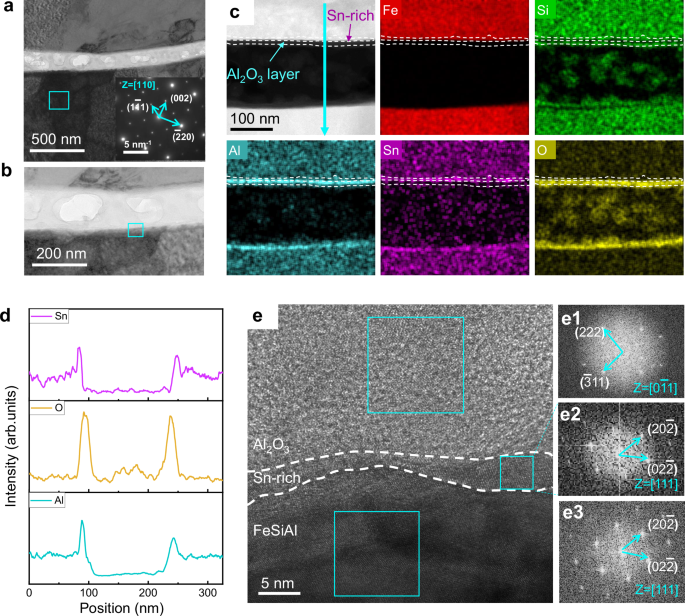
a, b TEM image of FeSiAl:Sn-0.8 SMC. The inset corresponds to the SAED of the cyan box. c HAADF image and corresponding EDS mapping images of FeSiAl:Sn SMC. d The Sn, O, and Al intensity profiles along the cyan arrow in c. e HRTEM image of the cyan box in b. e1-e3 Fast Fourier transform (FFT) images of the corresponding cyan box in e. Source data are provided as a Source Data file.
To explore the lattice structure of FeSiAl:Sn/Al2O3, we obtained high-resolution TEM (HRTEM) images of the region highlighted in the cyan box of Fig. 2b as shown in Fig. 2e. The lattice fringes corresponding to the \((\bar{3}11)\) and (222) planes with a zone axis of \([0\bar{1}1]\) in Fig. 2e1, confirm the presence of Al2O3 (JCPDS:100425). Conversely, the \((02\bar{2})\) and \((20\bar{2})\) planes in the FeSiAl and Sn-rich layer correspond to the lattice fringes of the DO3 structure (Fig. 2e2, e3). Notably, the epitaxial growth of the Al2O3 layer is demonstrated by the aligned \((\bar{3}11)\) plane of Al2O3 and the \((20\bar{2})\) plane of the Sn-rich layer. To investigate the substitution depth of Sn within the FeSiAl matrix, HAADF and EDS mapping images were conducted as shown in Supplementary Fig. 7a-c. Results indicate a broad distribution of Sn atoms (about 3 μm) throughout the FeSiAl matrix with concentration decreasing gradually along the substitution depth (Fig. 3a, b).
Fig. 3: Gradient distribution of Sn substitution Al in FeSiAl matrix.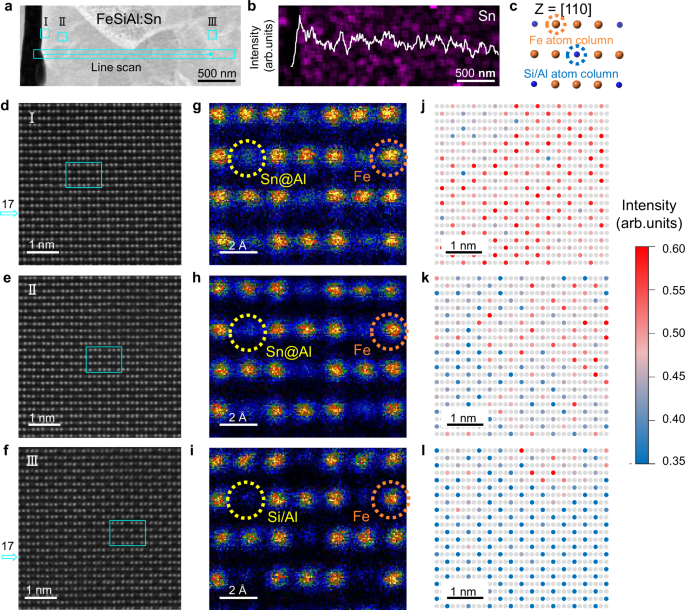
a HAADF image of FeSiAl:Sn matrix. b Sn intensity profile along the cyan line scan in a. c Fe, Si/Al atom columns viewed along [110] direction, where the blue circles stand for Al and Si atom columns, and the golden circles stand for Fe atom columns. d-f Atomic-resolution HAADF-STEM images of FeSiAl:Sn matrix corresponding to different positions in a with zone axis of [110]. g-i The enlarged images of the cyan box in d, e, and f, respectively. j-l Normalized atomic-resolution HAADF-STEM images corresponding to d, e, and f, respectively. Light grey circles represent Fe atom columns, while the other color of circles indicates the atomic intensity contrast of different Si/Al atom columns. Source data are provided as a Source Data file.
High-angle annular dark-field scanning transmission electron microscopy (HAADF-STEM) was employed to elucidate the distribution of substituting Sn atoms. Figure 3c illustrates atomic columns of Fe and Si/Al viewed along the [110] direction, revealing periodic arrangements of three golden Fe atom columns and one Si/Al atom column. Although thickness contrast from multiple atomic columns may be present, the primary contributor to atomic brightness is the atomic number contrast (Z contrast). The atomic-scale microstructure of the FeSiAl:Sn matrix in Fig. 3d-f, clearly differentiates between bright Fe atom columns and darker Si/Al atom columns due to the substantial atomic number difference between Fe and Si/Al. Consequently, a brighter profile at the Si/Al sites (position I, Fig. 3g) is attributed to Sn atoms (atomic number: 50) substituting Al atoms (atomic number: 13). Medium and weak contrast profiles for Si/Al columns at positions II and III (Fig. 3h-i) are also observed, indicating lower concentrations of Sn substitution Al.
To enhance contrast, normalized atomic-resolution HAADF-STEM images were calculated, which facilitate clearer visual identification, given the direct proportionality between HAADF contrast and the mean atomic number (Z2mean)35,36. The colors of the circles denote atomic intensity contrast at various Si/Al column sites: red circles with strong atomic intensity contrast at position I near the interface (Fig. 3j), pink circles indicating medium atomic intensity at position II (Fig. 3k), and blue circles denoting low atomic intensity at position III (Fig. 3l). This color coding clearly reflects the gradient distribution of Sn substitution Al along the depth profile. HAADF-STEM images and corresponding fast Fourier transform (FFT) analyses presented in Supplementary Fig. 8 confirm the face-centered cubic (FCC) structure of the FeSiAl:Sn matrix across different positions with a zone axis of [110]. Additionally, the interplanar spacing of the FeSiAl:Sn matrix exhibits a slight increase from position III to position I, reinforcing the gradient distribution of Sn substitution Al along the depth of the matrix. Line scan and normalized area atomic intensity profiles of Fe and Si/Al atomic columns in Supplementary Fig. 9 further validate these observations.
Enhancement of electrical resistivity
To elucidate the electrical properties of FeSiAl-based samples, height images and surface electric potential of FeSiAl:Sn-0.8 SMC have been characterized by a Kelvin probe force microscope (KPFM) as shown in Fig. 4a, b. A homogeneous and dense Al2O3 insulating layer is observed on the surface of the FeSiAl particles, where the surface electric potential of this insulating layer is significantly lower than that of the FeSiAl matrix. This Al2O3 insulating layer is critical for ensuring effective electrical isolation between the FeSiAl particles, thereby leading to reduced inter-eddy loss.
Fig. 4: Electrical resistivity.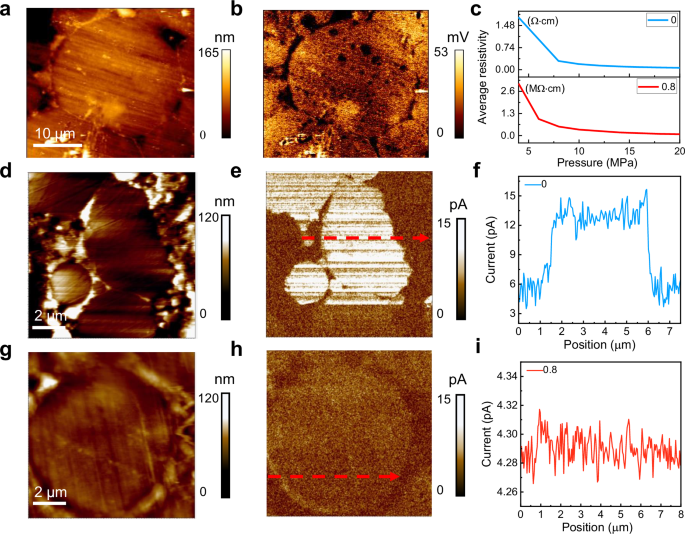
a, b The height images and surface electric potential of FeSiAl:Sn-0.8 SMC. c Electrical resistivity of FeSiAl:Sn-0 and FeSiAl:Sn-0.8 particles after annealing. d, e The height images and surface current of FeSiAl particle in FeSiAl:Sn-0 SMC. f The corresponding current profile along the red arrow in e. g, h Height image and current map of FeSiAl:Sn particle in FeSiAl:Sn-0.8 SMC. i The corresponding current profile along the red arrow in h. Source data are provided as a Source Data file.
Electrical resistivity measurements of annealed FeSiAl:Sn-0.8 particles reveal a value of 81.8 kΩ·cm (Fig. 4c), which is markedly higher than the resistivity of FeSiAl:Sn-0 particles measured at 0.064 Ω·cm. Supplementary Fig. 10 provides further insight, showing that the average electrical resistivities of different SMCs are 41.8, 98.8, 148.2, 186.8, and 190 kΩ·cm for FeSiAl:Sn-0, 0.4, 0.6, 0.8, and 1.0, respectively. These increases in electrical resistivity can primarily be attributed to the formation of the Al2O3 insulating layer and the substitution of Sn heteroatoms within the FeSiAl matrix. Figure 4d, e depicts the height images and surface current measurements of FeSiAl particles within the FeSiAl:Sn-0 SMC. The measured surface current of FeSiAl:Sn-0 SMC is recorded at 12.95 pA (Fig. 4f). In contrast, the current value in the FeSiAl:Sn-0.8 SMC is significantly reduced to 4.29 pA (Fig. 4g-i), attributed to the increased electrical resistivity of the FeSiAl:Sn matrix, which contributes to inhibit intra-eddy loss.
Optimal static and high-frequency magnetic properties
As previously discussed, the incorporation of Sn substitution Al mitigates lattice shrinkage compared to annealed FeSiAl particles. Geometric phase analysis (GPA) strain maps (Supplementary Fig. 11) demonstrate a uniform strain field distribution around the positions of Sn substitution Al, indicating negligible lattice distortion within the FeSiAl:Sn matrix attributable to trace amounts of Sn substitution Al. However, it is observed that lattice spacing (d-spacing) and cell volume can further increase with higher Sn substitution content. Calculations presented in Supplementary Fig. 12 suggest significant lattice distortion for structures with 2Sn@2Al and 3Sn@3Al in comparison with Sn@Al, resulting in high magneto-crystalline anisotropy energy (MAE) (Supplementary Fig. 13).
To determine the optimal amount of Sn substitution, various FeSiAl:Sn SMCs have been synthesized. As illustrated in Fig. 5a, the coercivity of these SMCs is measured from direct current (DC) hysteresis loops. Notably, FeSiAl:Sn-0.8 exhibits the lowest average coercivity of 26.59 A/m, consistent with the lowest coercive field measured through dynamic B-H assessments (Fig. 5a). It is worth noting that further increase in Sn substitution deteriorates the coercivity. Given that coercivity is generally related to magneto-crystalline anisotropy37, the reduced coercivity of FeSiAl:Sn-0.8 confirms the decline of anisotropy, which is in agreement with the MAE simulation. By performing micromagnetic simulations, it is also found that the coercivity decreases with optimal Sn doping induced by the decrease of magneto-crystalline anisotropy (Fig. 5b), which can mitigate hysteresis loss.
Fig. 5: Static and dynamic magnetic properties.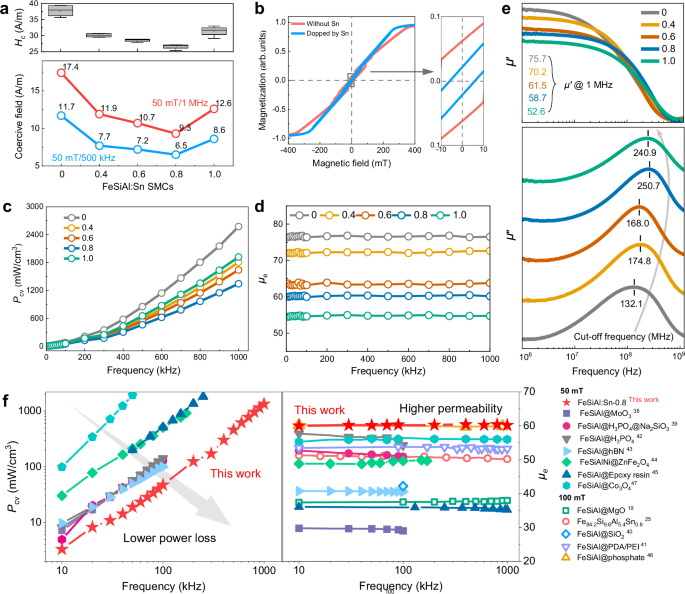
a Coercivity (Hc) of different FeSiAl:Sn SMCs from DC hysteresis loop and coercive field of different FeSiAl:Sn SMCs from B-H analyzer. b Simulated hysteresis loop of FeSiAl with and without Sn doping, in which the coercivity has been reduced with Sn doping. c Power loss (Pcv) of different FeSiAl:Sn SMCs as a function of frequency. The values are measured at 50 mT from a B-H analyzer. d Effective permeability (μe) of different FeSiAl:Sn SMCs as a function of frequency. e Frequency dependence of real part of permeability μ‘, imaginary part of permeability μ“ of different FeSiAl:Sn SMCs, including the μ‘@1 MHz and the cut-off frequencies of all the samples. f Comparison of power loss and effective permeability of our FeSiAl:Sn-0.8 SMC with other counterparts. Source data are provided as a Source Data file.
Power loss, a critical performance metric for SMCs, was characterized across all samples. The power loss for FeSiAl:Sn-0 is measured at 2573 mW/cm3 at 1 MHz under 50 mT, while all FeSiAl:Sn SMCs exhibit substantially lower power loss (Fig. 5c). Specifically, FeSiAl:Sn-0.8 achieves the lowest power loss of 1344 mW/cm3, primarily ascribed to suppressed hysteresis and eddy losses, which is also verified by the loss separation results in Supplementary Fig. 14 and Table S1. It is noteworthy that FeSiAl:Sn-1.0 displays a relatively higher power loss of 1918 mW/cm3 due to increased hysteresis loss confirmed by high coercivity, which is mainly caused by large lattice distortion ascribed to excessive Sn substitution and increased demagnetization field due to the increase of air gap indued by the porosity. Meanwhile, FeSiAl:Sn-0.8 exhibits the highest quality factor (Q) as indicated in Supplementary Fig. 15. It should be noted that the reduced inter and intra-eddy losses of FeSiAl:Sn/Al2O3 structure are also verified by the inhibited current density cloud and corresponding vector maps in Supplementary Fig. 16.
Additionally, FeSiAl:Sn-0.8 SMC demonstrates a steady effective permeability of 60 across the frequency range of 0 to 1MHz (Fig. 5d). The effective permeability decreases with increasing SnCl₂ content, following the same trend as density. In addition to magnetic dilution due to the addition of SnCl₂ to the SMC, higher porosity evidenced by lower density also introduces air gaps and enlarges demagnetization field in the SMC, thereby reducing the effective permeability of FeSiAl:Sn-1.0 SMC. Meanwhile, the saturation magnetizations of FeSiAl:Sn particles decrease from 144 to 136 emu/g (Supplementary Fig. 17a). Furthermore, the stability of effective permeability in FeSiAl:Sn-0.8 across varying temperatures is also evaluated (Supplementary Fig. 17b), revealing stable effective permeability from 0 to 140 °C, which underscores its significant application potential. Permeability at 1 MHz and cut-off frequencies for all FeSiAl:Sn SMCs in Fig. 5e, illustrates the effective permeability of 60 up to tens of MHz. Meanwhile, the cut-off frequency for FeSiAl:Sn-0.8 reaches to 250.7 MHz, nearly double that of FeSiAl:Sn-0 SMC (132 MHz). To visually compare the optimized performance of FeSiAl:Sn-0.8 SMC, the relationship between power loss and effective permeability as a function of frequency is presented alongside other reported counterparts in Fig. 5f38,39,40,41,42,43,44,45,46,47 and Supplementary Fig. 18, illustrating superior magnetic performance of the FeSiAl:Sn-0.8 SMC especially in high-frequency. Additionally, the corresponding power loss values measured at specific maximum magnetic flux density and frequency are also given in Table.S2, fully confirming this point.