
As climate change impacts are unfolding at greater speed, frequency and intensity, climate adaptation has become a necessary strategy for preventing degradation, averting disasters, and continuing improvement in the quality of life worldwide. The need for further action was acknowledged by governments during the twenty eighth Conference of the Parties (COP28) of the United Nations Framework Convention on Climate Change (UNFCCC) convened at the United Arab Emirates (UAE) in the context of the Global Goal on Adaptation (GGA). The adoption of the UAE Framework for Global Climate Resilience at COP28 was accompanied by a mandate to develop a robust suite of adaptation indicators for tracking the implementation of the targets of the Framework. Yet, questions remain what data the indicators, once selected, should draw on, how these can be global in scale, and best serve the needs of the Parties to the Paris Agreement.
This Perspective is the result of a forum ‘Using Earth Observations Systems to Improve Climate Adaptation Policy and Action’, held from June 25 through June 28, 2024, in Bern, Switzerland, and hosted by the International Space Science Institute (ISSI, https://forum.issibern.ch/climate-adaptation/). The forum was co-convened by ISSI, European Space Agency, NASA, World Adaptation Science Programme, and Griffith University, with participants from research, policy, and space agencies. It explored the use and availability of space-based Earth Observations (EO) data in relation to the needs of the current UAE-Belem work programme on indicators under the GGA to assess the targets of the GGA framework. Considering global asymmetries in terms of the spatial coverage and temporal continuity of in-situ direct observations, such data sources were not discussed at the Forum. This paper aims to inform the ongoing UNFCCC process by highlighting the potential contributions of the EO community and the data it provides. We argue that EO data should be considered as an integral part of the GGA indicators under the UAE Framework for Global Climate Resilience. Reflecting the multidisciplinary expertise gathered at the Forum, we provide a set of recommendations to multiple stakeholders on how EO data can be further enhanced to support adaptation action and monitoring at scale. In particular, this paper focuses on four broad themes that span many aspects of the GGA targets: agriculture (which also integrates aspects of water), biodiversity, extreme events (which integrates aspects of water, infrastructure, and poverty) and health.
Adaptation
Adaptation is the process of adjustment to actual or expected climate and its effects, in order to moderate harm or exploit beneficial opportunities1. Adaptation covers a wide range of reactive and proactive actions that can reduce exposure and vulnerability to climate hazards while also identifying effective ways to increase adaptive capacity. While climate adaptation has long been understood as mainly a local issue2, it is increasingly clear that it needs to be effectively addressed at multiple scales, including the global level, owing to the transboundary and cascading nature of climate risks3. This increasingly calls attention to the goals of adaptation and the benefits that adaptation can deliver4. Indeed, there is an international push towards enhancing the prominence given to climate adaptation actions, as the need to prepare for the already experienced, committed, and projected climatic and meteorological changes has become evident5,6.
At the core of adaptation is the definition of risk from climate hazards and reducing exposure and vulnerability. Risk is the “potential for adverse consequences for human or ecological systems, recognising the diversity of values and objectives associated with such systems, which can arise from potential impacts of climate change as well as human responses to climate change”7. It requires the assessment of the potential consequences of a response to climate change failing to achieve its intended outcome; or the intended action creating an adverse outcome elsewhere, to avoid creating a new risk or exacerbating an existing one, leading to maladaptation.
Despite overall progress, we are not collectively on track towards achieving climate goals8, and the breaches of 1.5°C for a month and even a year (2024) are early signs of getting perilously close to exceeding the long-term temperature goal of the Paris Agreement. This serves as a clarion call for increasing ambition and accelerating climate action9.
Global adaptation efforts and the Global Goal on Adaptation
Under the UNFCCC and the Paris Agreement, major advancements have occurred in recent years that highlight the importance of adaptation10. The Paris Agreement’s Article 7 on Adaptation outlines the GGA (Art. 7.1) of “enhancing adaptive capacity, strengthening resilience and reducing vulnerability to climate change, with a view to contributing to sustainable development and ensuring an adequate adaptation response in the context of the temperature goal”11. Article 7 also encourages countries to plan for adaptation through National Adaptation Plans (NAPs), to report on adaptation efforts via Adaptation Communications (ADCOMs) and Biennial Transparency Reports under Article 13, while integrating adaptation into Nationally Determined Contributions (NDCs). Together, these documents outline the national level actions that countries commit to undertake in progressing climate adaptation.
Since then, the common understanding of the GGA has evolved through subsequent Conferences of the Parties (COPs) within their Conference of the Parties to the Paris Agreement meetings (CMAs) including through the adoption a framework for the GGA was adopted that comprises 11 global targets (Decision 2/CMA5 at COP28). They include seven theme or sectoral targets covering Water (9a), Food & Agriculture (9b), Health (9c), Ecosystems and Biodiversity (9d), Infrastructure and Human Settlements (9e), Poverty eradication and Livelihoods (9f), and Cultural heritage (9 g) (Table 1). Four other targets (10a-10d) refer to the policy cycle: 1. Impact, Vulnerability and Risk Assessment, 2. Planning, 3. Implementation, 4. Monitoring, Evaluation and Learning (Fig. 1). These GGA targets refer to a 2030 and beyond timeframe and governments are now establishing adaptation indicators to track progress towards the GGA framework. These indicators are expected to be adopted by Parties in COP30 in November 2025.
Fig. 1: The Global Goal on Adaptation framework policy cycle targets.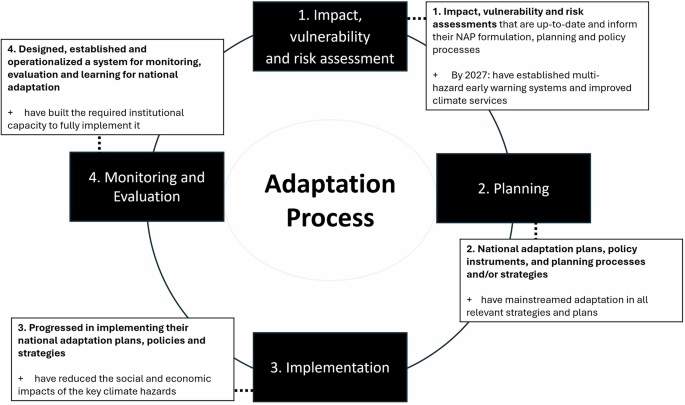
Of the 11 Targets, four are organised around the policy cycle: 1. Impact, Vulnerability and Risk Assessment, 2. Planning, 3. Implementation, 4. Monitoring, Evaluation and Learning; and the remaining seven are theme or sector related: Water (9a), Food & Agriculture (9b), Health (9c), Ecosystems and Biodiversity (9d), Infrastructure and Human Settlements (9e), Poverty eradication and Livelihoods (9f), and Cultural heritage (9g). Figure drafted by Timo Leiter based on Decision 2/CMA.517).
Table 1 Summary of SDGs that were identified as having the most indicators which already use (green) or can benefit from (amber) EO37
As a first step, existing indicators for measuring progress towards achieving the GGA targets were proposed by governments and observer organisations in July and August 2024 and compiled by the UNFCCC Secretariat, resulting in over 7500 indicators. Selected technical experts have reduced this list to 490 indicators, and then again to a preliminary 100 indicators, which forms the basis for an agreement by Parties at COP3012,13,14,15. The criteria for assessing the indicators are based loosely on the following specifications coming from UNFCCC SB60 meeting (June, 2024):
(a)
adaptation-relevance;
(b)
quantitative/qualitative aspects;
(c)
data availability;
(d)
capacity to reflect local/national/regional circumstances;
(e)
applicability across contexts;
(f)
ease of interpretation;
(g)
clarity of methods;
(h)
aggregability and dis-aggregability across social dimensions;
(i)
basis in science;
The focus is on adaptation relevance and adaptation-specific indicators, enabling factors for implementation, and quantitative indicators complemented with qualitative narratives where possible, with several exclusions (mitigation, climate impacts and hazards). This increased global focus on adaptation via the adoption of global targets and the subsequent development of indicators provides a much-needed framework upon which action can be informed, focused and guided, that has otherwise been lacking compared to mitigation efforts. However, global scale methods and data are needed to answer questions on how such progress could be tracked, which should be sufficiently generalisable to be adopted at scale across different geographic contexts16,17. This is where EO could be increasingly critical, as it is able to offer global spatio-temporal continuity of observations. For example, Target 9d (Ecosystems and Biodiversity) could benefit from efforts in implementing ecosystem-based adaptation measures at global scale that could be observed through EO data to showcase progress.
Earth Observation-Based Adaptation Indicators
Although adaptation is a complex and often location specific issue, and tracking implementation progress at the global level requires the integration of multiple and diverse sources of data18, EO still has many capabilities that can make it a valuable input for creating adaptation indicators. In this paper, EO refers to satellite observations rather than other types of EO such as drones, sonde data, surface-based data etc. We note that satellite-based EO requires reference-quality in-situ data for “ground truthing” to calibrate and validate their measurements. The strength of satellite-based EO datasets are manifold:
Objectivity: Satellite-based measurements and derived data products follow strict quality standards. Products are generated using multiple instruments, or sensors, and the data is centrally curated, calibrated, validated, and publicised.
Repeatability: The nature of satellite-based EO, where orbital position of the satellite and the field of view of the instrument are well-controlled, means that they are repeatable and comparable over time and location, thus facilitating the standardisation of global statistics on climate impacts and adaptation.
Coverage: EO satellites have a range of configurations which enable them to provide local, national, regional to near-global coverage and measurements can be retrieved over remote and inaccessible areas which would otherwise be difficult to monitor through ground-based techniques.
Data continuity and long-term archive: The satellite era of data now spans several decades up to 60 years (Fig. 2) with some climate variables being monitored by multiple sensors over space and time. Data continuity (across different satellite instruments) is an essential aspect of satellite missions despite being a non-trivial task to do. This allows the scientific community time to build experience with the systems and to develop and refine approaches for indicator methodologies with EO data. A long-term continuous data archive is particularly important for climate change studies, as it allows for quantifying trends in surface property changes at climatologically significant time scales in addition to observing interannual variability, thus establishing the baseline for monitoring change under historical and future adaptation measures. It should be noted that the cost of privately owned EO data may be prohibitive for large-scale assessment.
Fig. 2: Satellite-based Essential Climate Variable (ECV) data from the Committee on Earth Observation Satellites (CEOS) ECV Inventory20.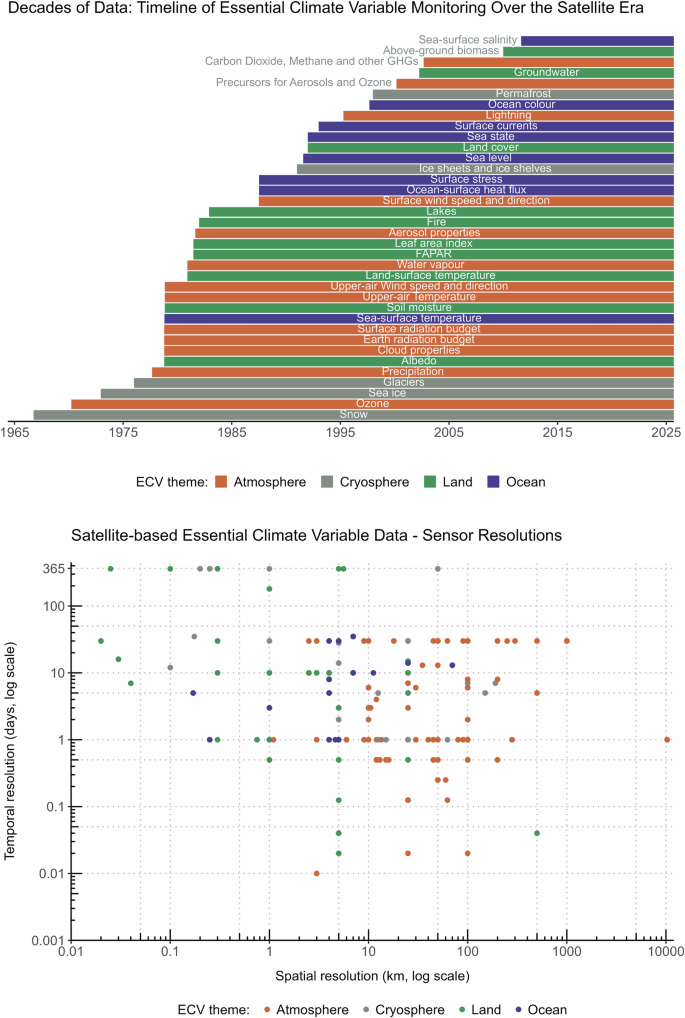
(top) Timeline of ECV monitoring over the satellite era. (below) Scatterplot of ECV quantities showing the minimum temporal and spatial resolution stated in the CEOS Inventory. Panel B is a log scale. ECVs are colour coded to indicate their earth system component. Orange = Atmosphere. Grey = Cryosphere. Green = Land. Blue = Ocean.
Availability: EO data are collected by a large fleet of satellites operated by numerous national and intergovernmental space agencies and a rapidly growing number of privately owned small-sat constellations. Agency examples such as the Copernicus Sentinel missions are within the open science domain and are publicly available with unrestricted access to the global community can equally bridge the data gaps.
Thematic diversity and detail: Satellite sensors can survey the Earth’s surface and its atmosphere across multiple ranges of the electromagnetic spectrum. As a result, they provide unique information about physical, biological, and chemical characteristics of the Earth’s surface and atmosphere and their changes.
Multiple examples of EO data used across all stages of the adaptation process exist (particularly Stages 1 and 4), but the extent to which EO supports each stage strongly differs with context. Historically, EO data has mostly been used to monitor and understand changes and variability in the climate system and assess their impacts on humans and nature. Essential Climate Variables (ECVs, https://gcos.wmo.int/en/essential-climate-variables), as defined by the Global Climate Observing System (GCOS), are the key indicators that describe Earth’s changing climate. Of the 55 ECVs currently specified, around two-thirds are able to be monitored with satellite data19. Figure 2 summarises these ECVs and provides an overview of the length of the climate data record per ECV and an indication of the available spatial and temporal resolutions of the EO datasets. This figure shows the earliest date when a specific ECV product/quantity was first measured from space. Most ECVs have multiple ECV products/quantities (measurable components of ECVs that, together, identify how the ECV changes over time) which each have different start dates. For example, the Sea Ice ECV comprises multiple ECV products/quantities, of which, Sea Ice Concentration has been monitored since the 1970s but Sea Ice Thickness has only been monitored since the 1990s. It should also be noted that trade-offs often exist with high spatial resolution and global coverage, many of the very high spatially resolved satellite sensors are geostationary sensors, meaning they remain over a specific region of the world rather than circumnavigating around the globe. As adaptation is primarily a local issue, there can be a challenge to obtaining sufficiently high resolution (both spatially and temporally) for some adaptation applications (Fig. 2 below). For example, monitoring changes to flooding impacts after implementing adaptation actions in urban environments could require up to metre-scale resolution. Alternatively, looking at adaptation actions on the field-level for agricultural purposes, resolutions of dozens or hundreds of metres could be required. Rarely would kilometre scale resolution be sufficient for monitoring adaptation. Additionally, although many ECVs have data records continuing over decades (Fig. 2 top), many of the early satellite missions were coarser resolution. This Figure, created using the Committee on Earth Observation Satellites (CEOS) ECV inventory20, also does not include many of the privately funded missions that often provide higher resolution data but can be paywalled. EO datasets are available through a variety of different channels, e.g., through space agency websites, data repositories such as CEDA (https://archive.ceda.ac.uk/), and via climate services such as the Copernicus Climate Change Service (https://cds.climate.copernicus.eu/).
Figure 3 shows some examples together with the IPCC-defined Risk Framework shown for context. Within the IPCC risk framework, ECVs are routinely used to characterise the climate hazard, exposure, and vulnerability components. In particular, the need to map climate hazards, defined as climate-induced events that lead to negative effects (e.g., loss of human lives, injuries, infrastructure damage, ecosystems and environmental disruptions), substantially benefit from EO capacity, inheriting decades of systematic geospatial time series from which to derive the aforementioned ECVs to establish baseline climatologies, quantify anomalies, and detect extreme events (including frequency, duration and intensity). The exposure component of the Risk Framework refers to the presence of people; livelihoods; species or ecosystems; environmental functions, services, and resources; infrastructure; or economic, social, or cultural assets in places and settings that could be adversely affected1,21. EO data is now routinely used to develop gridded estimates of global population density22, characterise urban environments, infer primary occupation through land use mapping, and develop proxies for economic development metrics using night-time lights observations. Finally, the vulnerability component refers to the propensity or predisposition of exposed elements to suffer adverse effects when impacted by hazard events1. It encompasses various concepts and elements, including sensitivity or susceptibility to harm and lack of capacity to cope and adapt and is impacted by such dimensions as culture, knowledge, resource access, and governance that contribute to differential vulnerability1. Few facets of the vulnerability component lend themselves readily to EO data-based metrics development – nevertheless, its elements have, more often than not, strong spatial signatures that can potentially be linked with EO-based proxy data. For example, vulnerable neighbourhoods such as slums or informal settlements have typical physical patterns such as dense buildings coupled with narrow and irregular streets. Overlaying EO imagery with flood models can help identify whether such informal neighbourhoods are more at risk of flooding than nearby “planned” neighbourhoods around. Such analyses can give contextual information – but one must never forget that this is a proxy and does not exactly represent the situation on the ground, where gentrification could mean a neighbourhood is not as vulnerable as it may appear or “planned” neighbourhoods are actually more vulnerable than expected.
Fig. 3: Earth observation examples that support the Global Goal on Adaptation (GGA) framework’s policy cycle targets.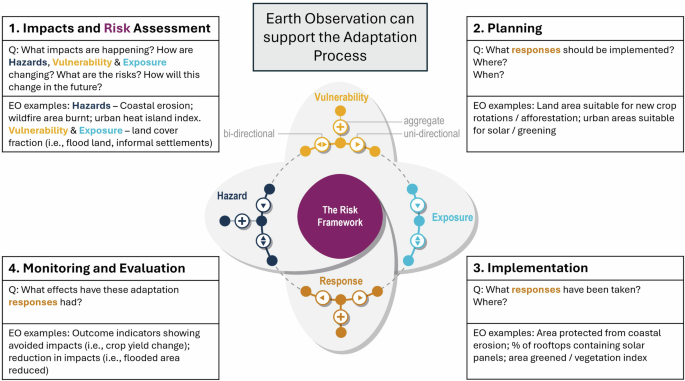
An overview of the adaptation process as described in the GGA framework, how it relates to the IPCC Risk Framework (centre), and examples of the potential for EO to support possible indicators of the four policy cycle targets. Figure adapted from Figure 1.5 from the AR6 IPCC7 WG2 by authors.
Going beyond the risk assessment and Stage 1 of the adaptation cycle, EO allows us to identify geographical and environmental settings where adaptation measures are most needed and support the monitoring of their implementation (Stages 2 and 3). Furthermore, by offering consistent and long timeseries of several ECVs together with the corresponding extreme events/risk indicators and past disaster outcomes, it allows us to model causal effects of climate hazards and infer which are the most effective adaptation measures. As a result, both the observed and modelled reduction of impacts or risks can serve as adaptation outcome indicators if linked to interventions (Stage 4). Therefore, EO has great potential to support the GGA framework by providing indicator information for monitoring changes or avoided impacts before, during and after adaptation interventions have been implemented, for example, EO can be used to monitor the effectiveness of adaptation interventions during implementation, especially as extreme climate events and slow onset climate hazards impact adaptation.
Whether a metric serves as an indicator of adaptation tracking depends on the application context. For example, the indicator ‘cubic metres of freshwater saved’ would only be an effective indicator of adaptation if it is used to assess the outcomes of a known adaptation intervention23. Similarly, EO-based indicators may or may not be deemed as adaptation indicators depending on the context of their application. Understanding the assumptions under which an indicator is linked to adaptation is key to determining its usage and usefulness for adaptation tracking. Furthermore, although all stages of the adaptation cycle can contain indicators based on EO data, many adaptation indicators, which rely on socio-economic or other sources of information, cannot be derived or supported by EO. To create a comprehensive picture of adaptation progress, it is essential to use multiple indicators that draw from various lines of evidence (for global level adaptation tracking18). This should also include consideration of optimal values and threshold values for the indicators to define what successful implementation means. For example, using percentages e.g., “% of at-risk sites with adaptation measures implemented” where 100% is the optimal value and other values can be determined for thresholds13. This links also to the diversity of data needed where EO data can play an important role.
Nevertheless, a lesson can be learned from the history of the GCOS ECVs that could enhance EO’s role across the Adaptation Process. As mandated by the UN, GCOS has regularly published ECV requirement assessments, and dictated the needed measurement resolution, stability, uncertainty, and timeliness to be met by the totality of the observing system (in-situ and satellite) in order to have robust and usable data24. Through mandated governance, together with adequate funding support, the climate research and development community has established robust monitoring networks and high-quality EO observations of the ECVs after decades of effort. If a similar organisation can be established to regularly assess the requirements needed for the resulting Adaptation Indicators from the GGA framework, then this can provide a basis upon which funding agencies can establish targets for research and development activities.
Associated challenges for using EO to assess adaptation outcomes
Despite the potential for EO to more systematically support the adaptation cycle, several key challenges must be overcome to ensure an effective approach. This section describes four key challenges: Attribution, Maximizing data utility, Data disaggregation, and Integrating past and future data.
Attribution—establishing an accurate baseline
If EO is to more substantially contribute to the Monitoring and Evaluation part of the adaptation process (Stage 4), then rigorous methods to attribute resulting post-intervention changes and avoided impacts must be ensured to properly assess the efficacy of the adaptation action. Our ability to monitor and attribute changes in outcomes of any implemented adaptation measure strongly depends on establishing accurate baseline conditions. While long-term EO baselines exist for some ECVs, spanning decades, the establishment of a baseline for a given adaptation indicator is context specific and best done independent of satellite data availability. Frequently EO are combined with other data (e.g., socio-economic, in-situ observations, modelling) to interpret the causes of the observed change, identify climate related risks, and monitor the progress or effectiveness of an adaptation action targeting the specific risk. Often, defining a baseline is a complex activity where EO could play an essential role in its establishment. The ‘EXHAUSTION’ (https://www.exhaustion.eu/) project, which seeks to establish the exposure-response relationship between heat stress and daily mortality with the modifying effect of air pollutants, relies on satellite-based observations of land surface temperature (LST) and aerosol optical depth (AOD) in combination with station-data for temperature and air pollutants and a range of spatial predictors, including vegetation greenness, share of urban build-up, elevation, population density, night light intensity, and road network density25. Additional non-EO data reflecting socio-economic characteristics were included in the analyses as potential effect modifiers26,27. The methodology was used to quantify current excess deaths (a deviation from baseline conditions) resulting from extreme heat and various effect modifiers28. Metrics like the number of deaths or disease cases alone cannot reliably indicate whether policies and interventions are successful, as demographic changes can affect the initial baseline.
Maximising data utility
The abundance of EO data presents both opportunities and challenges. While numerous satellite data and derived products are openly available to the global community, resources for storage, management, and processing are required – as well as resources and understanding for prioritisation and assessing the appropriateness of each for different approaches. Cloud-based data analysis environments, such as Google Earth Engine (https://earthengine.google.com/) and Destination Earth Platform (https://platform.destine.eu/), pave the way toward eliminating limitations arising from the lack of local IT infrastructure. However, reliance on single corporate portals can raise concerns about both short- and long-term variability of availability and long-term stability and access, in particular, if these are concentrated in specific regions or under specific government control.
To maximise interoperability and usability, it is crucial to agree on variable-agnostic formats, standardised data structures, and well-characterised quality assurance to enhance comparability and transparency of results. In addition, this allows a broader group of developers, data providers, and users to adopt a common data standard to improve interoperability.
In times of crisis, such as immediately following an extreme event, EO data frequently serves as the timeliest and readily available source of information about the extent of impact and the environmental settings (e.g., through the International Charter ‘Space and Major Disasters’) constraining the response of the operational agencies. Decision-makers within operational agencies without the support from geospatial data experts can sometimes struggle to both identify data sources which best serve the operational response needs, as well as face challenges to prioritise various data sources when they have been clearly identified and made available. Both lead to delays that can be costly in terms of both time and lives. Effective incorporation of EO data in operational response or monitoring, thus, relies on capacity building. A substantial investment in end-user training and embedding geospatial data science experts within operational agencies, especially in vulnerable regions, is essential for effectively utilising EO data for adaptation solutions.
Data disaggregating to understand vulnerability
Data Disaggregation refers to the process of breaking down or separating aggregated data into smaller, more specific groups to reveal patterns or disparities that may be hidden within a larger dataset4. Improving data disaggregation is fundamental for implementing indicator frameworks and ensuring no one is left behind in adaptation efforts, particularly as more vulnerable groups are disproportionately impacted by climate change. Differential vulnerability exists due to a range of factors but can relate to resource access, culture, knowledge, and governance systems in place that mediate power and decision-making29. EO-based indicators must be disaggregated to account for asymmetric vulnerability due to social inequalities and biases or simplifications in related models. But the challenge remains that EO will never be able to capture all aspects of vulnerability. Any data analytics workflow will contain biases due to various reasons30. Firstly, it is based on observed data which by nature is historical. This is particularly important in the context of climate change, where historical records may not be relevant for the expected changes (the ‘out of sample’-problem). Secondly, there are biases due to how the population is sampled, and whether all sub-groups of the population are represented in this sampling. Thirdly, biases are introduced when defining how a certain target is measured. Qualitative targets are divided into quantitative indicators, which cannot reflect all the nuances. Fourthly, data models introduce biases in the way they are trained and evaluated. Finally, biases are introduced in the deployment of model results, indicating how and whether the decision makers use the data.
When using EO to calculate adaptation indicators, biases may also be introduced. That is why it is important to evaluate indicators in a disaggregated way for vulnerable groups of the population to ensure that they are not disproportionately impacted. There are documented methods on how to audit processes or calculated indices for biases31. Such methods should be established and implemented to ensure that climate adaptation also contributes to reducing the disproportionate impacts of climate change to different social groups, with particular emphasis on vulnerable sub-populations.
Integrating past data with future projections
As previously stated, while EO provides access to historical data, it does not offer a forward-looking perspective that is required for risk assessments and evaluating potential adaptation actions. Drawing lessons from the earth system modelling community, a coordinated approach for climate adaptation projections research and development can be established. This could complement existing initiatives like the Baseline Variables for Earth System Modelling Project supported by the Coupled Model Intercomparison Project (CMIP), in which a subset of priority variables is scoped, specifically for impact and adaptation assessments32.
With Digital Twin Earth systems now emerging—especially through the Destination Earth Initiative https://destination-earth.eu/)—EO and cloud computing are enabling large-scale, AI/ML-driven models to simulate “what if” scenarios based on integrated observational data. While these EO-based weather and climate prediction examples are gaining traction33,34,35,36, further development is needed to enhance their maturity and scalability, with EO remaining vital both as a predictive input and as an unbiased validation source. Using Digital Twins could however unlock new insights for potential future scenarios and assist adaptation decision-making.
Parallels with the SDG indicators
The GGA is not the first time that global indicators are sought to reflect progress at the global scale. In September 2015, the United Nations General Assembly adopted the Agenda 2030 for Sustainable Development. In 2017, the UN Statistical Commission endorsed a Global Indicator Framework comprising 232 indicators for countries to measure progress towards 169 targets of the 17 Sustainable Development Goals (SDGs). One of the greatest challenges faced is access to regular, systematic, and authoritative data for all of the SDG indicators. An ESA-funded study in 202037 investigated the potential of satellite-based EO in meeting the observational requirements of the SDG indicators and targets. This section is a summary of that publication. Based on literature review and expert consultation, a “traffic light” system of red, amber, green (RAG) colours was applied across the indicator suite to flag the relevance of EO. The overall EO relevance was deduced from eight criteria describing the readiness and adequacy of EO to the indicator methodology.
The study found that only seventeen out of the 232 SDG indicators either currently use EO as a major source of data or EO would make a definite contribution to their methodological development (green). EO was identified as a potential source of data and/or information for another 17 indicators which currently do not use it (amber). EO could not contribute to the indicator methodology of any of the remaining 193 red indicators (red).
Surprisingly, SDG 13 (Climate Action), has only one indicator which could potentially benefit from EO – SDG Indicator 13.1.1 (People affected by disasters; this indicator also appears in SDG 1 – Poverty Eradication – indicator 1.5.1 – and SDG 11 Cities – indicator 11.5.1). This is notable because EO is widely recognised as a major source of systematic observation for the GCOS ECVs (see section above). The emphasis of SDG 13 on “Climate Action”, i.e., to instigate a collective societal response to the climate crisis, rather than climate observation is a major factor in the limited use of EO for climate-related monitoring in the SDG Indicator Framework. There seems to be missing opportunities here for EO support to some of the SDGs within this Framework.
Of the other goals, SDG 6 (water), 11 (cities), and 15 (life on land) were identified as having the most indicators which already use (green) or can benefit from EO (amber) with 6 indicators across each goal (Table 1). Generally, these indicators share common observable properties which are suited to EO, namely, one or more bio(geo)physical targets which are directly and readily observable from space via multi or hyperspectral optical imaging, synthetic aperture radar or other physical remote sensing technologies, e.g., radar altimetry. In some cases, there are indirectly observable properties of the indicator. For example, the current SDG indicator 6.1.1 (safe drinking water) methodology is based on household surveys and censuses. While this indicator cannot be directly evaluated from EO, it can be potentially inferred from the change in surface water quality before and after treatment, the former coming from EO-derived water quality maps and the latter from in-situ sampling.
Two SDG indicators which serve as excellent examples of the use of EO for indicator monitoring and reporting and also appear in the UAE – Belém work programme on indicators (in the synthesis of submissions) are:
SDG Indicator 15.3.1: Proportion of degraded land over total land area. This uses three EO-based sub-indicators: land cover change, land productivity dynamics and soil organic carbon stocks (based on a hybrid method of combining EO-derived land cover changes with IPCC-derived land use change factors). These three are considered to be a minimum set of essential variables to capture the spatial and temporal changes in land degradation globally. Put simply, any significant reduction or negative change in one of the three sub-indicators is considered to comprise land degradation (one-out-all-out rule). The result is a binary assessment where a land unit (pixel) is either degraded or not degraded.
SDG Indicator 6.6.1: Change in the extent of water-related ecosystems over time. This comprises five sub-indicators, two of which are completely derived from EO data – (i) Sub-indicator 1: the extent of water related ecosystems over time and (ii) Sub-indicator 2: the water quality of lakes and artificial water bodies. For sub-Indicator 1, water related ecosystems are further subdivided into 3 categories: open and natural surface waters, artificial water bodies and vegetated wetlands, which are observed using a combination of optical and radar time series imagery. For sub-Indicator 2, the EO methods are focused on chlorophyll and total suspended solids within lakes and artificial water bodies globally.
Learning from what is already happening
This section builds on the developments from the EO community relating to climate adaptation for agriculture and biodiversity, extreme events, and health. Table 2 lists some example variables that are commonly derived from EO and how they are relevant for some of the GGA thematic goals.
Table 2 Examples of EO-derived indicators relevant for GGADevelopments relating to agriculture
As climate change increasingly impacts the water cycle, efficient irrigation becomes essential for agricultural adaptation. EO serves as a significant source of data for water-based adaptation indicators. The FAO’s Remote Sensing for Water Productivity (WaPOR) project38 provides a comprehensive database of water productivity, utilising EO-derived variables such as evapotranspiration and soil moisture. It provides data at global to field scale (300–20 m), with 200 m resolution data covering Northern and sub-Saharan Africa as well as the Near East and 20 m resolution focussing on specific sub-basins in these regions.
Surface water storage, such as lakes and reservoirs, is actively monitored using Synthetic Aperture Radar (SAR) and optical satellite imagery, with the Global Water Watch (GWW) platform providing over 40 years of data on surface and volume estimates for reservoirs worldwide. However, obtaining groundwater estimates through EO data remains challenging. Promising advancements include gravity dynamic measurements from the GRACE mission, which offers regional groundwater estimates39. Future missions, such as MAGIC, are expected to enhance our ability to monitor groundwater dynamics at a finer spatial resolution40.
Transitioning from traditional irrigation to more efficient drip irrigation requires inventorying current irrigation systems, achievable through remotely sensed soil moisture and actual evapotranspiration data and supported by machine learning classification schemes41. The Biomass Climate Adaptation Index (Biomass CAI) uses deep learning to assess climate resilience in agricultural areas, comparing observed and predicted Vegetation Index (VI) measures to identify increased resilience or degradation42.
Climate change affects agricultural pests with rising temperatures enabling their migration into higher latitudes and increasing their number of generations within a growing season43,44. Additionally, the intensification and increased frequency of extreme events like heavy rainfall are contributing to increased pest risk, for example as a driver of locust outbreaks in North Africa45 and fall armyworm in Eastern Africa46, having devastating impacts on agriculture. While EO satellites cannot directly identify and track swarms and infestations (although with the launch of EarthCARE in 2024 this may change), they can monitor the conditions favouring these phenomena, namely rainfall, green vegetation extent and soil moisture47. Leveraging data provided by Meteosat satellites, MODIS, Sentinel-3, and SMOS, the FAO Desert Locust Information Service (DLIS, https://www.fao.org/locust-watch/activities/dlis-home/dlis/en) monitors ecological conditions and locust infestations at the global level and, combined with models, produces forecasts of the locust situation up to six weeks into the future, thereby providing an early warning mechanism.
Climate change also causes shifts in agro-climatic indices like aridity, growing season length and growing degree days and therefore affects agricultural land suitability for crops and other land uses. Crop migration, i.e., the movement of growing areas to more favourable conditions, is one solution to adapting to these adverse effects on crop suitability and yields48. EO can track changes in agriculturally used areas by using a combination of SAR and optical time series data and deep learning techniques. For example, ESA’s Climate Change Initiative High Resolution Land Cover project (https://climate.esa.int/en/projects/high-resolution-land-cover/) provides land cover change maps at 30 m spatial resolution, reporting changed pixels every 5 years. Changes in the distribution of specific crop species can also be monitored, as is done in seasonally updated global maps at 10 m resolution within the ESA WorldCereal project (https://esa-worldcereal.org/en).
Developments relating to biodiversity
Ecosystem-based adaptation is a strategy that leverages nature-based solutions and ecosystem services to address the impacts of climate change49. It is highlighted in the GGA framework’s Biodiversity Target (Target 9d) and is recognised as a key adaptation strategy by the IPCC.
EO has proven effective for planning ecosystem-based interventions and for monitoring their implementation. The Global Mangrove Watch (GMW, https://www.globalmangrovewatch.org/), developed under JAXA’s Kyoto & Carbon initiative, offers geospatial information on mangrove extent and changes. This data is crucial for Ramsar Convention national wetland practitioners, decision-makers, and NGOs, providing data for SDG indicators (6.6.1, 13.1, 15.1.1, 15.1.2). EO platforms like Global Forest Watch (GFW, https://www.globalforestwatch.org/) provide access to geospatial datasets on forest cover, allowing for the monitoring of changes in tree cover globally.
Adaptation actions in the forestry sector against pests, droughts and wildfires, threats exacerbated by climate change, are crucial to protecting forests’ diverse environmental and socio-economic functions, e.g., delivery of raw materials for the bioeconomy, wildlife habitat, soil erosion prevention, and carbon sequestration. The EU’s Forest Strategy for 2030 focuses on effective monitoring through the proposed new forest monitoring law50. This includes plans for a forest data collection framework that combines EO data (Copernicus satellites) and national forest inventories from EU member states. Additionally, a forest data sharing framework is proposed to ensure data is accessible for all. Currently, EO data can provide information on forest biodiversity, disturbances, characteristics, and productivity51.
Finally, rangelands, encompassing diverse ecosystems like drylands and savannahs, cover over 50% of the Earth’s land surface and are vital for achieving GGA Targets related to Food and Agriculture and Biodiversity. However, many global rangelands are degraded. A recent UNCCD study advocates for enhanced monitoring of rangeland conditions using EO and other data sources to improve adaptive management strategies52. EO is increasingly utilised in rangeland assessments, including studies on land degradation, employing remote sensing technologies and open-access data archives.
Developments relating to extreme events
Extreme events such as floods, droughts, heatwaves, storm surges, convective storms, and hurricanes pose significant challenges to communities worldwide. EO technologies offer a powerful tool for monitoring such events, providing insights across the different stages of the disaster risk management cycle, ranging from pre-event assessment to post-event recovery53.
EO-derived data and products are nowadays instrumental in the understanding and mapping of risk profiles associated with extreme events. Satellite data allow characterisation of land use and geographical characteristics, from globally available high-resolution altimetry data (Copernicus GLO-30) to the classification of in-land use types54,55 or coastal type areas56,57. These are relevant variables to inform physics-based models for describing extreme processes (e.g., flood models, coastal erosion, and other climate-driven hazards).
EO is also a key source of data for the quantification of vulnerability, through the mapping of inhabited areas58, building footprints59,60, roads61 to the mapping of critical infrastructure such as dams62. The construction of resilient infrastructure, management of essential resources systems (e.g., water management plans) or risk assessments often relate to extreme events through probabilistic analysis63. This involves informing mathematical models that relate probability, return periods, and intensity of events. Often, probabilities involved in the design of critical systems relate to orders of magnitude of 1/100s-1/10,000s64. Characterising such extreme events requires both formal observations (i.e., monitoring) and historical contextual data (e.g., paleohydrology, paleodendrology or historical non-formal records), and yet the tails of extreme probability distributions remain uncertain. This is further exacerbated by climate change and system change (e.g., temporal changes in land-use or regulation of systems, such as damming of rivers) which result in non-stationary processes. Under such conditions, past observations may not be fully representative of the present probability distributions. EO data provides a much denser and often frequent set of observations covering approximately 40-60 years (meteorological satellites and Landsat), and on a growing number of monitored variables more recently (e.g., high resolution optical data, interferometric aperture radar deformation monitoring, precipitation and cloud patterns, wildfire etc.) in the last decade. These observations are an invaluable source of data on climate processes that help refine extreme probability estimates and quantify the short to medium term variability.
Space-borne thermal sensors allow resolving surface temperatures at a much broader spatial scale than point meteorological stations, filling in the spatial gaps in sparsely covered areas and offering an alternative for urban heat island quantification65,66. The reach of flooding events is also often characterised based on SAR or optical monitoring67, along with drought anomalies, and many relevant processes on water quality and quantity68.
Finally, meteorological satellite constellations can monitor and support forecasting major storms and cyclone events. Through initiatives such as the EPS-Aeolus programme (https://www.eumetsat.int/eps-aeolus), operationalised direct measurements of winds using doppler wind lidars will significantly improve understanding and forecasting of extreme events such as hurricanes and dust storms. However, new EPS-Aeolus missions will not be launched until 2034, demonstrating the long lead up time required for launching new satellite missions.
Developments relating to health
The impacts of climate change on health are of increasing concern, particularly regarding heat extremes (e.g., heatwaves, hot days, tropical warm nights), infectious diseases (e.g., vector-borne and waterborne), and air pollution from wildfires. EO products are instrumental in monitoring these health-related hazards, especially in contexts where mapping at scale is challenging without EO data69,70,71.
In environmental health applications, EO is frequently used as a source of input variables integrated into models to produce hazard or exposure maps. While EO does not directly capture health outcomes, it provides critical proxies that inform health assessments at various levels: individual, household, cohort, or administrative. Therefore, it may help in disentangling less clear patterns of health impacts, when compared to the spatial incidence of the hazard72.
Health outcomes arise from complex interactions among environmental, socio-demographic, economic, and genetic factors73,74,75. Therefore, measuring the success of adaptation-focused policies requires a comprehensive approach that synthesises various components. For instance, policies targeting morbidity and mortality associated with heat stress may focus on modifying environmental conditions (e.g., improving urban infrastructure, increasing vegetation cover) and can be supported by EO observations. However, the final health outcomes (e.g., rates of heat-related morbidity and mortality) may not correlate directly with how the adaptation strategies affect the landscape morphology and local climate, due to confounding factors such as socio-economic status and access to healthcare.
Adaptation strategies concerning health can take many forms76. Urban greening initiatives, such as planting trees and creating green spaces, help mitigate the urban heat island (UHI) effect and can be measured through EO data. Satellite-derived vegetation indices (e.g., Normalised Difference Vegetation Index, NDVI) enable the assessment of changes in green cover over time, providing insights into the effectiveness of these interventions. In contrast, human behavioural changes (e.g., hydration practices, increased use of air conditioning, preventive measures against vector-borne diseases) necessitate assessments at the individual or community level.
EO is well integrated into climate-sensitive health outcome assessments, including heat stress, infectious diseases, and wildfire-related health impacts. Remote sensing data on air temperature, relative humidity, and land surface temperature (LST) can be used to assess the heat exposure of populations, especially in dense urban environments subject to the UHI effect77. Additionally, EO-derived data can track the spread of vector-borne diseases by mapping the geographical distribution of mosquito breeding sites and their correlation with environmental conditions such as temperature and precipitation78. EO and machine learning techniques have been combined to forecast some disease outbreaks, for example, forecasting the dengue incidence rate in Brazil79.
Finally, EO can indirectly enhance vulnerability and exposure assessments by providing data on population density, housing quality, and the presence of green spaces. For example, the Green Transition Information Factory Project (GTIF) in Austria exemplifies how EO data is used to assess urban greening initiatives, such as identifying green roofs and calculating a Green Roof Index to highlight areas for further development (https://gtif.esa.int/).
Concluding remarks and recommendations
EO has great potential for supporting climate action across all stages of the adaptation process, greater than what is already being achieved today. This paper focuses on four broad themes that connect closely with GGA targets: agriculture (which also integrated water aspects), biodiversity, extreme events (which integrates aspects of water, infrastructure, and poverty) and health. It examines how EO can contribute to all stages of the adaptation process, from risk assessment to monitoring and evaluation of adaptation measures.
The paper highlights EO’s strengths in providing objective, repeatable, and globally consistent data, while also acknowledging challenges related to data disaggregation, integration with socio-economic factors, and the need for long-term, robust baselines. Drawing parallels with the SDGs, we urge the GGA process to take the opportunity to leverage EO data effectively by integrating it into its process. Indeed, one of the considerations of the GGA indicators is data availability and/or exploration of potential data. One of the critical benefits of EO is accessibility and widespread availability of data and potential to combine multiple data.
The following recommendations are for the GGA process, EO agencies, and the scientific community to consider. These recommendations hope to encourage communities and stakeholders to establish a mechanism to leverage further action to more systematically support those who are vulnerable to climate change.
Recommendations to the GGA process
The GGA process should consider EO data and expertise in the decision-making process when selecting adaptation indicators. As argued in this paper, EO information, being only one line of evidence, must be used in combination with other data sources to create a comprehensive understanding of adaptation action. The experience with the SDG indicator framework suggests the need to take the opportunity to ensure, at their inception, a subset of indicators that can be derived using EO methods for targets with strong links to EO. This would provide global information accessible to all countries that would wish to use it, as it might be harder to introduce EO later on. If not done at inception, then the GGA process should be fluid enough to adapt the methodological and theoretical basis of adaptation indicators where and when needed.
Having EO scientists and space agencies participate in an expert capacity in the further discussions on how the indicators for the GGA targets are developed provides one possible channel to provide EO solutions to the UNFCCC work on indicators. The modalities for this work are now in progress, with experts from UN agencies, international and regional organisations, academic and research institutions, as well as Indigenous and Local Knowledge holders included as technical experts, based, i.e., on recommendations by governments and by these organisations. The technical work programme on indicators will certainly benefit from understanding the diverse ways in which EO data and agencies, those involved can help track progress on adaptation towards the seven thematic GGA targets. Tracking the four policy related targets of the GGA framework including potential data sources, is beginning to be discussed80.
Recommendations to EO agencies
There exists a landscape for EO-based agencies to catalyse how EO can be used to support adaptation action more systematically. Efforts should be focused on how to operationalise EO-based adaptation data and information to support end users’ needs. Lessons can and should be learned from past initiatives and where similar processes have existed, such as the development of essential climate variables by GCOS, defining their requirements (or minimum standards), and their eventual uptake into climate services, such as but not limited to the Copernicus Climate Change Service (C3S). New initiatives should be established once the final GGA indicators are agreed that develop standardised and operationalised resources for the indicators that are most supported by EO.
Developing operationalised adaptation indicators could be done in conjunction with developing a series of exemplar case studies within which adaptation responses are identified, monitored, and their impact quantified. Once the experimental contexts have been resolved, this then forms a basis around which to coordinate the development of context relevant, but inherently modular analytic workflows within a commonly agreed computational ecosystem (ideally open source). Whilst differing input EO data and climate data are likely to feature for each spatially and temporally distinct adaptation context, the same common processing steps would be involved, and the collective and modular nature of the development of these computational tools would ensure portability in terms of access/use, and transparency, and so trust in the user and consumer communities.
Recommendations to the research community
This paper highlights many knowledge gaps and barriers that limit EO’s current efficacy to support adaptation action to the fullest. These gaps and challenges provide opportunities for the scientific research community and funding agencies alike to address these issues and further scientific knowledge and development. These research needs include, but are not limited to:
Increase the development, availability, and accessibility to very high spatial and temporal resolution (with full uncertainty characterisation) products for local-scale applications and individualised exposure assessment, ideally for historical (pre-Sentinel era) time periods for baseline setting but also for future missions.
Ensure continuity of satellite-based ECV observations to continue to record the long-term climate data record.
Consider novel satellite missions that put adaptation at the centre of their objective.
Develop new indicators or metrics that can be developed from existing satellite data records, for example, through high resolution imagery, to track adaptation progress.
Include the disaggregation of indicators according to socio-economic and other groups in order to assess biases and ensure that vulnerable populations are not left behind.
Develop decision support applications customised for countries/ end users that aid making practical choices from the abundant sources of data products available. These tools must be developed by EO-experts together with end users and run by data stewards and knowledge brokers to ensure that the most appropriate, disaggregated data can be used by individuals who need it.
Develop new methods that combine EO data and digital twins that enable new forward-looking methods to project ideal climate adaptation progress.