
Goat ovaries and follicles collection
Thirty-six healthy female goats with uniform genetic backgrounds and rearing conditions were enrolled and divided into two groups: pre-pubertal (n = 9; 3 ± 0.1 months old) and post-pubertal (n = 27; 9 ± 0.1 months old). From the post-pubertal group, 18 goats were randomly selected for bilateral ovary removal and gentle follicle dissection. Using previously described methods [21], follicles were isolated and classified by diameter into three size categories (≤ 2 mm, 2–5 mm, and ≥ 5 mm), then immediately snap-frozen in liquid nitrogen for subsequent gene and protein analyses. The ovaries from the remaining animals (all pre-pubertal goats and the nine post-pubertal goats not used for follicle isolation) were collected in full. For each of these animals, one portion of ovarian tissue was fixed in Bouin’s solution for immunohistochemistry, while the remaining tissue was snap-frozen in liquid nitrogen for total RNA and protein extraction.
Cell culture and treatments
GCs were isolated from healthy follicles (2–5 mm in diameter) using a 24-gauge needle connected to a 5 mL syringe according to established laboratory protocols after ovarian collection from the slaughterhouse [21]. Cells were plated in different plates (6-well: 1 × 10⁶ cells/well; 12-well: 5 × 10⁵ cells/well; 24-well: 1 × 10⁵ cells/well; 96-well: 1 × 10⁴ cells/well) in DMEM/nutrient mixture F-12 (DMEM/F12) supplemented with 10% fetal bovine serum (FBS), 100 IU/mL penicillin, and 100 µg/mL streptomycin, and maintained at 37 °C in a humidified atmosphere containing 5% CO₂.
Goat NMB (RP10507, purity > 95% by HPLC analysis, GenScript Biotech) was utilized for cell treatments. GCs were seeded into 6-well plates, and treatments commenced when cells reached 50% − 60% confluency. Cells were exposed to fresh culture medium (Control) or medium supplemented with varying concentrations of NMB (10⁻¹⁰, 10⁻⁹, 10⁻⁸, 10⁻⁷, or 10⁻⁶ M) for 48 h; alternatively, they were treated with 10⁻⁷ M NMB for varying durations (3, 6, 12, 24, or 48 h). Based on the results, 10⁻⁷ M NMB with 24 h exposure was selected for subsequent experiments.
The NMBR antagonist PD168368 (MCE, HY-116216) was dissolved in dimethyl sulfoxide (DMSO) and stored at a stock concentration of 50 mM. For treatment, 1 µL of the stock solution or DMSO (vehicle control) was added per milliliter of medium, yielding final concentrations of 50 µM and 0.1% DMSO, respectively. When GCs reached 50% − 60% confluency, they were treated with either 50 µM PD168368 alone or 50 µM PD168368 in combination with 10⁻⁷ M NMB for 24 h [22], followed by sample collection and subsequent analysis.
RNA extraction, cDNA synthesis and gene clone
The total RNA was extracted from goat ovaries using TRIzol reagent (Vazyme, R401-01). RNA concentration was determined using the ND1000 spectrophotometer (Thermo Scientifific). RNA was reverse-transcribed into cDNA via the Primer Script RT reagent kit with gDNA eraser (TaKaRa Biotechnology). The cDNA samples were stored at −20 ℃ until use.
The cloning procedure was conducted according to established protocols with minor modifications [23]. Nucleotide sequence of PCR primers was listed in Table S1. Positive clones were randomly chosen and commercially sequenced through General Biological Technology (Beijing qingke biotechnology Ltd, China). The obtained nucleotide sequences of NMB and its two receptors were uploaded to NCBI. The similarity of amplified sequences and NCBI reference sequences was performed using BLAST (http://www.ncbi.nlm.nih.gov/blast). The phylogenetic tree analysis and homology assessments were performed using the neighbor joining and dislocation comparison method in MEGA-X software. Amino acid sequences were predicted with the Expasy Proteomics Server (http://www.expasy.ch/tools/dna.html) and then aligned with other species using GenomeNet (http://www.genome.jp/tools/clustalw). The accession numbers of NMB and its receptors for five species were listed in Table S2. The prediction of transmembrane domains was performed using TMHMM (http://www.cbs.dtu.dk/services/TMHMM-2.0).
Quantitative real-time polymerase chain reaction
Total RNA was extracted from the samples using TRIzol reagent (Vazyme, R401-01) according to the manufacturer’s instructions. First-strand cDNA was synthesized from 1 µg of total RNA using a reverse transcription kit (Vazyme, R323). Quantitative real-time PCR (qRT-PCR) with SYBR Green was performed on the ABI 7500 system (Applied Biosystems) using 50 ng of cDNA per reaction, derived from 1 µg of total RNA in a 20 µL reverse transcription system, following the manufacturer’s protocol. Amplification specificity was confirmed by melting curve analysis, and the relative mRNA expression levels of target genes were quantified using the 2−ΔΔCt method, normalized against glyceraldehyde-3-phosphate dehydrogenase (GAPDH) mRNA expression levels. All experiments were independently performed in triplicate, and the primer sequences for target gene amplification are provided in Table S3.
Western blot assay
Proteins were extracted from the samples using RIPA lysis buffer (Thermo Scientific, 89901), supplemented with both phosphatase and protease inhibitors (Beyotime, P1048) at a 1:50 (v/v) ratio, following the manufacturer’s instructions. The total protein concentration was determined with a BCA protein assay kit (Beyotime, P0010). Equal amounts of protein (20 µg) were separated by 4% − 20% polyacrylamide gel electrophoresis, transferred to polyvinylidene fluoride (PVDF) membranes (Millipore, ISEQ00010), and blocked with 5% skimmed milk. After overnight incubation with primary antibodies at 4 °C, the membranes were treated with secondary antibodies for 1 h at room temperature. Protein bands were visualized using the Western Bright ECL kit (Biosharp, No. BL520B-2) on an Image Quant LAS 400 system (Fiji film), and target protein quantification was performed with Image J software (Wayne Rasband), normalized to the internal control of GAPDH. Detailed information on antibodies used in this study is provided in Table S4.
Immunohistochemistry analysis (IHC)
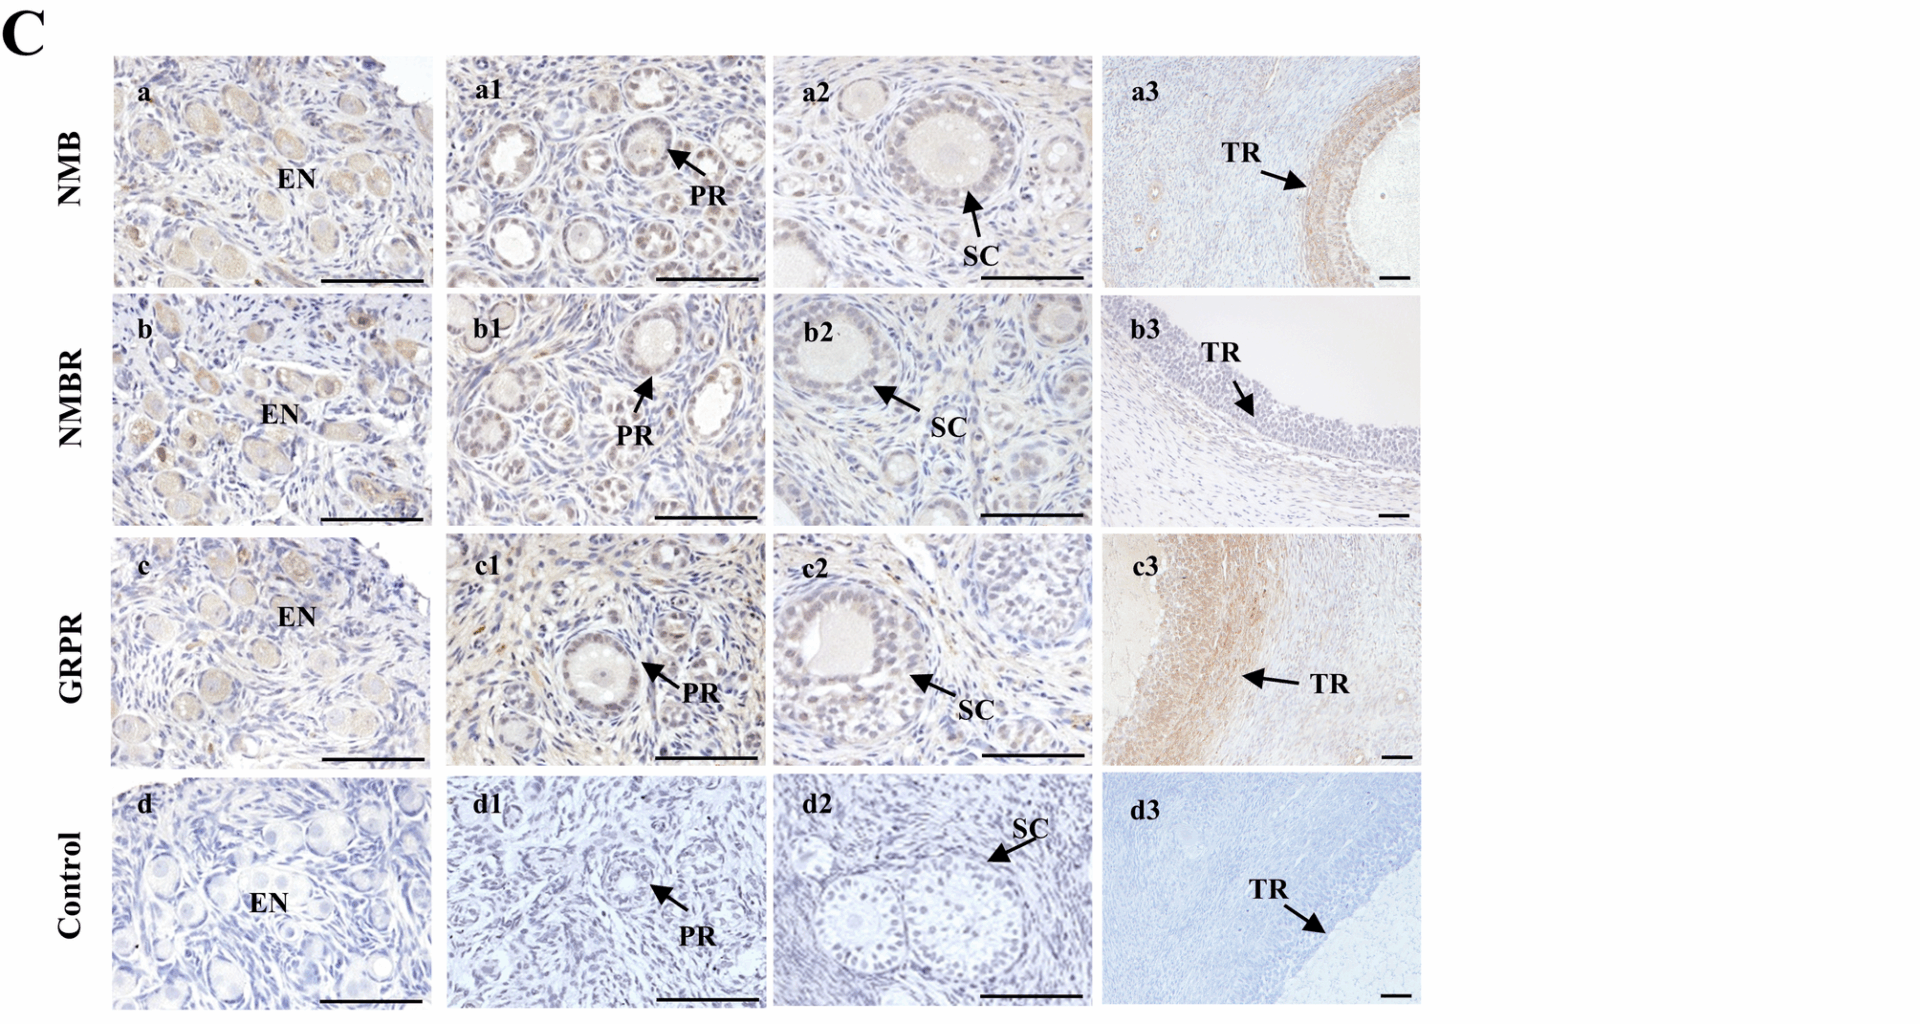
Goat ovaries were fixed, processed, and paraffin-embedded for sectioning as previously described [24]. Following dewaxing, antigen retrieval was performed on the sections according to the protocol of the M&R HRP/DAB Detection IHC Kit (Vazyme, HC301-01). After blocking endogenous peroxidase activity, the sections were incubated with primary antibodies at 4 °C overnight, followed by incubation with secondary antibodies at room temperature for 2 h. Subsequently, DAB chromogenic staining and counterstaining were carried out, and the sections were dehydrated and mounted. Negative controls were run by substituting 5% rabbit serum for the primary antibody. Brown-colored positive signals were visualized, and images were captured using a Nikon microscope (T300). Antibody details are listed in Table S4.
Immunofluorescence analysis (IF)
After treatment of goat GCs, the cells were fixed in 4% paraformaldehyde (PFA) (Beyotime, No. P0099), permeabilized with 0.5% Triton X-100, blocked with 5% bovine serum albumin (BSA), and then incubated with primary antibodies overnight at 4 °C. The next day, cells were incubated with secondary antibodies for 1 h, followed by nuclear staining with Hoechst 33258 (Yeasen, 40730ES03) for 10 min. Finally, coverslips were mounted onto glass slides, and images were captured using a confocal laser scanning microscope (Zeiss, LSM900). Positive signals appeared green, and negative controls were prepared by replacing the primary antibody with 1% rabbit serum. Details of antibodies for this study are provided in Table S4.
Live-cell fluorescence staining of goat GCs was performed using either a mitochondrial green fluorescent probe (Yeasen, 40742ES50) diluted to 500 nM working solution and incubated at 37 °C in the dark for 30 min, or an ER red fluorescent probe (Yeasen, 40764ES20) diluted to 1 µM working solution and incubated at 37 °C in the dark for 20 min, followed by nuclear staining with Hoechst 33258 for 10 min. For MAMs structure analysis, cells were first incubated with the ER red fluorescent probe working solution at 37 °C in the dark for 20 min, the solution was then removed, followed by incubation with the mitochondrial green fluorescent probe working solution at 37 °C in the dark for 30 min, and finally nuclear staining with Hoechst for 10 min. Images were observed and captured using a laser confocal microscope (Zeiss, LSM900), and quantitative assessment was performed with Image J software (Wayne Rasband).
Cell proliferation assay
Cell proliferation was assessed using the BeyoClick™ EdU-594 Cell Proliferation Detection Kit (Beyotime, C0078S). Briefly, cells were seeded into 24-well plates pre-placed with sterile cell slides and treated for the indicated durations. Subsequently, cells were incubated with 50 nM EdU working solution for 2 h, fixed with 4% PFA, washed with PBS containing 3% BSA, and permeabilized with PBS containing 0.3% Triton X-100. The Click reaction solution was then applied to the cells and incubated in the dark for 30 min. After washing, nuclei were counterstained with 5 µg/mL Hoechst. Finally, cells were mounted with anti-fade medium, sealed with coverslips, and imaged using a confocal laser scanning microscope (Zeiss, LSM900). Quantification of results was performed using ImageJ software (Wayne Rasband).
Cell cycle distribution analysis
Cell cycle analysis was performed via flow cytometry as follows: harvested cells were fixed overnight in ice-cold 70% ethanol, washed once with ice-cold dulbecco’s phosphate-buffered saline (DPBS), and stained with propidium iodide (PI) staining solution (Beyotime, C1052) prepared according to the manufacturer’s instructions, followed by incubation at 37 °C in the dark for 30 min. Red fluorescence emitted by PI-DNA complexes was detected at an excitation wavelength of 488 nm using a flow cytometer (Becton, Dickinson and Company).
Intracellular Ca2+ content determination
Intracellular Ca2+ levels were measured using a Calcium Colorimetric Assay Kit (Beyotime, S1063S). Briefly, after cell lysis, the supernatant was incubated with the working solution at room temperature in the dark for 10 min, while a standard curve was prepared in parallel using the provided standards. Absorbance was measured with a multimode microplate reader (Thermo Scientific), and Ca2+ concentrations in each sample were calculated based on the standard curve. The sensitivity of the kit ranges from 0.2 to 2 µg/mL, with both intra-assay and inter-assay coefficients of variation less than 15%.
Intracellular ER Ca²⁺ levels were measured using a commercial kit (BestBio, BB-481159). Briefly, after standard treatments, the culture medium was removed, and cells were washed three times with Hank’s balanced salt solution (HBSS). Subsequently, cells were incubated with BBcellProbe® C93 staining working solution at 37 °C for 45 min, followed by three additional HBSS washes. Cells were then covered with HBSS and incubated again at 37 °C for 30 min. Mitochondrial Ca²⁺ levels were assessed using another kit (Beyotime, S1062S). In brief, after treatments, the medium was discarded, cells were washed three times with HBSS, and Rhod-2 staining solution was added. Cells were incubated at 37 °C for 20 min, after which the supernatant was removed, and cells were washed three times. Fluorescence images were captured using a laser scanning confocal microscope (Zeiss, LSM900), and the average fluorescence intensity of each image was quantified with Image J software (Wayne Rasband).
Small interfering RNA transfection
The negative-control (siNC) and XBP1S-targeting siRNAs (siRNA-114, siRNA-215, siRNA-340, and siRNA-610/siXBP1S) were purchased from Genepharma. When GCs reached approximately 60% confluency, transfection was carried out in a final volume of 1 mL culture medium. According to the manufacturer’s protocol (Lipofectamine™ 3000, Invitrogen, L3000150), 7 µL of Lipofectamine™ 3000 reagent and siRNA (final concentration: 140 nM) were added to the medium. Cells were harvested 48 h post-transfection for analysis. The sequence information of the siRNAs is listed in Table S5.
Transmission electron microscopy analysis
The GCs were fixed with 2.5% glutaraldehyde (in 0.1 M PBS, pH 7.4) at 4 °C for 4 h, followed by dehydration through a graded ethanol series. Samples were embedded in resin, sectioned into ultrathin slices, and dual-stained with uranyl acetate-lead citrate. Mitochondrial morphology, ultrastructural changes, and MAMs integrity were observed using TEM. Image J quantified mitochondrial aspect ratio and MAMs contact points. The fraction of mitochondria in contact with ER within a 50 nm range was calculated and normalized to the mitochondria perimeter, as previously described [25].
Co-immunoprecipitation (CO-IP)
Immunoprecipitation was performed using an immunoprecipitation kit (Proteintech, PK10008). Cultured GCs were lysed using lysis buffer according to the manufacturer’s protocol, followed by incubation with the specific antibody against IP3R (ABclonal, A21471) under rotation at 4 °C overnight. Subsequently, pre-resuspended Protein A/G beads slurry was added to precipitate the immune complexes, which were further incubated under rotation at 4 °C for 4 h. After washing, the complexes were eluted, and the eluate was mixed with alkali neutralization buffer and 5× sample buffer, heated in boiling water for 5 min, and analyzed by western blotting for the input lysates.
Mitochondrial membrane potential assay(JC-1)
According to the manufacturer’s protocol (Solarbio, M8650), treated GCs were incubated with JC-1 staining working solution and thoroughly mixed. The cells were then maintained in a cell culture incubator at 37 °C for 20 min. After washing twice with JC-1 buffer (1×), live cells were imaged on a confocal laser scanning microscope (Zeiss, LSM900). JC-1 aggregates (red) indicate high mitochondrial membrane potential; monomers (green) indicate depolarization. Rapid-exposure confocal images were quantified to the mean fluorescence intensities of arbitrary regions through ImageJ (Wayne Rasband).
Reactive oxygen species assay(ROS)
According to the manufacturer’s protocol (Beyotime, S0033S), treated GCs were incubated with DCFH-DA diluted to a final concentration of 10 µM and thoroughly mixed. The cells were then maintained in a cell culture incubator at 37 °C for 20 min. After washing twice with DPBS, cells were imaged using a confocal microscope (Zeiss LSM900). Green fluorescence intensity directly correlates with intracellular ROS levels. ImageJ (Wayne Rasband) was used to quantify mean fluorescence intensity from randomly selected fields.
Mitochondrial complex reductase activity assay (MRC)
According to the manufacturer’s protocols for mitochondrial respiratory chain complexes I, II, III, IV, and V (Solarbio, BC0515, BC3235, BC3245, BC0945, BC1445, respectively), the complexes were extracted from collected cells, incubated with their respective working solutions, and the absorbance was measured using a multifunctional microplate reader (Thermo Scientific). The activity levels of the complexes in the samples were subsequently calculated, and expressed as U/mg protein.
Statistical analysis
All experiments were repeated at least three times. Statistical analyses were analyzed with SPSS 24.0 (SPSS Inc., IL, USA). Shapiro-Wilk test was used to determine the normality of data. F test (two groups) and Brown-Forsythe test (three or more groups) were used to test the homogeneity of variance. Continuous variables with normal distribution were presents as mean ± SEM. Data with normal distribution were compared using Student’s t-test for two groups, and one-way analysis of variance (ANOVA) with Tukey’s or Dunnett’s post-hoc analyses were employed for comparisons involving three groups or more. A value of p < 0.05 are considered as statistically significant.