
Concept and experimental workflow
Figure 1 shows the conceptual scheme and the experimental setup of the polarization-sensitive off-axis holography system used for measuring the optical activity. The optical platform (Fig. 1a; extended description is provided in Supplementary Note 1 and Supplementary Fig. 1) is a modified Mach–Zehnder interferometer with two separate beam paths, corresponding to a sample and a reference one. In the sample-beam path, the polarization of light is controlled such that linearly polarized light with a rotating plane of polarization illuminates the sample. In the reference-beam path, a Wollaston prism followed by a quarter-wave plate splits the beam into two spatially separated orthogonal polarization states corresponding to LCP and RCP. Each of the reference beams only interferes with the corresponding component, either LCP or RCP, of the sample beam. A non-polarizing beamsplitter then combines the two references beam together with the sample beam to generate a hologram at the imaging plane of the camera. When linearly polarized light, which can be decomposed into equal parts of LCP and RCP light, illuminates a chiral sample, the state of polarization changes from linear to elliptical with a tilted plane of polarization due to the combined effects of CD and ORD (Fig. 1b). CD changes the polarization from linear to elliptical, as one component (either RCP or LCP), will be absorbed more than the other. However, ORD tilts the plane of polarization, as one component (RCP or LCP) will experience a greater phase delay. To retrieve the amplitude and phase of the LCP and RCP components separately and, therefore, single-shot measure the CD and ORD, the sample beam interferes with the two reference beams at different angles, thereby encoding the contributions into different spatial frequencies (Fig. 1c), allowing for multiplexed detection. The hologram shows interference fringes at these two spatial frequencies (Fig. 1d) and its Fourier transform reveals the diagonally shifted first-order diffraction terms from the LCP and RCP references (Fig. 1e). Simultaneously recording the LCP and RCP images not only removes strongly correlated fluctuations by dividing the two (Supplementary Fig. 3) but also makes the measurements robust against laser instabilities and other fluctuations in the system, which are common when separate measurements must be taken to retrieve both LCP and RCP signals.
Fig. 1: Principle and experimental setup for spatially resolved optical activity measurements.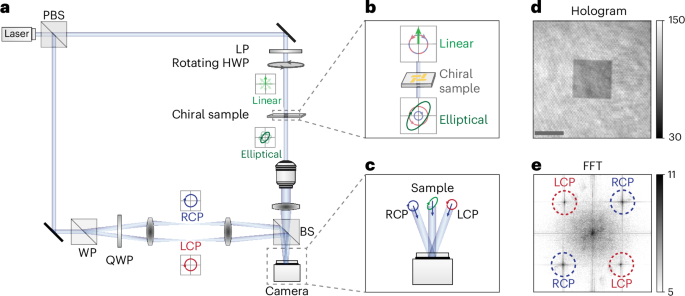
a, Experimental setup of the polarization-sensitive off-axis holography system. b, Linearly polarized light can be decomposed into LCP and RCP at equal amplitudes. After passing through a chiral sample, the initial linear polarization is transformed into elliptical polarization with a tilted plane of polarization. c, The two reference beams, one in the LCP state and one in the RCP state, interfere with the sample beam at different angles, leading to multiplexed hologram encoding. d, Hologram of an array of chiral nanostructures. Scale bar, 50 mm. e, Fourier transform of the hologram. The contributions corresponding to the LCP and RCP components are spatially isolated (as indicated by the dashed circles). PBS, polarizing beamsplitter; WP, Wollaston prism; QWP, quarter-wave plate; BS, beamsplitter; FFT, fast Fourier transform; HWP, half-wave plate; LP, linear polarizer.
Figure 2 outlines the workflow to retrieve CD and ORD images from a single hologram (Supplementary Fig. 4). The hologram as recorded by the camera (Fig. 2a) shows two arrays of chiral nanostructures of different handednesses with a unit-cell design depicted in the insets (Supplementary Fig. 5 shows the design), neither of which can be differentiated from the hologram alone. The C4-symmetric nanostructures are arranged in a square lattice to suppress linear anisotropies35,36,37. To retrieve the ORD and CD, the hologram is first Fourier transformed (Fig. 1e). Due to the off-axis configuration in the experimental system, the first-order diffraction terms from the LCP and RCP reference beams diagonally shift the respective LCP and RCP contributions away from the zero-order diffraction term, spatially separating them from each other. Spatially filtering the LCP and RCP components independently (Fig. 1e, dashed circles), by hard aperture selection followed by phase shifting, isolates each individual contribution. Next, inverse Fourier transforming the demodulated LCP and RCP contributions retrieves the spatially resolved complex electric field expressed in terms of amplitude and phase images of the two orthogonal polarization states (Fig. 2c,d). Then, to account for the non-uniform illumination profile, the amplitude and phase images are referenced to images taken on an empty sample area (Methods). Finally, to recover the respective CD and ORD images, the ratio between the LCP and RCP amplitude images (Fig. 2e) and the difference between the LCP and RCP phase images (Fig. 2f) are obtained. More details about the calculation of the CD and ORD signals and unit conversions are provided in Supplementary Note 2. Compared with the initial hologram, both CD and ORD images show opposite signals for the chiral nanostructure arrays, allowing to differentiate between the left- and right-handed versions.
Fig. 2: Data workflow from a hologram to CD and ORD images.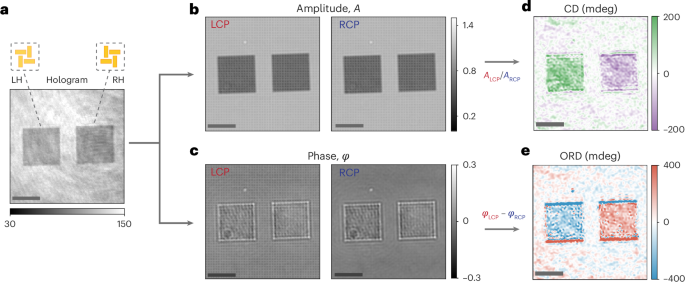
a, A hologram as recorded by the camera. The two dark squares are arrays of left- and right-handed chiral nanostructures, with a unit-cell design as shown in the insets. b, Amplitude images of the LCP (left) and RCP (right) components. c, Phase images of the LCP (left) and RCP (right) components. d, CD image obtained by taking the ratio of the LCP and RCP amplitude images. e, ORD image obtained by taking the difference between the LCP and RCP phase images. The measurements were acquired at a wavelength of 690 nm. Scale bar, 50 μm.
Suppression of linear anisotropy contributions
When measuring the chiral nanostructures, contributions from linear anisotropies, in the form of LD and LB, can lead to strong artefacts that can fully mask the CD and ORD responses (Supplementary Note 3). The dependence of LD and LB on the linear plane of polarization, contrasted with the independence of CD and ORD to it, provide an experimental route to minimize this artefact38,39. To suppress linear anisotropy artefacts, we rotated the illumination plane of linear polarization and subsequently averaged over all the different polarization states. To demonstrate that this removes linear anisotropy effects, we fabricated two sets of achiral yet orthogonal nanostructures exhibiting strong linear anisotropy as a control. The structures were based on the same design as the chiral structures shown above, but with C2 rather than C4 symmetry, practically resulting in vertically and horizontally aligned nanorods (Fig. 3a). Measuring the CD and ORD as a function of the rotated plane of incident polarization led to a periodically varying signal, with horizontally and vertically aligned rods exhibiting an inverted response with respect to each other (Fig. 3b). To suppress these linear contributions, we averaged over the scanned range of polarization angles. Figure 3c shows the corresponding CD and ORD responses on increasing the number of polarization angles averaged. The shape of the response corresponds to decaying oscillations with a period of 180° (or one period of the curve shown in Fig. 3b), with the magnitude of both signals reaching a minimum at each 180° interval. Although it suffices to average over an angle range of 180° to suppress the linear anisotropy contributions, including more periods leads to a more robust suppression over a boarder range of angles, demanding less fine control over the absolute polarization state of illumination (Supplementary Note 4). Figure 3d shows the resulting CD and ORD images after averaging over the full range of polarization angles (720°). These results clearly show that although LD and LB contributions can mask the CD and ORD signal, these linear anisotropy effects can be suppressed experimentally by rotating the plane of incident polarization to retrieve the underlying weak CD/ORD signals. Although this approach reduces linear anisotropy effects, it assumes exceptionally clean and uniformly sampled polarization states, as well as identical nanostructures that are perfectly aligned and free of fabrication defects. In practice, these conditions are not fully met, leading to residual CD and ORD signals due to anisotropy artefacts40.
Fig. 3: Suppression of linear anisotropy effects.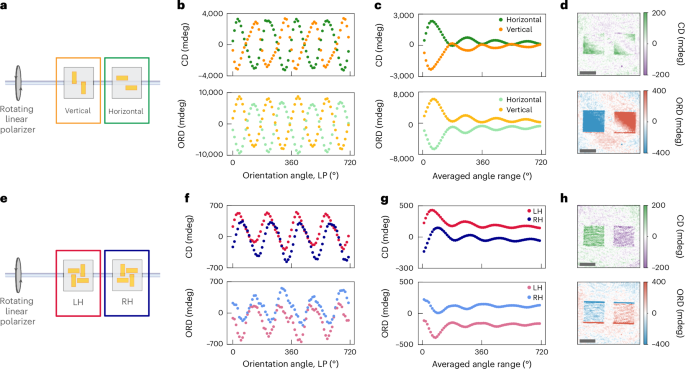
a,e, Sketch of the measurement principle: a linear polarizer rotates the plane of polarization when measuring the samples of vertically and horizontally linear nanorods (a) or left- and right-handed chiral structures (e). b,f, CD (top) and ORD (bottom) signals of the linear nanorods (b) and chiral samples (f) when rotating the plane of polarization. Each point represents the average signal on the array of nanostructures in the corresponding image. c,g, Averaging the CD (top) or ORD (bottom) signal for each sample independently over a certain rotation angle range until two full rotations are averaged. Each point represents the average signal on the array of nanostructures in the image averaged over the given angle range. d,h, CD (top) and ORD (bottom) images after averaging two full rotations (all the angles shown in b and f) of the linear structures (d) and chiral structures (h). LH, left handed; RH, right handed. The measurements were performed at a wavelength of 690 nm. Scale bar, 50 μm.
To validate the compatibility of this approach with chiral nanostructures, we repeated the experiments on the chiral sample (Fig. 3e). Much like the achiral linear sample, the CD and ORD signals also varied periodically with the orientation angle of incident polarization, although with a notably weaker amplitude (Fig. 3f). However, unlike the linear sample, the left- and right-handed chiral structures followed a similar behaviour with no inversed behaviour with respect to each other. This highlights that the periodic variation stems from linear anisotropy contributions, as these should affect both left- and right-handed structures similarly. Averaging over the measured angle range suppresses the linear anisotropy contributions (Fig. 3g) and produces CD and ORD images of these structures free from linear anisotropy artefacts (Fig. 3h).
Spectrally resolved optical activity imaging
To capture how optical activity varies across wavelengths, we spectrally resolved the optical activity of the chiral nanostructures, presented above, from 550 nm to 800 nm by tuning the illumination wavelength in 10-nm steps. In addition to the left- and right-handed arrays, we also measured a racemic one, composed of alternating left- and right-handed chiral elements, as a reference. Such racemic arrays have been used in chiral molecular sensing applications to cancel out plasmonic CD contributions41. Figure 4a–c displays example images at three different wavelengths. At 650 nm, the left- and right-handed chiral structures show strong opposite ORD signals and zero CD signals, respectively (Fig. 4a). At 690 nm, the chiral arrays show both CD and ORD signals (Fig. 4b). At 720 nm, the left- and right-handed structures exhibit strong opposite CD signals and almost zero ORD signal (Fig. 4c). The racemic arrays show close-to-zero signals in CD and ORD images for all the wavelengths. To obtain the spectra from these images, we extract the average signal of the area containing the chiral nanostructures at each wavelength. Figure 4a shows the resulting CD and ORD spectra from the left- and right-handed structures, both of which exhibit the characteristic opposite signal expected from enantiomeric pairs. Additionally, the CD and ORD spectra show the typical relative behaviour among them, namely, with peaks in CD coinciding with zero crossings in ORD and vice versa. To validate the accuracy of the retrieved spectra from our platform, Fig. 4a (top, solid lines) compares the CD spectra taken via conventional CD spectroscopy (Methods and Supplementary Note 4). Both data show excellent agreement, highlighting that our platform delivers quantitative results consistent with conventional methods.
Fig. 4: Optical activity spectroscopy.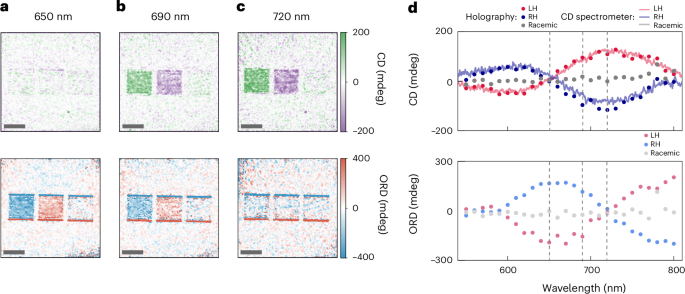
a–c, CD (top) and ORD (bottom) images of the left-handed, right-handed and racemic arrays (from left to right) at different wavelengths: 650 nm (a), 690 nm (b) and 720 nm (c). d, CD (top) and ORD (bottom) spectra of the chiral nanostructures measured with polarization-sensitive holography (dots). Each dot represents the averaged signal on the array of nanostructures in the corresponding image. Top: solid lines correspond to the CD spectra acquired with a conventional CD spectrometer as a comparison. The dashed lines indicate the wavelengths of the CD and ORD images shown in a–c. Scale bar, 50 μm.
To highlight the importance of spatially resolved optical activity measurements, we utilized chiral samples with spatially varying handedness. Specifically, we designed arrays with substructures of left- and right-handed nanostructures embedded within a racemic mix. Figure 5a illustrates this design, with the letters ‘L’ and ‘R’ encoded in the left- and right-handed unit cells, whereas the surrounding array forms a racemic background. In non-chiral imaging, all structures appear identical and indistinguishable. Conversely, optical activity imaging clearly differentiates left- and right-handed structures, thereby decoding the letters ‘L’ and ‘R’ from the heterogeneous nanostructure array. Figure 5b–d presents the optical activity images at various wavelengths. At 655 nm, the ORD image reveals the letters, whereas the CD image does not (Fig. 5b). At 690 nm, both images make the letters identifiable (Fig. 5c). At 720 nm, the letters are only visible in the CD channel (Fig. 5d). These results demonstrate how the decoding of the letters varies depending on the wavelength, reflecting the distinct behaviours of CD and ORD.
Fig. 5: Image decoding.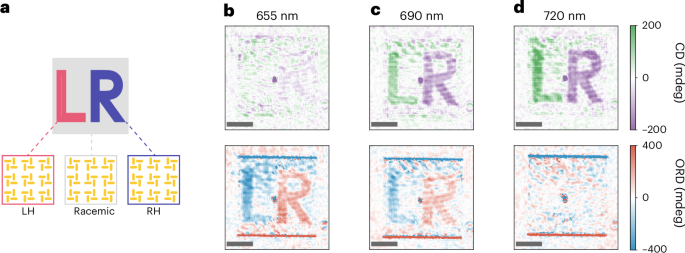
a, Sample of chiral nanostructures with the letter L and R encoded in the left- and right-handed structures, respectively, and the remaining of the array consisting of a racemic mixture. b–d, CD (top) and ORD (bottom) images at different wavelengths: 655 nm (b), 690 nm (c) and 720 nm (d). Scale bar, 50 μm.
Further, our platform can spatially resolve local chiral variations and quantify them in terms of enantiomeric excess. To illustrate this, we measured arrays with varying ratios of left- and right-handed structures. Starting from a fully left-handed array, the percentage of right-handed nanostructures gradually increased in six steps until the array became fully right handed. The nanostructures were arranged into domains, with the total area reflecting the enantiomeric excess (Fig. 6a shows the design). The retrieved CD images clearly resolved these distinct domains of left- and right-handed structures (Fig. 6b). The repeated patterns observed across multiple panels in the CD images of Fig. 6b,e are probably artefacts resulting from a referencing issue. Averaging over the entire array shows a linear dependence on the ensemble CD signal with enantiomeric excess as the array shifts from a fully left-handed one to a fully right-handed one (Fig. 6c; dots and line). We then quantified the corresponding area of left-handed and right-handed domains for each array, showing excellent agreement with the designed percentages of each type, for example, enantiomeric excess of the array (Fig. 6c; bars).
Fig. 6: Arrays with different spatial distributions of left- and right-handed structures.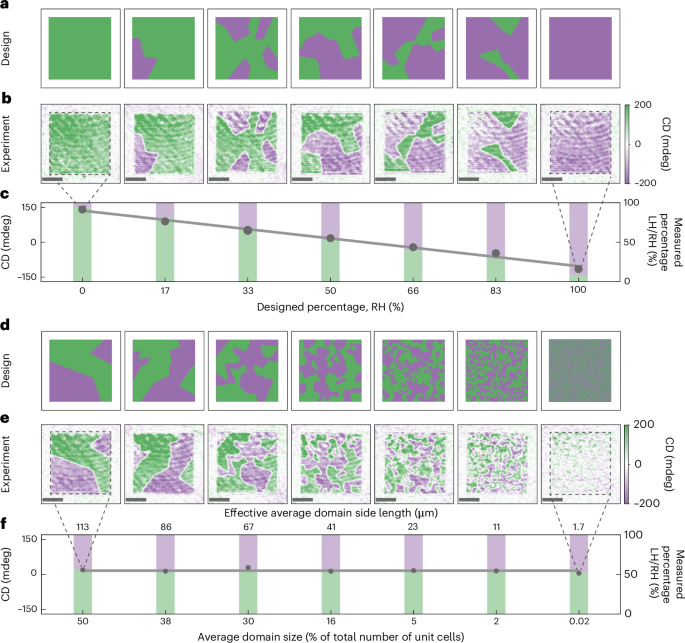
a,b, Design (a) and CD images (b) of arrays with a changing ratio between left- and right-handed nanostructures. c, Dots and line: averaged CD signal of the areas of the arrays shown in a and linear fit (R2 = 0.99; left y axis). Bars, percentage of the area of array measured with a left-handed (green) or right-handed (purple) signal (right y axis). d,e, Design (d) and CD images (e) of arrays with increasing disorder in the distribution of left- and right-handed structures. All the arrays have 50% left-handed and 50% right-handed structures. f, Dots and line: averaged CD signal of the areas of the arrays shown in c and line showing the average value of all arrays (left y axis). Bars, percentage of the area of array measured with a left-handed (green) or right-handed (purple) signal (right y axis). The measurements here were performed at a wavelength of 720 nm. Scale bar, 50 μm.
To further emphasize the importance of spatial resolution when measuring the chiral samples, we measured arrays with a fixed 50:50 ratio of left- and right-handed structures but with their distributions varying in domain size (Fig. 6d). Figure 6e shows how our CD imaging approach clearly resolves the domains within the array, except for the fully random array, where no distinct domains are visible, as the domains are below the resolution limit of our system (Supplementary Note 6 provides a quantitative resolution analysis using arrays with decreasing side lengths). Despite the varying domain sizes, the ensemble-averaged CD signal for the array across all the distributions consistently yields the same value (mean, 16.3 ± 6.6 mdeg; Fig. 6d, line). Spatial analysis of the proportions of left- and right-handed structures in each image confirms the fabricated 50:50 distribution. This underscores that traditional CD measurements, which only provide average values, offer limited insight, and spatial analysis is critical for heterogeneous samples.