WMO’s announcement was timed to coincide with the release of global temperature announcements from the dataset providers.
These include the European Center for Medium Range Weather Forecasts Copernicus Climate Change Service (ERA5), Japan Meteorological Agency (JRA-3Q), NASA (GISTEMP v4), the US National Oceanic and Atmospheric Administration (NOAAGlobalTemp v6), the UK’s Met Office in collaboration with the Climatic Research Unit at the University of East Anglia (HadCRUT.5.1.0.0), and Berkeley Earth (USA). This year, for the first time, WMO also factored in two additional datasets – the Dynamically Consistent ENsemble of Temperature (DCENT/UK, USA) and China Merged Surface Temperature Dataset (CMST).
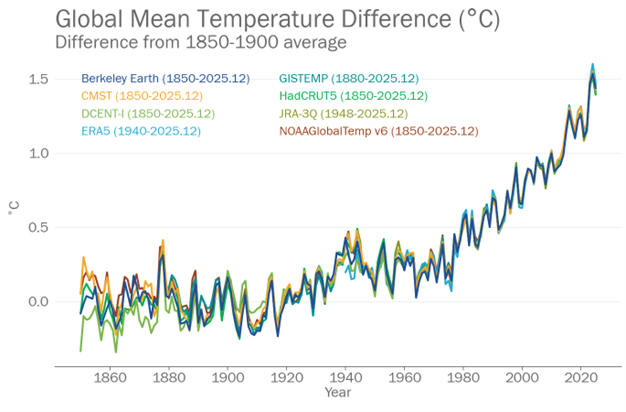
Figure 1: Annual global mean temperature anomalies relative to the 1850-1900 average shown from 1850 to 2025 for eight datasets as shown in the legend.
Six of the datasets are based on measurements made at weather stations and by ships and buoys using statistical methods to fill gaps in the data. Two of the datasets – ERA5 and JRA-3Q – are reanalyses which combine past observations, including satellite data, with models to generate consistent time series of multiple climate variables including temperature. The key datasets all use slightly differing methodologies and so have slightly different temperature figures, and even annual rankings.
2025 was ranked the second warmest in DCENT and GISTEMP; third warmest in the other six, Berkeley Earth, CMST, ERA5, HadCRUT5, JRA-3Q, and NOAAGlobalTemp.
The actual average global temperature in 2025 was estimated to be 15.08 °C- however there is a much larger margin of uncertainty on the actual temperature at around 0.5 °C than on the temperature anomaly for 2025.
WMO – the UN agency for weather, climate and water – seeks to provide a consolidated authoritative analysis to support decision-making.
Ocean Heat
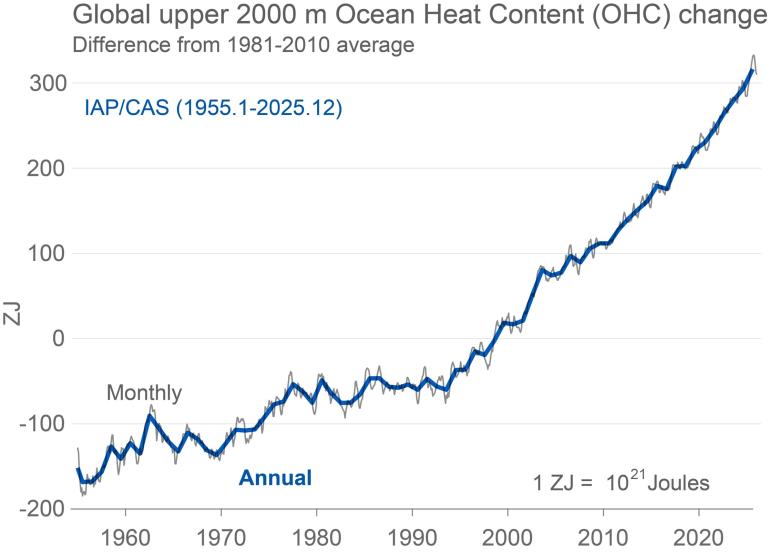
A separate study published in Advances in Atmospheric Sciences said that ocean temperatures were also among the highest on record in 2025, reflecting the long-term accumulation of heat within the climate system.
About 90% of excess heat from global warming is stored in the ocean, making ocean heat a critical indicator of climate change. From 2024-2025, the global upper 2000 m ocean heat content (OHC) increased by ∼23 ± 8 Zettajoules relative to 2024, according to the study led by Lijing Cheng with the Institute of Atmospheric Physics at the Chinese Academy of Sciences. That’s around 200 times the world’s total electricity generation in 2024.
Regionally, about 33% of the global ocean area ranked among its historical (1958–2025) top three warmest conditions, while about 57% fell within the top five, including the tropical and South Atlantic Ocean, Mediterranean Sea, North Indian Ocean, and Southern Oceans, underscoring the broad ocean warming across basins.
The study found the global annual mean sea surface temperature (SST) in 2025 was 0.49 °C above the 1981–2010 baseline and 0.12 ± 0.03 °C lower than in 2024, consistent with the development of La Niña conditions, but still ranking as the third-warmest year on record.