
Genome data set
A total of 87 horse archaeological remains, including petrosal bones, teeth and postcranial elements, were extracted for DNA at the CAGT ancient DNA facilities (Toulouse, France) (Fig. 1; Supplementary Data 1). Low-depth sequencing of triple-indexed DNA libraries on the Illumina MiniSeq instrument revealed 26 females and 61 males showing endogenous DNA content compatible with relatively economical genome characterization by shotgun sequencing (median = 27.21%, range = 2.03–89.75%) (Supplementary Data1). mapDamage220 base compositional profiles, and PMDtools21 nucleotide mis-incorporation profiles, were aligned with the molecular tools used for generating ancient DNA sequences, including USER enzymatic treatment and DNA library construction22, supporting data authenticity (Supplementary Figs. 1, 2 and 3). A total of 18.46 billion read pairs were produced on Illumina HiSeq4000 and NovaSeq 6000 instruments, of which 4.55 billion could be uniquely aligned with confidence against the horse reference genome, resulting in genome depth-of-coverage values between 0.10-fold and 4.12-fold (median = 0.97-fold; Supplementary Data 1).
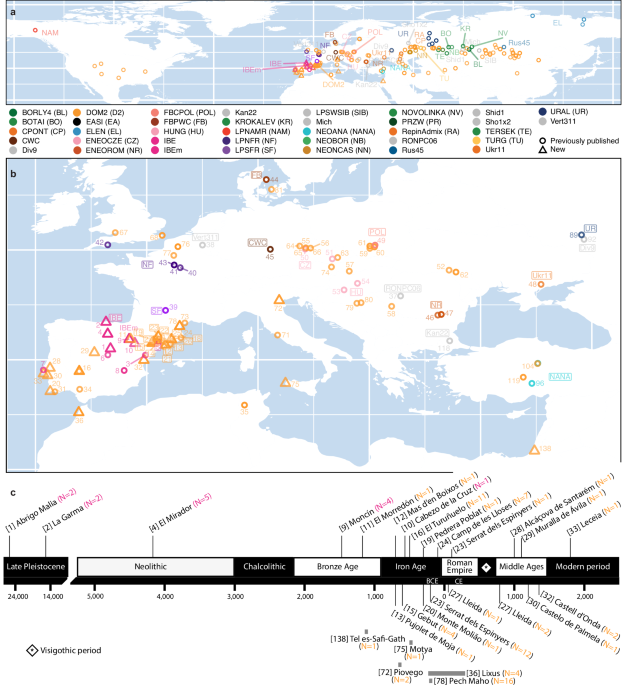
Fig. 1: Geographic locations and genetic group labels associated with the samples studied.
a Worldwide distribution of the horse genome panel analyzed in this study, restricted to 347 ancient specimens (Supplementary Data 1). Those specimens sequenced for the first time or previously reported are shown with open triangles and circles, respectively. Group labels are defined and coloured according to previous studies, with short names indicated between brackets. b Zoom across Europe and the Mediterranean range. Numbers refer to individual archaeological sites, as indicated in Supplementary Data 1. Some of the numbers pointing to northeastern Iberian sites are framed to enhance visibility. c Schematic representation of the Iberia timeline cultures. Newly sequenced samples from outside Iberia are shown at the bottom, with grey bars representing underlying chronologies.
The vast majority of the newly characterized genomes originated from Iberia (N = 63) with the remaining 24 originating from specimens excavated in France (N = 16), Italy (N = 3), Morocco (N = 4) and Israel (N = 1), to map possible Iberian genetic affinities and trade networks across the Mediterranean (Fig. 1b, c). The new genomes covered the Late Pleistocene (N = 4; ~25,265–14,179 BCE) to the Modern Period (N = 1; >1656 CE), with a majority, however, belonging to the Iron Age (N = 48), Roman Republic (N = 11), and the Roman Empire/Late Antiquity time periods (N = 5). The newly characterized genomes were combined with a total of 261 ancient horse genomes previously characterized encompassing the whole range of genetic lineages found across Eurasia (Fig. 1a; Supplementary Fig. 4; Supplementary Data 1). They were supplemented with the genomes of 83 modern domestic breeds from around the world, one modern and one historical Przewalski’s horse, and two donkey outgroups, to investigate the genetic landscape of Iberian horses from before and after the Last Glacial Maximum (LGM; 26.5-20/19 kyrs cal. Before Present (BP))23, as well as their possible legacy to the present day.
IBE survived in Iberia throughout LGM to the Iron Age
Pseudo-haploidization of sequence data led to the recovery of 7.12 million autosomal transversion positions in at least 80% of specimens considered, including donkey outgroups (median missingness = 7.614%; range = 0.003–92.890%). Principal Component Analysis (PCA), excluding outgroups and divergent Late Pleistocene American horses, revealed that the majority of the newly sequenced specimens (N = 73) co-plotted with DOM2 (D2) (Fig. 2a, Supplementary Figs. 5, 6 and 7). Strikingly, the remaining 14 specimens occupied the most positive and negative scores along Principal Components 1 and 2 (PC1 and PC2), respectively, together with previously identified IBE horses2. PC2 scores discriminated mostly those lineages from the Ural Mountains (UR), Central Asia (BOTAI, BO; BORLY4, BL; NEOBOR, NB; NOVOLINKA, NV; KROKALEV, KR, and; TERSEK, TE), to northeastern Siberia (Equus lenensis, EL) (Supplementary Data 1).
Fig. 2: Autosomal genetic affinities.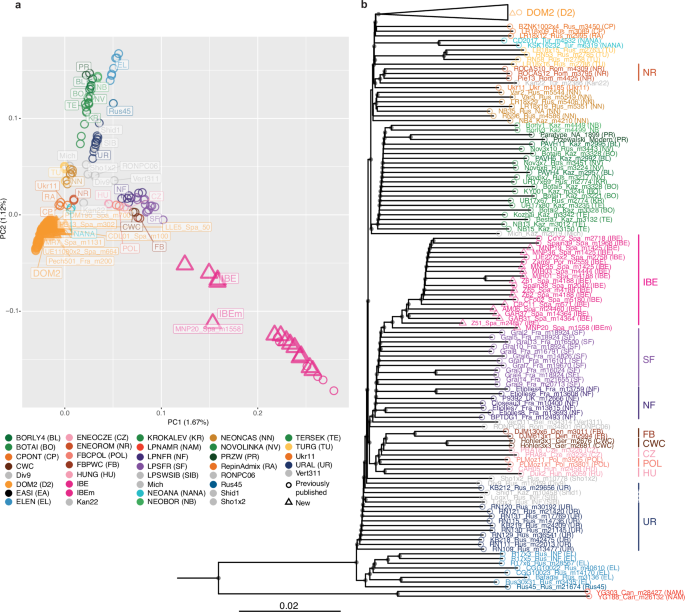
a Principal Component Analysis (PCA) of 431 ancient and modern specimens based on unlinked autosomal transversions (MAF = 1%). The first two principal components summarize 1.67% and 1.12% of the total genetic variation, respectively. b Neighbor-Joining phylogenetic tree based on the full set of autosomal transversions. Node support was assessed from 100 bootstrap pseudo-replicates, and is indicated if greater or equal to 80%. The DOM2 clade (N = 311) was collapsed for readability (see Supplementary Fig. 8 for the full tree). Colours and symbols are according to Fig. 1a.
Autosomal Neighbor-Joining phylogenetic reconstruction confirmed that the members of the IBE cluster formed a monophyletic group, receiving maximal (100%) bootstrap support (Fig. 2b; Supplementary Fig. 8). One Middle Bronze Age mare from Moncín (MNP20_Spa_m1558), however, slightly deviated from the other PCA cluster members. It was the first to diverge within the IBE phylogenetic clade, potentially reflecting a more complex genomic make-up.
The autosomal phylogeny also confirmed that several lineages of various genetic affinities once inhabited Europe. IBE showed closest affinities to lineages of Late Pleistocene from southern France (SF), as well as from northern France and Britain (NF). Another related cluster, more divergent from IBE, was also formed by horses from the fourth to third millennium BCE of Denmark (FB), Germany (CWC), Poland (POL), and the Carpathian basin (Czechia, CZ, and; Hungary, HU) (Fig. 2b; Supplementary Fig. 8).
The mitogenome phylogeny displayed, however, a different pattern compared to the autosomal phylogeny, in line with previous reports indicating incomplete lineage sorting and limited phylogeographic resolution for mitochondrial DNA in horses24. Interestingly, the majority of specimens showing autosomal affinity to IBE, including the distinctive MNP20_Spa_m1558 specimen, grouped together within three strongly supported mitochondrial clusters, showing SF or NF members as their closest relatives (Fig. 3a, Supplementary Fig. 9). In contrast, all of the eight newly characterized IBE male specimens grouped together with the three previously sequenced, forming a Y chromosomal clade supported by 100% bootstrap values (Fig. 3b, Supplementary Fig. 10). The latter cluster also included a specimen from Denmark (DJM130x6_Den_ m3011; FB), dated to the transition of the fourth-to-third millennium BCE. This specimen was known for carrying one of the most divergent Y chromosomal haplotypes in Eurasia2,4, now linking to IBE.
Fig. 3: Maximum Likelihood (ML) phylogenetic relationships for uniparental markers.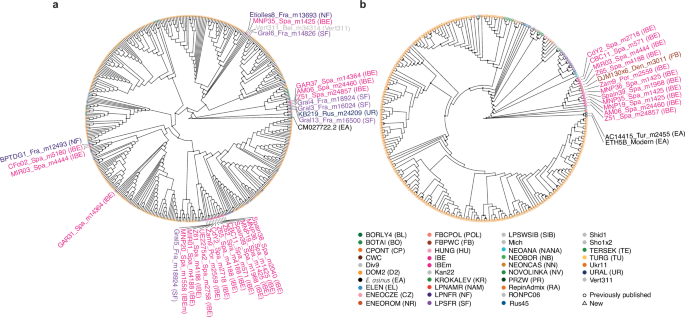
a Mitochondrial DNA. b Y-chromosome. Tip labels were removed for clarity, except for outgroups and members of the IBE lineage, either isolated or grouping within larger, supported monophyletic clades. Fully annotated trees are provided in Supplementary Figs. 9 and 10. Node support was assessed from 1,000 bootstrap pseudo-replicates and ultrafast bootstrap approximation, and is indicated if greater or equal to 80%. Colours and symbols are according to Fig. 1a.
Combined, our autosomal, mitochondrial and Y-chromosomal phylogenetic analyses reveal that the divergent IBE lineage was genetically related to other wild lineages from western Europe, especially from France (Late Pleistocene). It was present in Iberia from at least ~26.8 kya (Z51_Spa_m24857)25 to ~2.5 kya (CBC11_Spa_m571) (Supplementary Data 1), which considerably extends its temporal timeline, previously documented between ~7.2–3.9 kya2,4. The genetic continuity observed between the Late Pleistocene to Early Iron Age also demonstrates that the IBE lineage survived during the LGM in an Ice Age refugium located south of the Pyrenean mountains, in line with climate niche modelling indicating palaeoenvironmental conditions viable for horses26.
Interestingly, IBE δ13C and δ15N isotopic profiles remained stable through time from the Late Pleistocene to ~2.5 kya, suggesting limited changes in diet and habitat after the LGM. While IBE δ13C values were within the range measured in other horse genetic lineages (Supplementary Fig. 11a), their δ15N values occupied the lower distribution range (Supplementary Fig. 11b). The δ13C and δ15N values in herbivores usually reflect those of the plants they consume, which vary with a range of natural and anthropogenic practices27. In a C3-dominated environment such as Iberia, plant δ13C and δ15N values will primarily vary depending on plant type (with cereals showing higher δ13C values, versus lower δ¹⁵N values for legumes), plant parts (with leaves and stems showing higher δ13C and δ15N values relative to grains), and habitat openness (with forested area associated with lower δ13C and δ15N values)28. Climate also plays a dominant role on δ15N values with plants growing in drier exhibiting higher measurements27. Last, domesticated animals consuming protein-rich diet or plants grown on soils fertilized with manure either intentionally, or as a result of repeated pasture use, show increased δ15N values27. The consistent δ15N differences between IBE and DOM2 horses across multiple sites and time periods, combined with the similar δ13C values between lineages, suggest systematic differences in habitat use, forage type, or physiology rather than purely regional effects. The low δ¹⁵N values of IBE horses align with those of other Pleistocene horses (such as LPSFR (SF)), supporting continuity in habitat and forage. In contrast, DOM2 horses exhibit increasingly higher δ¹⁵N values and a broader δ13C range, potentially due to foraging in open grasslands and increasingly human-controlled diet or habitats. We conclude that the observed differences could result from a combination of (1) distinct habitats (wetter forests for IBE, drier grasslands for DOM2), and; (2) differing diets (lower-protein forage in natural habitats such as legumes and grass for IBE, compared to increasingly anthropogenically-impacted habitats with higher-quality cereals and grasses for DOM2).
Horse genetic affinities in Europe pre-domestication
To further explore the relationship between IBE and other wild horse populations in Europe, we applied AdmixtureBayes29 graph modelling to a selection of seven major genetic horse lineages identified in Europe to date4,5. Lineages from the Carpathian basin and Poland, which cluster together in our autosomal phylogenetic tree (Fig. 2b, Supplementary Fig. 8), and are known to share genetic affinities with the Late Neolithic CWC5 lineage from Germany, were excluded to limit model complexity and computational time, while improving MCMC chain mixing efficiency.
The posterior graph distribution was dominated by a single model, representing 56.5% of the sampled graphs (Fig. 4a), with only two additional models occurring at frequencies above 5% (7.0% and 6.4%, respectively) (Fig. 4b, c). All three models depict a complex history of lineage divergence and admixture, in which Late Pleistocene populations from northern France and UK (LPNFR, NF) emerged as some of the earliest lineages investigated to expand and differentiate into Europe (divergence node n8). The descending populations further differentiated into distinct regional lineages, shaped by contributions from other, more divergent groups. For instance, the three models consistently support the IBE lineage tracking 1.7–6.0% of its ancestry back to a divergent population best modelled as the root and showing some of the largest branch drift estimates (admixture node A1; Fig. 4a–c). The deep branching of this contribution indicates the presence of an ancient horse lineage that had arrived in Europe much earlier, and survived in the Iberian climatic refugium. Furthermore, the Eneolithic population from Romania (ENEOROM, NR) is modelled to primarily derive from a node also forming the URAL (UR) population (n1 on the first two models, and n6 on the third). This node branches deep in the history of lineage divergence (n10), prior to the radiation leading to all other lineages from Europe, indicating yet another expansion into Europe than that forming NF and related descending populations.
Fig. 4: AdmixtureBayes29 population graph modelling of seven population groups representing major genetic horse lineages in Europe.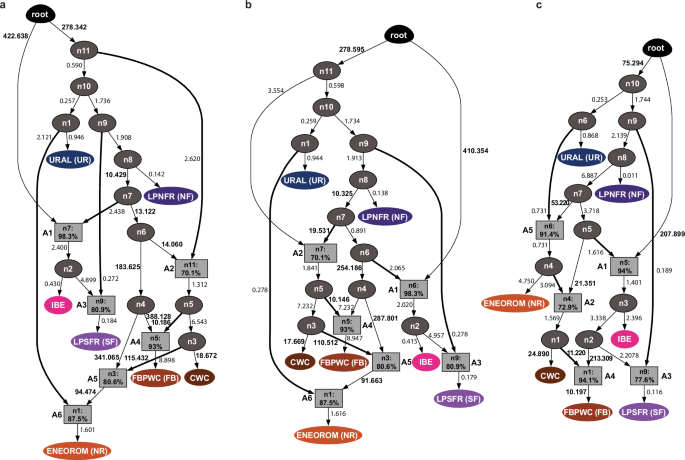
a Population graph associated with the top posterior probability (0.565). b Population graph showing the second largest posterior probability (0.070). c Population graph showing the third largest posterior probability (0.064). No other population graphs account for more than 0.033 of the posterior distribution. Genetic drift estimates are reported along each branch, multiplied by 100, for readability, with values ≥ 10 highlighted in bold. Divergence nodes (n), exempt of admixture, are shown with ellipses coloured in dark grey, while admixture nodes (A) are shown with squares coloured in light grey, with percentages reflecting genetic contribution from the main contributing source. The fraction contributed by the second admixture source is the complement of this percentage to 100%. Branches associated with a proportionally larger admixture proportion are highlighted.
In all three models, Late Pleistocene populations from southern France (LPSFR, SF) derived most of their ancestry from the same expansion that led to the formation of NF populations (admixture node A3), with 77.6–80.9% originating to node n9, immediately ancestral to n8. However, the remaining fraction of the SF genetic makeup originated from a population directly related to IBE (n2). As unadmixed members of the IBE lineage were only found in Iberia, thus likely differentiated in Iberia, this suggests that an IBE-related population expanded northward into southern France, where it formed SF by mixing with its local closest geographic neighbours.
The three models differ in the population history underlying the formation of the NR lineage and those occupying Germany ~2700 BCE (CWC) and Denmark ~3000 BCE (FBPWC, FB). The first two models indicate that CWC- and FB-related lineages participated to NR formation, located further east, likely as populations related to both lineages expanded eastward towards Romania and mixed with the divergent local lineage (admixture node A6; Fig. 4a, b). In contrast, the third model supports a reverse scenario, as an NR-related lineage (node n4) appears central in the formation of both CWC and FB lineages. This implies that a population related to the local lineage from Romania (NR) spread westward into Germany and Denmark, where it admixed with the descendants of the earlier expansion that established the NF lineage (Fig. 4c). While further genome-wide time-series are needed to fully resolve the complexity of these expansions and admixture events, the three population graphs reveal a history of significant genetic drift leading to FB and CWC populations. This aligns with early-to-mid Holocene bone assemblages, which indicate that horse populations were small and sparsely distributed across the continent during this period30.
The rise of DOM2 horses in Iberia
PCA and phylogenetic analyses identified specimen MNP20_Spa_m1558 as an outlier member of the IBE lineage. This was confirmed by qpADM31 modelling strongly rejecting MNP20_Spa_m1558 as entirely descending from the single IBE cluster (p-values = 0; Supplementary Data 2). Furthermore, ADMIXTURE32 analyses based on the optimal K = 2 number of ancestry components identified by cross-validation, indicated that the ancestry component maximized in IBE individuals (and other non-DOM2 lineages) accounted for only 79.7%-80.2% of its genetic ancestry (Supplementary Fig. 12). Considering the same number of components, the Struct-f433 profile of sample MNP20_Spa_m1558 also comprised a higher fraction of the ancestry component maximized in DOM2 horses than other IBE horses (Supplementary Fig. 13). We, thus, explored other possible contributions than IBE, considering all other genetic lineages identified in Europe, as well as DOM2.
qpADM modelling implementing the ‘rotating’ strategy from Harney and colleagues34 testing one possible source at a time while considering all others as outgroup (‘right’) populations, revealed DOM2 as the only compatible source (p-values > 0.01; Supplementary Data 2). Population graph modelling with OrientAGraph35, and including all known possible candidate sources from Europe, also supported the presence of gene flow from the DOM2 lineage into MNP20_Spa_m1558, indicating an admixture proportion of 30.6–34.4% (Supplementary Figs. 14 and 15). These analyses align with D-statistics of the form (EA, IBE; DOM2*, MNP20_Spa_m1558), explicitly testing whether MNP20_Spa_m1558 shares more derived mutations with members of the IBE lineage relative to the earliest DOM2 members known in Europe (DOM2*). The significantly positive D-statistics support an excess of IBE ancestry in MNP20_Spa_m1558 (Fig. 5a; Supplementary Fig. 16), reaching a fraction of 58.91% (range=57.8–60.0%), according to F4-ratios31 (Z-score=36.83; Fig. 5c).
Fig. 5: Admixture between IBE and DOM2 horses.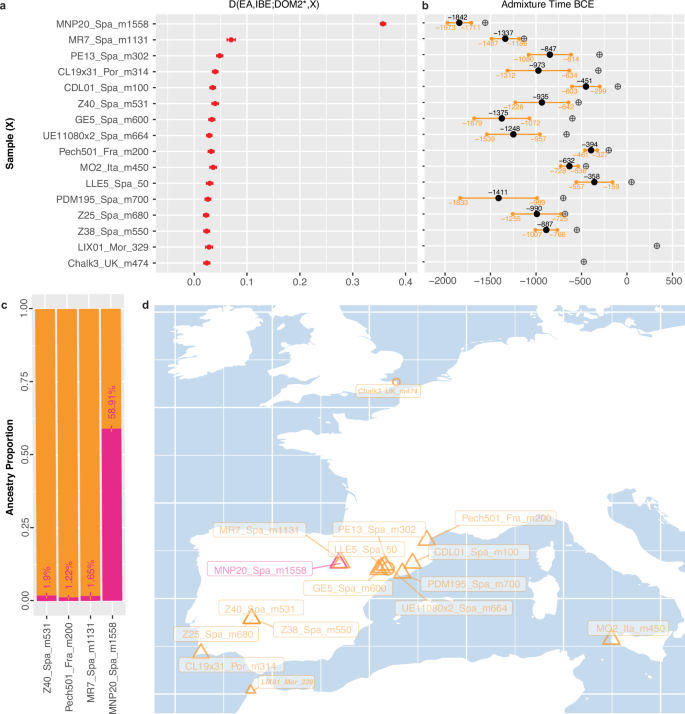
a Significant D-statistics tests of the form (EA, IBE; DOM2*, X), where IBE (N = 19), X is an ancient horse (N = 16), and DOM2* define the earliest European DOM2 horses present in our genome panel (N = 8). Results are shown in red and presented as D values ± standard errors. The statistical significance was assessed following Bonferroni correction for multiple testing. b DATES36 estimates for the timeline of admixture between DOM2 and IBE. Midpoint estimates are shown in black, with confidence intervals in orange. Crossed circles indicate the radiocarbon date of the specimens analyzed, or the age inferred from archaeological context. c F4-ratio31 estimates for IBE (pink) and DOM2 (orange) genetic contributions in four successfully modelled individuals. d Geographic location of the specimens showing evidence of IBE and DOM2 admixture, with those delivering unreliable DATES36 estimates shown with smaller bold, and italicized fonts. Source data for Fig. 5a are provided as a Source Data file.
The predominance of IBE horses in Iberia until the second millennium BCE contrasts with their almost disappearance from our data set during the Iron Age. Only a single of the 20 IBE specimens investigated here (including MNP20_Spa_m1558, plus six previously published) was radiocarbon dated to the first millennium BCE (CBC11_Spa_m571, 734–408 BCE), in contrast to 48 DOM2 horses from Iberia (38 from this study plus 10 previously published, and associated with Iron Age and Roman Republic contexts) (Fig. 1bc; Supplementary Data 1). This indicates a history of genetic turnover following the expansion of DOM2 horses, as shown for other wild lineages across Eurasia4,5.
Importantly, significantly positive D-statistics of the form (EA, IBE; DOM2*, X) indicated an excess of IBE ancestry in only 15 DOM2 specimens present in our data set (plus MNP20_Spa_m1558; Fig. 5a; Supplementary Fig. 16). Four of these specimens were not from Iberia, revealing indirect genetic influence of IBE outside their native range, potentially through trade and/or exchange of admixed DOM2 horses originally bred in Iberia. These included one sample from the Roman settlement of Lixus, Morocco (LIX01_Mor_329; 255-402 CE), and three samples from Iron Age settlements in Sicily (Motya, MO2_Ita_m450; 475-425 BCE), southeast Britain (Chalk Hill, Chalk3_UK_m474; 541-406 BCE), and southern France (Pech501_Fra_m200; 200 BCE). The latter was excavated at the Pech Maho oppidum in southern Gaul, approximately 130 kilometres north of the Greek colony of Emporion (Empúries, northeastern Iberia). The site has yielded material evidence of Iberian contacts between ~500 and 200 BCE (Supplementary Text). Statistical power was sufficient to estimate that the IBE lineage contributed to 1.22% of the genomic makeup of the admixed specimen from Pech Maho (Z-score = 134.72; Fig. 5c), and 1.65–1.90% (Z-scores = 74.04 and 102.61) in two other specimens from Spain (including MR7_Spa_m1131 from the final Bronze Age settlement of El Morredón, which represents the earliest Iberian DOM2 horse in our data set (1213–1048 BCE). While Z-scores were also largely significant in all other 12 admixed individuals tested (69.97 ≤ Z-scores≤130.57), the confidence range estimated for the IBE ancestry could intercept zero, or even extend into negative values. This suggests limited sensitivity and that IBE genetic contribution to the genomes of the remaining horses with non-zero D-statistics was below the minimum successfully estimated value (i.e., 1.22%).
DATES36 analyses for estimating the admixture time between DOM2 and IBE lineages showed significant model fits for all admixed candidates (Fig. 5b), except LIX01_Mor_329 and Chalk3_UK_m474, which were, thus, conservatively considered false-positives (Supplementary Data 3, Fig. 5d). Admixture times were distributed across most of the mid-first millennium BCE, and extended into the first half of the second millennium BCE (Fig. 5b; Supplementary Data 3). The fact that multiple confidence intervals show no overlap suggests several independent admixture events punctuating the Bronze Age and the Iron Age. These findings support husbandry practices allowing almost continuous contact with wild horses. Remarkably, the earliest admixture date was obtained on the MNP20_Spa_m1558 specimen from Moncín, Spain, and was estimated to ~1842 BCE (range = 1973–1711 BCE). This indicates that DOM2 horses have entered the region in the early second millennium BCE, only a few centuries after their initial domestication in the lower Don-Volga basin (Supplementary Data 3).
D-statistics calculations showed that none of the modern breeds investigated shared an excess of IBE ancestry (Supplementary Fig. 17). This supports previous reports of limited IBE genetic legacy into modern domestic horses2, likely due to a relatively early extinction of this lineage. The absence of measurable IBE-related genetic ancestry in the DOM2 ancient horses present in our data set after ~358 BCE (midpoint; range = 557–159 BCE), suggests an extinction time by the end of the Iron Age, and likely prior to the Roman period.
The genetic influence of Iberian horses from the Iron Age onwards
Historical sources highlight the exceptional value of Iberian bloodlines from Antiquity to the Modern Period16,17,37,38,39. To investigate the potential influence of Iberian horse breeding over time, we analyzed ancient DOM2 horses lacking IBE ancestry, covering a period from ~2125 BCE to the modern era (Supplementary Data 1). We used f3-outgroup statistics with donkeys (EA) as an outgroup (Supplementary Fig. 18), to measure genetic affinities between each individual DOM2 horse from Europe and the Mediterranean, and the remaining DOM2 specimens from other archaeological sites. Pairs of samples from the same site or separated by more than 500 years were disregarded. This filter was especially implemented (1) to avoid only capturing within site affinities, (2) to avoid biasing the analysis due to uneven sampling across sites (i.e., those sites with multiple samples would show local affinities that sites represented with a single sample could not), and; (3) to only compare those horses living relatively close in time. This approach allowed us to detect genetic affinities spanning thousands of kilometres (Supplementary Fig. 19). We then mapped the pairs showing the highest detected affinity, visually representing their connection with colour-coded links proportional to the strength of the genetic relationship (Fig. 6).
Fig. 6: Map of horse genetic affinities.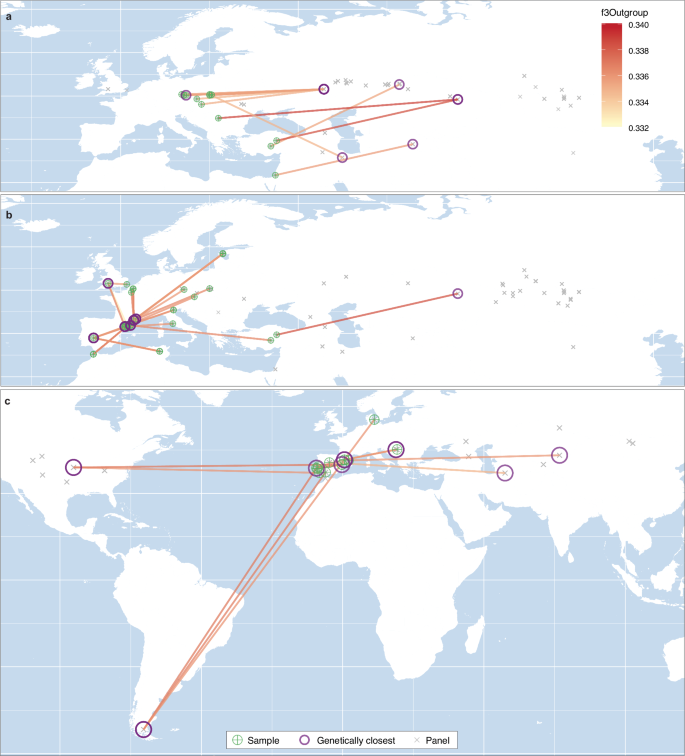
a Before 1200 BCE. b 1200 BCE–500 CE. c After 500 CE. Segments highlight sample pairs associated with maximal f3-Outgroup statistics, with colours proportional to values. Pairs involving individuals from the same site or separated by >500 years were disregarded. Crossed-green circles indicate the origin of the sample tested, while purple circles reflect their closest genetic relative. Samples present in the test panel but returning lower f3-Outgroup statistics with the samples tested are shown with grey crosses. Source data are provided as a Source Data file.
Prior to ~1200 BCE, the number of unadmixed DOM2 specimens available was scarce across western Europe (Fig. 6a). However, Central European samples most often exhibited stronger genetic affinities with individuals from present-day western Russia, Kazakhstan, and Iran, suggesting that domestic horses in Europe were not yet locally bred but instead sourced from genetically similar stocks originating near the domestication centre.
In contrast, from ~1200 BCE to 500 CE, most horses analyzed—both within and outside Iberia—found their closest genetic relatives in Iberia or southeastern France (Fig. 6b). This likely reflects the emergence of locally bred bloodlines in the region, and their subsequent diffusion through trade networks across western Europe. Notably, Iberian genetic influence extended over vast distances, reaching as far north as present-day Estonia (Ridala) and Britain (Magor), as far east as Anatolia (Acemhöyük), and as far south as Morocco (Lixus) and Tunisia (Althiburos) (Fig. 6b).
Although our dataset limited was incompatible with extensive analyses beyond 500 CE, we detected a substantial expansion of Iberian genetic influence, extending to both Asia (southern Kazakhstan, Zhanaturmus, and; northeastern Iran, Belgheis), and the Americas (Kaw River and Chorillo Grande; Fig. 6c). The affinities with Asia likely reflect the shared genomic heritage of Iberian and Oriental bloodlines, previously linked to the spread of horses following the Muslim conquest, which impacted both Europe and Asia2. Meanwhile, the genetic signal in the Americas corresponds to the early introduction of domestic horses by the Spanish and Portuguese colonizers (i.e., the Conquistadors)19.