

Overview of cohort and single-cell RNA-seq data
Totally, 325 healthy volunteers were included in the 300BCG vaccination cohort18. In our study, a subset of the cohort consisting of 20 females and 18 males were selected for single-cell transcriptomic profiling17,18 (Supplementary Fig. 1a, b). Of note, the genotype PCA plots including donors of current study and 1000 genome (phase 3) donors suggested a fair homogeneity of the study cohort (Supplementary Fig. 1c). Peripheral blood mononuclear cells (PBMCs) were isolated from whole blood both before (T0) and three months after vaccination (T3m) as described before17,19. Subsequently, the isolated PBMCs were cultured in culture medium with or without lipopolysaccharide (LPS) for four hours (“Methods”). In total, 152 samples across four conditions (RPMI and LPS treated, either before or after vaccination) were profiled using the 10x Genomics Chromium platform (Fig. 1a). These analyses resulted in transcriptional profiles of immune cells across different contexts (in vivo and in vitro stimulations).
Fig. 1: Data set overview.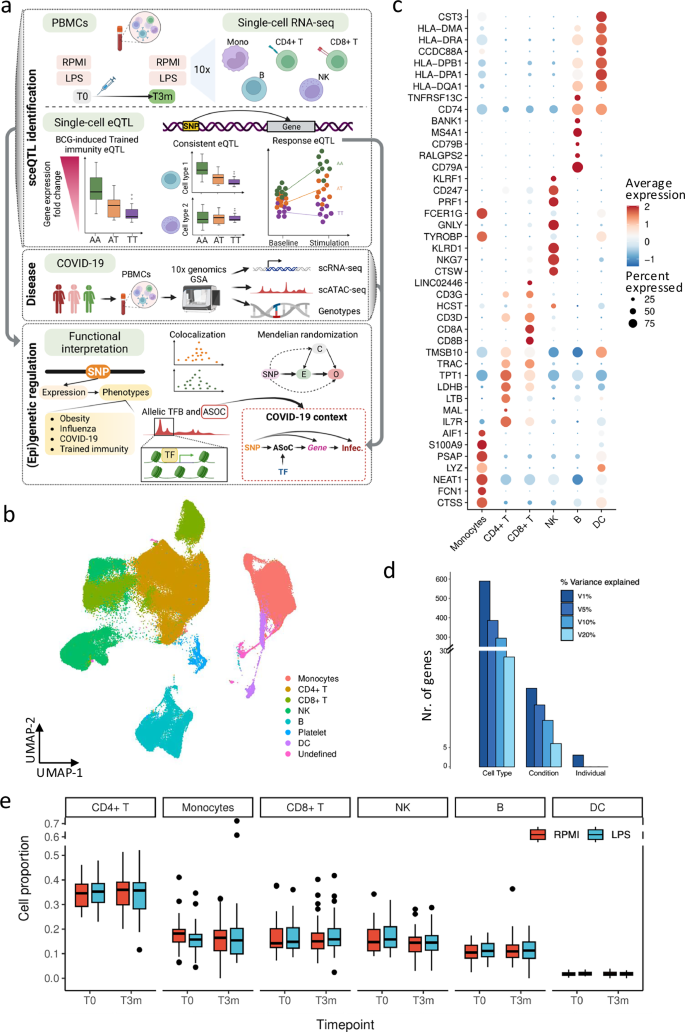
a Overview of the current study (Created in BioRender. Zhan, Q. (2025) https://BioRender.com/c28r787). The single-cell RNA-seq data were from Li et al.17 and Zhang et al.25. b Major cell types identified from the single-cell RNA-seq results. c Marker genes used to identify the main cell types in current studies. d Variance explained by cell types, conditions, and individuals. The color represents variance explained at 1, 5, 10, and 20% of the gene expression. e Cell lineage proportions of each major cell type per individual (n = 152 samples). In box pots, whiskers expand to minima and maxima, boxes indicate 25th and 75th percentiles, centers represent medians.
The scRNA-seq resulted in transcriptomic profiles of 186,341 cells, which were further classified into seven major cell types: monocytes, CD4+ T cells, CD8+ T cells, NK cells, B cells, dendritic cells, and platelets (Fig. 1b, c, Supplementary Fig. 1e and 1e, Methods). We partitioned the transcriptional variance using a random-effect model and found that cell lineage was the primary determinant, followed by condition and inter-individual variation (Fig. 1e). This underscores the importance of studying gene expression at cellular levels. Notably, no significant differences in cell proportions were observed across the conditions in each cell lineage (Fig. 1e and Supplementary Fig. 1f). Among these identified cell types, we selected five most abundant (≥ 10%) cell types (monocytes, CD4+ T, CD8+ T, NK, and B cells) for eQTL analyses.
TI eQTL of LCP1 explains inter-individual variation of TI cytokine response
TI is defined as long-term memories in innate immune cells, leading to an enhanced immune response, such as cytokine production, evoked by the subsequent homologous or heterologous restimulation20. Our previous work has shown that the effects of TI are partly genetically regulated21, while upon restimulation, noticeable alteration of the TI effect was observed at the single-cell transcriptome level17. However, how genes contribute to the interindividual variation of TI cytokine responses is largely unknown. To address this, we initially identified 120 TI-response genes and mapped TI eQTL by associating genetic variants with expression alterations, cytokine production fold-change (FC) between T3m-LPS and T0-LPS, of these TI-response genes (Fig. 2a and Supplementary Fig. 2a, Methods).
Fig. 2: Trained Immunity eQTL (TI eQTL) in monocytes.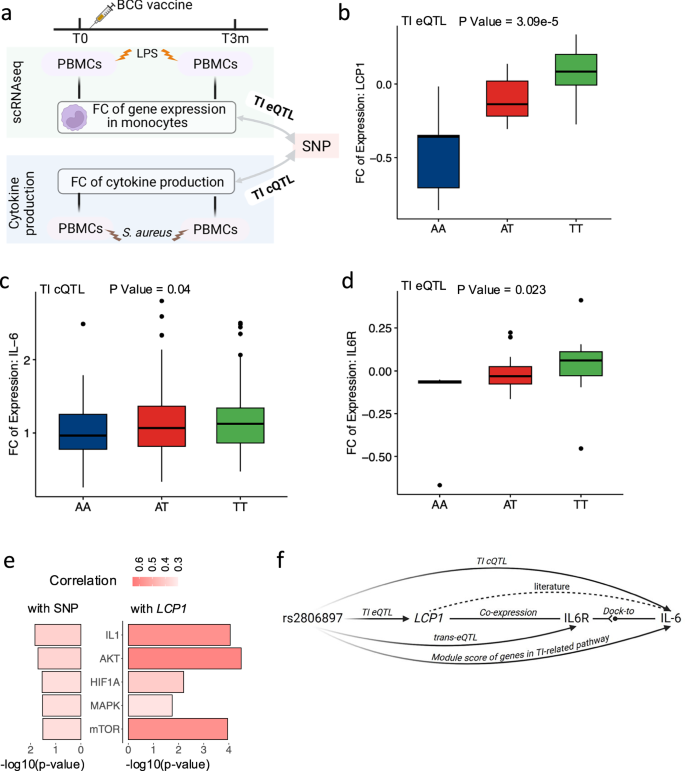
a Schematic plot of the TI eQTL of this study. The single-cell RNA-seq data were from Li et al.17. b Boxplot of leading TI eQTL, LCP1-rs2806897 (p-value = 3.09e-5, beta = 0.33, 95% confidential interval (CI) = [0.17, 0.49], n = 152 samples, LMM adjusting age and sex), in monocytes. The y-axis was the fold change (FC) of LCP1 expression level between after and before being trained. c Boxplot of TI cQTL (IL6-rs2806897, p-value = 0.04, beta = 0.10, 95%-CI = [0.06, 0.14], DF = 274, n = 278 donors, linear regression adjusting age and sex). The y-axis was the FC of IL-6 cytokine expression level between after and before being trained. d Boxplot of eQTL (IL6R-rs2806897, p-value = 0.023, beta = 0.20, 95%-CI = [0.05, 0.35], n = 152 samples, LMM adjusting age and sex). The y-axis was the FC of IL6R between after and before being trained. In box-pots (b–d), whiskers expand to minima and maxima, boxes indicate 25th and 75th percentiles, centers represent medians. e Correlation between rs2806897 (left)/LCP1 (right) and TI-related pathways. The x-axis represented -log10(p-value) while the color represents correlation strength. Correlations are estimated by the Pearson correlation coefficient. f Mechanism of leading TI eQTL (LCP1-rs2806897), in monocytes (Created in BioRender. Zhan, Q. (2025) https://BioRender.com/c28r787). In concrete, rs2806897 is associated with LCP1 gene expression in the TI context, and both SNP and eGene were correlated with TI related pathways. LCP1 was also correlated with IL6R (p-value = 2.39e-5, Pearson correlation coefficient = 0.63), which was the receptor of IL-6, while rs2806897 was demonstrated to be associated with IL-6 from the cytokine-QTL analysis.
We compared the identified TI eQTL with TI cQTL effects obtained from the same cohort (Supplementary Data 1). Interestingly, the top locus LCP1-rs2806897 (p-value = 3.09e-5, Fig. 2b) out of 118 significant TI eQTL in cis (adjusted-p-value < 0.05) was also associated with a TI cytokine QTL (TI cQTL, p-value = 0.04, Fig. 2a, c, and Supplementary Fig. 2b). Importantly, the rs2806897-T allele corresponds to both increased LCP1 expression FC and TI cytokine (IL6) response FC. The monocyte expression of IL6R, which encodes the receptor of IL6, is suggestively associated with the same SNP (rs2806897, P-value = 0.023, Fig. 2d). Collectively, these observations suggest a potential role of LCP1 in regulating BCG-induced TI-associated cytokine IL6 response.
The LCP1 gene encodes plastin-2, which plays roles in the activation of innate and adaptive immune cells. Previous studies identified pathways involved in TI, including mTOR, Akt, HIF1A, IL1-family, and MAPK pathways22. We calculated transcriptome scores of each of these pathways (Methods) in monocytes and assessed their correlation with alterations of LCP1 expression upon TI. Interestingly, all of these TI-related pathways exhibited a consistent positive correlation pattern with the alteration of LCP1 expression (mTOR: cor = 0.35, p-value = 0.031; Akt: cor = 0.38, p-value = 0.02; HIF1A: cor = 0.35, p-value = 0.029; IL1-family: cor = 0.39, p-value = 0.015; MAPK: cor = 0.35, p-value = 0.030, Fig. 2e). This result aligns with previous findings that active LCP1 interacts with mTOR pathway, further contributing to the mTORC2 activity23. Collectively, these data suggest that the TI eQTL of LCP1 contributes to inter-individual variations in the TI effect induced by BCG, which is summarized in Fig. 2f.
Furthermore, a previous proteomics study revealed the role of LCP1 in COVID-19 patients24. Reanalysis of single cell transcriptome data from three independent COVID-19 cohorts9,25 revealed that the LCP1 gene exhibited a significant elevated expression in monocytes in individuals infected by SARS-CoV-2 compared to healthy or convalescent donors (Supplementary Data 2). This result implies that the BCG-induced TI effect of LCP1 could play a potential role in COVID-19 pathogenesis.
Consistent eQTLs colocalize with GWAS signals of immune-related diseases
Next, we proceeded to detect consistent eQTLs and response eQTLs. Concretely, we used linear mixed models to estimate associations between genetic variants and gene expression by incorporating 152 samples from four conditions (“Method”). We detected consistent eQTLs by evaluating genetic effects shared across conditions, whereas response eQTLs were identified by testing the interaction between genotypes and conditions (Fig. 1a).
In total, more than 600 consistent eGenes (ranging between 651 to 880) were identified in each cell lineage (Fig. 3a). The varying number of eGenes across cell lineages might be partially due to differences in both proportions of the cell lineage (Supplementary Fig. 1f) and the number of expressed genes in each cell lineage (Supplementary Fig. 1g). These consistent eQTLs were successfully replicated in a publicly available bulk RNA-seq eQTL database (eQTLGen5), with concordance rate ranging from 81% to 87% (p-value < 0.05 in the replication dataset, Fig. 3b and Supplementary Fig. 3a, b). We also validated our eQTL findings in eQTL datasets from purified specific immune cells (DICE database26), which resulted in more than 90% validation rates (Supplementary Fig. 3c). Furthermore, a substantial proportion of eGenes are specific to individual cell types, indicating distinct transcriptional profiles in different immune cell lineages (Fig. 3a), which aligns with a previous study1. In addition, a further multivariate adaptive shrinkage (MASH27) analysis revealed that consistent eQTLs from similar cell lineages exhibit comparatively greater similarity in the genetic effects on gene expression (Supplementary Fig. 3d, e).
Fig. 3: Monocyte-specific eQTL pinpointed the role of ADCY3 in obesity.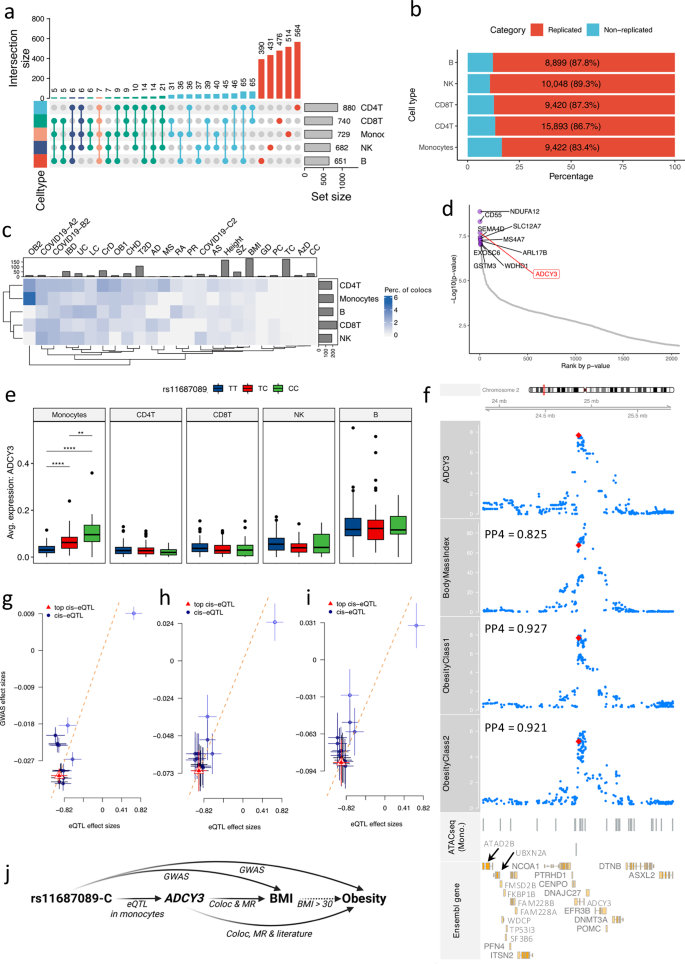
a Number of identified eGenes significantly associated with at least one locus. b Number of eVariants validated in eQTLGen. c Colocalization analysis between consistent eQTL and 24 published GWAS summary statistics. The top bar plot represents the number of independent loci. The right bar plot represents the frequency of eQTL colocalized with at least one GWAS result. Color in the figure represents the ratio of colocalized loci out of independent loci per GWAS result. d Top 10 consistent eQTL in monocytes ranked by p-value. Y-axis is -log10-transformed p-value, and x-axis represents p-values’ ranks. The top 10 eQTL were colored (purple) and labeled. ADCY3 gene was highlighted. e eQTL effect tagged by rs11687089 per cell-type (p-value = 2.06e-08, beta = − 0.93, CI = [− 1.27, − 0.57], n = 152 samples, LMM adjusting age and sex, for monocytes). The Y-axis is the average expression of ADCY3 per donor. Asterisks indicate significant levels (** < 0.01, *** < 0.001, **** < 0.0001). In box-pots, whiskers expand to minima and maxima, boxes indicate 25th and 75th percentiles, centers represent medians. fADCY3 eQTL in monocytes and body mass index (BMI), obesity class I, and obesity class II. Red and blue dots represent the top and other SNPs of ADCY3 eQTL. The y-axis represents -log10-transformed p-values. The X-axis is genomic coordination (GRCh38). Segments (“ATACseq (Mono.)”) represent open chromatin peaks in isolated monocytes from the cohort superseding our cohort. “Ensembl gene” panel displays genes in the locus. The PP4 is estimated by Bayesian colocalization analysis using Bayes Factors. g–i Summary data-based Mendelian Randomization analyses between ADCY3 eQTL and BMI (g), obesity class I (h) obesity class II (i). The y-axis shows eQTL effect sizes. The X-axis represents GWAS effect sizes. The dashed red line indicates linear fit of Wald-ratio-test. The top cis-eQTL SNP and rest ones are in red and blue, respectively. Estimated p-values of SMR are 8.78e-08 (BMI), 9.14e-05 (obesity class I), and 3.90e-04 (obesity class II) using n = 16 SNPs. Vertical and horizontal error bars are GWAS and eQTL effect sizes (means +/− SD, 95%-CI). j Schematic plot depicting potential roles of ADCY3 eQTL in BMI and obesity (Created in BioRender. Zhan, Q. (2025) https://BioRender.com/c28r787).
Subsequently, in order to assess potential roles of consistent eQTLs in immune traits and diseases, we colocalized sc-eQTLs (Fig. 3c) with publicly available GWAS results (Supplementary Fig. 3f). The results indicate the presence of shared causal variants across multiple complex traits and diseases (Supplementary Fig. 3g). These findings highlight the potential role of genetic variants on complex traits in a cell-type-specific manner.
Moreover, similar patterns were also observed for identified response eQTLs (Supplementary Fig. 4a–c). Interestingly, 10.56% – 29.17% of differentially expressed genes (adjusted-p-value < 0.05) are response eGenes (FDR < 0.05) between the corresponding condition and baseline (Supplementary Fig. 4d). We also observed correlations between number of identified responses eQTLs and abundance of a cell type, which is in line with previous study28. Interestingly, we acknowledge that the number of eGenes in the B cell subset is smallest in consistent eQTLs (Fig. 3a) but largest in response eQTLs (Supplementary Fig. 4a). This is in line with established findings29,30, LPS stimulation triggers B cell proliferation and differentiation into antibody-secreting cells, which likely accounts for the observed expansion of eGenes in response eQTLs.
The comparison between response eQTLs and consistent ones suggested specificity in the consistent eQTLs relative to response eQTLs (Supplementary Fig. 4e). The response eQTLs identified under different stimulation conditions (LPS response eQTL before BCG or after BCG) exhibited notable similarity. Besides, we observed shared eQTL signals across cell types and conditions (Supplementary Fig. 4b). The shared eQTL signals across cell types and conditions suggest a conserved genetic architecture that governs gene expression regulation. This implies a broader regulatory influence of these loci across diverse biological contexts, highlighting their potential roles in coordinating molecular pathways and cellular functions across different cell types and states.
Finally, the effect sizes and directions of TI eQTLs show correlated patterns with those of response eQTLs but show less similarity with the effect and directions of consistent eQTL in monocytes (Supplementary Fig. 4f). Given that TI assesses the differential response between LPS stimulation with BCG training (T3m-LPS) and without BCG training (T0-LPS), it is noteworthy that genetic effect on TI (the difference between T3m-LPS and T0-LPS) align with the genetic effect on the LPS response (either T3m-LPS or T0-LPS) for these identified TI genes.
Shared genetic regulation between ADCY3 expression in monocytes and obesity
The observation of a high proportion of loci shared between monocyte eQTLs and obesity (Fig. 3c) instigated an exploration into the plausible contributions of eQTLs to the disease. As indicated in Fig. 3d and Supplementary Fig. 5a–c, and Supplementary Fig. 6a–d, ADCY3 is an eGene that are significantly associated with rs11687089. This eVariant has been previously reported to be correlated to both body mass index (BMI) and obesity31,32 (p-value = 1.18e-35 and 2.10e-08, respectively). Of note, our eQTL analysis revealed that rs11687089-C corresponds to increased ADCY3 expression predominantly in monocytes (Fig. 3e). A colocalization analysis between the ADCY3 eQTL in monocytes and publicly available GWAS summary statistics including BMI, obesity class I (OB1), and obesity class II (OB2)32 revealed that the identified locus is associated with both ADCY3 expression in monocytes and obesity-related traits with high probability (PP4eQTL vs BMI = 0.825, PP4eQTL vs OB1 = 0.927, and PP4eQTL vs OB2 = 0.921, Fig. 3f). A further summary statistic-based Mendelian Randomization (MR) analysis using the SMR method33 showed consistently significant mediation effects on BMI/obesity through the expression of ADCY3 in monocytes (p-valueeQTL vs BMI = 8.78e-08, p-valueeQTL vs OB1 = 9.14e-05, and p-valueeQTL vs OB2 = 3.90e-04, Fig. 3g–i and Supplementary Fig. 6e–g, “Methods”). As summarized in Fig. 3j, these observations suggest the potential involvement of ADCY3 in increasing BMI and the development of obesity, expanding previous studies34,35.
Allelic transcription factor (TF) binding affinities contribute to CD55 eQTL effect in monocytes
One of the interesting observations was the significant association between rs2564978-C and CD55 expression in monocytes but with opposite eQTL effect direction in other cell types (Fig. 4a and Supplementary Fig. 7a, b). This monocyte eQTL matches previous bulk-eQTL studies (GTEx and DICE database4,26, Supplementary Figs. 8a, b, 9a) but sheds light on its cell-type specificity. In addition, using chromatin accessibility data of PBMCs (299 samples) and from monocytes (27 samples) from the 300BCG cohort21,36, we found an open chromatin region (OCR) harboring eVariant associated with CD55 gene expression (Fig. 4b and Supplementary Fig. 8b) in PBMCs and monocytes. Furthermore, the potential regulatory programs between the variant and CD55 was also observed using gene-enhancer/promoter interactions from the GeneHancer database37 (Supplementary Fig. 8b).
Fig. 4: CD55 eQTL explained by allelic transcription factor binding affinities.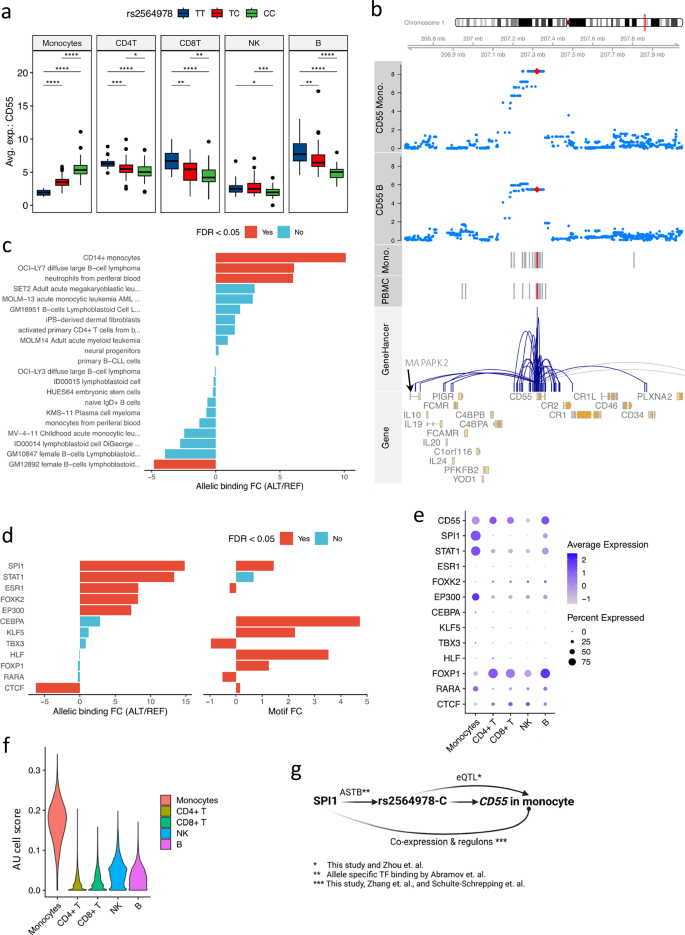
a CD55-rs2564978 eQTL effect per cell type. The y-axis is the average expression of CD55 per donor. Including monocytes (p-value = 4.86e-09, beta = 1.26, 95%-CI = [0.82, 1.71]), CD4 + T (p-value = 3.49e-03, beta = − 0.59, 95%-CI = [− 0.99, − 0.19]), CD8 + T (p-value = 0.01, beta = − 0.54, 95%-CI = [− 0.97, − 0.11], NK cells (p-value = 3.56e-03, beta = − 0.49, 95%-CI = [− 0.83, − 0.16]), B cells (p-value = 3.32e-06, beta = − 1.04, 95%-CI = [− 1.49, − 0.58]). P-value < 0.05: *, < 0.01: **, < 0.001: ***, < 0.0001: ****, LMM adjusting age and sex, n = 152 samples. Whiskers of box-plots expand to minima and maxima, boxes indicate 25th and 75th percentiles, centers represent medians. b Locus plot of CD55 eQTL effects (monocytes and B cells). The top two tracks are genome-coordination (GRCh38). The next two are p-values of CD55-SNP pairs in monocytes and B cells, respectively. The y-axis shows -log10-transformed p-values. Red dots are the top SNP of CD55 eQTL in monocytes. Fifth and sixth are OCRs (monocytes and PBMC). Red bars are OCRs overlapping the top eVariants of CD55. Seventh is GeneHancer interactions (UCSC genome browser). The last track displays gene (ENSEMBL). c Allelic TF binding potentials of rs2564978. The y-axis displays immune cells, and the x-axis shows the log2-transformed FC of allelic binding affinity (alternative allele vs reference allele). Colors indicate significance (adjusted-p-value < 0.05, two-sided beta-binomial test). d Allelic TF binding affinities of TFs potentially bound eVariant locus. The left panel shows allelic TF-binding of eVariant (adjusted-p-value < 0.05, two-sided beta-binomial test). The right panel displays allelic TF brokenness. Colors denote significance. The X-axis of both panels are log2-transformed allelic-binding affinity FC and motif-break-score FC (alternative to reference). e Expression of prioritized TFs per cell type. Dots colors and sizes represent average expression and percentage of cells expressing the gene, respectively. f Violin plot displaying SPI1 regulatory activities per cell type. The X-axis represents cell types and y-axis represents AUcell scores of SPI1 by SCENIC39. g Schematic figure showing potential regulation of CD55 expression (Created in BioRender. Zhan, Q. (2025) https://BioRender.com/c28r787).
Genetic variants in regulatory regions (promoters and enhancers) can modulate gene expression by altering binding affinities of transcriptional factors, which consequently disrupts the expression balances between alleles and offers means to interpret eQTL effects38. Therefore, we proceeded to test if the identified eVariant could perturb CD55 expression by allelicly altering TF binding affinities. Initially, we obtained the potential allele-specific TF binding affinities of the eVariant in immune-related cells from the ADASTRA database38. We observed significant higher allelic binding affinities to allele rs2564978-C in classical monocytes, neutrophils from peripheral blood, and diffuse large B-cell lymphoma (Fig. 4c). By using the same database, 10 TFs were prioritized by their binding capacity to the identified OCR and overlapped with the identified eVariant (Fig. 4d, Methods). Of these TFs, SPI1, STAT1, ESR1, EP300, CEBPA, and CTCF display significantly higher binding affinities to the allele rs2564978-C (FDR < 0.05), which could result in an increased expression of CD55 compared to those in alternative allele carriers. Moreover, the reference allele has a significant capacity to interrupt the binding motifs of SPI1, CEBPA, and CTCF (Fig. 4d), suggesting their potential regulatory roles in modulating the CD55 expression.
Furthermore, the expression profiles of these TFs across cell types suggested SPI1, STAT1, and EP300 are potential key regulators of CD55 in monocytes (Fig. 4e). Among the prioritized TFs, we assessed their effects on CD55 expression using regulon analyses39. TF regulon enrichment, assessed via the AUC (Area Under the Receiver Operating characteristic Curve), revealed that SPI1 was specifically enriched in monocytes (Fig. 4f), while other TFs did not display cell-type-specific over-representation (Supplementary Fig. 9b). Furthermore, of the evaluated TF and regulons, only SPI1, STAT1, and ESR1 were predicted regulating CD55. And the CD55 was among the first of four quantiles of SPI1’s target genes, which was ranked by the regulation potentials of SPI1 (Supplementary Fig. 9c). Notably, a recent study40 demonstrated that SPI1 modulates CD55 promoter activities by binding to the rs2564978-C allele, consistent with our results. In addition, the co-expression profiles can also be observed in pseudo-bulk PBMC from the public datasets9,25 (Supplementary Fig. 10).
To validate the identified potential regulation programs, we measured CD55 expression in monocytes after suppressing SPI1 or STAT1 using the corresponding TF inhibitors (Supplementary Fig. 9d, e). Although no statistically significant effect was found partly due to the limited number of samples in the experiment, we observed a trend towards suppressed CD55 expressions in monocytes. Of note, a recent publication40 reveal that the rs2564978-C allele is associated with increased promoter activities upon bound by SPI1, which is in line with our results. Our results collectively provide insights in the regulatory roles of eVariants interfering with TF binding affinities and resulting in eQTL effect in monocytes (Fig. 4g).
Integration of response eQTLs with multi-omics data of COVID-19 patients unravels genetic and epigenetic regulation of SLFN5
External stimuli can significantly alter transcriptional profiles of immune cells, resulting from complex regulatory processes. Therefore, we identified response eQTLs to understand genetic variations associated with transcriptional alterations upon stimulations (Supplementary Fig. 4a). Interestingly, we identified robust response eQTL effects for the SLFN5 gene in T lymphocytes. Concretely, the rs11080327-A allele was significantly associated with increased SLFN5 expression in T lymphocytes upon LPS stimulation, both in samples collected before and three months after BCG vaccination (Fig. 5a and Supplementary Fig. 11a, b). Previous studies suggested the potential role of SLFN5 in controlling viral loads, such as influenza A virus (IAV) and SARS-CoV-241,42. In line with this, our colocalization analysis suggests a potential shared genetic basis between SLFN5 expression and COVID-19 severities43 (Fig. 5b, PP4 = 0.398), where the rs11080327-A allele is associated with increased SLFN5 expression but decreased risk of COVID-19 severity (p-value = 9.83e-4). Importantly, this locus harbors a SNP (rs883416) that is suggestively associated with COVID-19 severity (p-value = 4.55e-05) and strongly linked to rs11080327 (R2 = 0.965, p-value < 0.0001, EUR). In addition, this SNP is located in an open chromatin region (Fig. 5b) based on bulk ATAC-seq data from PBMC of 299 samples in the same cohort (300BCG), suggesting a regulatory role of the identified locus. This potential regulatory program (the interaction between enhancers and promoters) is also observed in the publicly available GeneHancer database37 (Fig. 5b).
Fig. 5: COVID-19 related SLFN5 gene is regulated via chromatin accessibility in lymphocytes.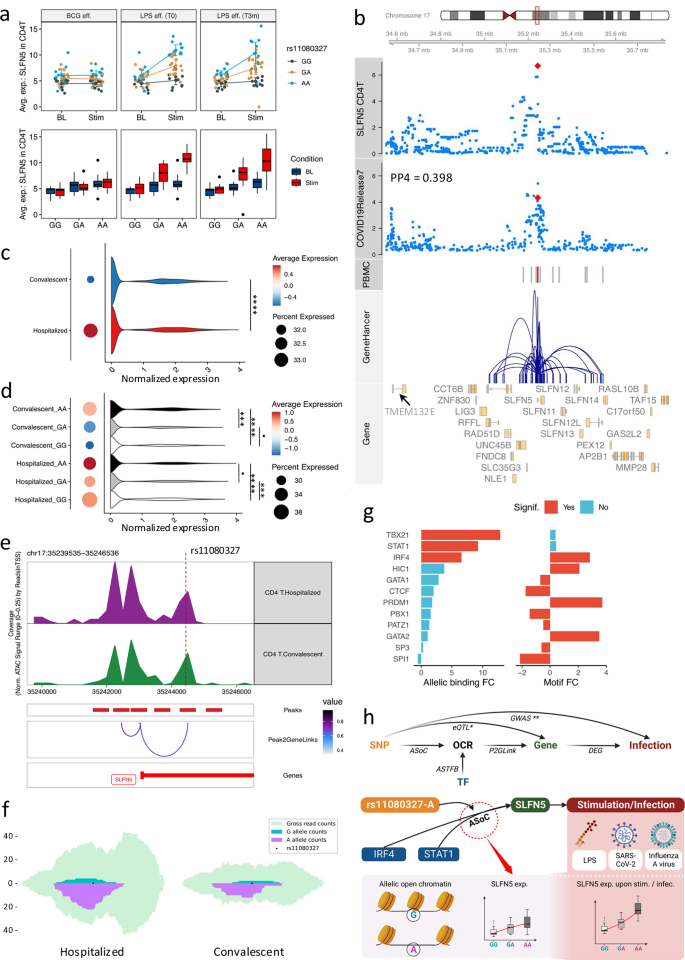
a eQTL effects of SLFN5-rs11080327. Panels display response eQTL per stimulation: BCG-vaccination, LPS pre-BCG-vaccination, 3-month post-BCG-vaccination. Colors represent genotypes. The X-axis shows conditions. The Y-axis is SLFN5 expression. Error bars are mean values +/− SD (95%-CI) and mean expression are connected by line (n = 152 samples). Whiskers of boxplots expand to minima and maxima, boxes indicate 25th / 75th percentiles, and centers represent medians. b Regulation potentials of SLFN5-rs11080327. Track-plot includes chromosome, genome-coordination, eQTL p-values in CD4 + T cells (LMM adjusting age and sex) and COVID-19 GWAS p-values (logistic regression), OCRs (PBMC), gene-enhancer interactions (UCSC genome browser), and gene (ENSEMBL). Red dots (tracks 3, 4) denote rs11080327. Red bars (track 5) denote OCRs overlapping rs11080327. c SLFN5 expression per COVID-19 condition (CD4 + T). Dot colors and sizes indicate average expression and cells (percentage) expressing SLFN5, respectively. Violin plots show SLFN5 normalized-expression (x-axis) per cell type (adjusted-p-value = 3.71e-08, log2-FC = 0.22, LR-test, adjusted-p-value < 0.0001: ‘****’). dSLFN5-rs11080327 eQTL in COVID-19. Dot colors and sizes show average expression and cells (percentage) expressing SLFN5 per condition per genotype. Violin plots show SLFN5 normalized expression (x-axis). Convalescent, adjusted-p-value GA/AA = 2.26e-04, log2-FC GA/AA = −0.20; adjusted-p-value GG/AA = 7.91e-10, log2-FC GG/AA = − 0.24; adjusted-p-value GG/GA = 0.28, log2-FC GG/GA = -0.04. Hospitalized: adjusted-p-value GA/AA = 0.20, log2-FC GA/AA = − 0.06; adjusted-p-value GG/AA = 6.36e-05, log2-FC GG/AA = −0.06; adjusted-p-value GG/GA = 1.08e-04, log2-FC GG/GA = 0.01. LR-test (adjusted-p-value > 0.05: ‘·’, < 0.001: ‘***’, <0.0001: ‘****’). e OCRs at rs11080327 (COVID-19). The top two tracks display OCRs (CD4 + T). “Peaks” shows OCRs correlated to SLFN5 expression in “Peak2GeneLinks”. The color of connection suggests Pearson’s rho correlation. f Allelic open chromatin at eVariant in COVID-19 (CD4 + T). Green and purple denote read counts covering G/A alleles. Light blue shows gross read counts. g Allelic TF binding affinities (rs11080327). The left panel shows allelic TF-binding affinities. The right panel displays allelic TF brokenness. Colors denote significance (adjusted-p-value < 0.05). X-axis are log2-FC of binding affinity and motif-break-score (alternative to reference). h Potential regulations of SLFN5 expression upon stimulation (infection) involving allelic open chromatin (Created in BioRender. Zhan, Q. (2025) https://BioRender.com/c28r787).
To shed light on the role of SLFN5 in the COVID-19 context, we estimated the eQTL effects in T lymphocytes using scRNA-seq data from 37 hospitalized and 27 convalescent COVID-19 patients25 (Fig. 1a). First, we observed significantly elevated expression of SLFN5 in hospitalized individuals compared to convalescent individuals (adjusted-p-value = 3.71e-08, Fig. 5c and Supplementary Fig. 12a), which aligns with the known function of SLFN5 in controlling viral replication44. Furthermore, the rs11080327-A allele was significantly associated with elevated SLFN5 expression in CD4 + T cells, confirming the response eQTL effect, which was originally identified in healthy individuals, of SLFN5 in T cells in a disease context (Fig. 5d). Moreover, this eQTL effect could be replicated using single-cell multiome data from an independent COVID-19 cohort, consisting of 43 patients. As shown in the Supplementary Fig. 12b, the rs11080327-A allele is suggestively associated with higher expression of SLFN5 in CD4 + T cells lymphocytes (p-value = 0.09, “Methods”). To sum up, the SLFN5-rs11080327 eQTL effect was (suggestively) replicated in patient data using two independent COVID-19 datasets with p-value 4.55e-05 and 0.09, respectively.
To understand how genetic variants regulate SLFN5 expression, we comprehensively investigated the locus. Specifically, we assessed the chromatin accessibility in CD4 + T cells using single-nuclei ATAC-seq data obtained from the same cohort of COVID-19 patients25 (Fig. 5e). This analysis revealed an open chromatin peak which harbors the eVariant and observed in CD4 + T cells of hospitalized and convalescent donors. Notably, we observed a significant correlation between this peak and SLFN5 expression in T cells (Spearman’s rho = 0.84, FDR-adjusted-p-value < 0.05), suggesting its potential regulatory roles. Subsequently, to determine the allelic effect of this OCR, we examined the allele-specific open chromatin effects in CD4 + T cells from hospitalized COVID-19 patients and convalescent individuals, respectively (Fig. 5f). The significant allelic imbalance of chromatin accessibility suggested that rs11080327-A is responsible for the elevated SLFN5 expression, a finding consistent with our differential expression analysis (Fig. 5d). In addition, TBX21, IRF4, and STAT1 have high binding affinities to motifs of rs11080327-A allele, indicating that the allele may interfere TF binding (Fig. 5g and Supplementary Fig. 12c–e). These suggest that the eVariant may interfere with the regulatory capacities of these TFs, aligning with the established roles of STAT1 on SLFN544,45.
To summarize, the integration of response eQTL from health and single-cell multi-omics data of COVID-19 patients unravels the genetic and epigenetic regulations of SLFN5 expression (Fig. 5h). Moreover, we also observed response eQTLs that are colocalized with complex traits involved in hosts’ immune responses, such as type 2 diabetes46 (Supplementary Fig. 12f, g).