
The temperature dependences of the R(ω) and σ1(ω) spectra obtained from the Kramers-Kronig analysis of the R(ω) spectra of CeRhSn along the a- and c-axes is shown in Fig. 1a, b, respectively. The significant axial dependence of the spectra reflects the anisotropy of the electronic state. The 4f spin-orbit doublet at ℏω ~300 and 700 meV, namely mid-IR peaks, originating from the strong c-f hybridization24, appears in both directions, even at 300 K (As shown in Fig. S1, a similar double peak structure appears in LaRhSn where no c-f hybridization occurs, but the energy positions are shifted from those of CeRhSn and the intensity ratio for E∥a and E∥c is opposite to that of CeRhSn. Additionally, the mid-IR peak in CeRhSn grows up at low temperatures. Therefore, the mid-IR peak is concluded to originate from the c-f hybridization). On the other hand, a clear anisotropic Drude response appears at ℏω ≤100 meV, which is consistent with the anisotropic electrical resistivity20. As LaRhSn has a weak anisotropy in the electrical resistivity, the temperature dependences of R(ω) and σ1(ω) spectra for E∥a and E∥c are also very similar as shown in Fig. S1a (See Supplementary information). This suggests that the axial dependence of this Drude structure is attributed to the anisotropic magnetic interactions.
Fig. 1: Polarized reflectivity and optical conductivity spectra of CeRhSn.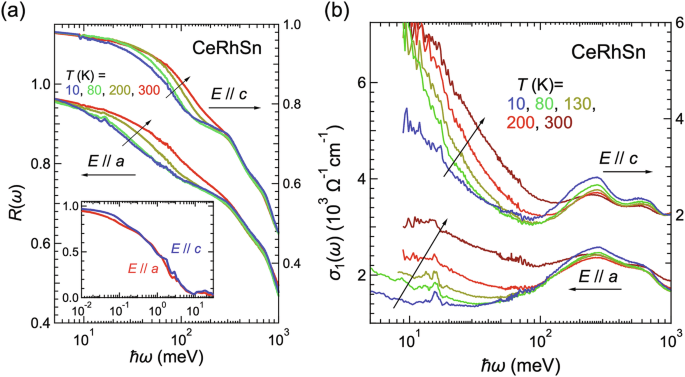
a Temperature-dependent polarized reflectivity [R(ω)] spectra of CeRhSn in the photon energy ℏω range of 5–1000 meV. Inset: Wide-range R(ω) spectra up to 30 eV at 300 K. b Temperature-dependent optical conductivity [σ1(ω)] spectra of CeRhSn with E∥a (bottom) and E∥c (top). The peaks at ℏω ~ 15 meV in both axes originate from phonons.
Valence fluctuation observed with mid-IR peaks
Firstly, the mid-IR peaks are compared to the band structure calculations. Figure 2a shows the band structure along high symmetry points of CeRhSn shown in Fig. 2c. In the right, the density of states (DOS) by the LDA calculations is presented. The high DOS in the range of 0 eV (= Fermi energy; EF) – 0.6 eV originates from the Ce 4f unoccupied states. The calculated band structure is regarded as fully itinerant; therefore, the itinerant character can be checked by comparing the experimental σ1(ω) spectra to the band calculation25. In Fig. 2d, the σ1(ω) spectra at 10 K with mid-IR peaks at about 0.2–0.3 and 0.6–0.7 eV are compared to the calculated σ1(ω) spectra. Significant peaks at ~0.1 and ~0.5 eV correspond to the experimentally observed mid-IR peaks, although the energy is shifted. A similar shift in energy was reported in the itinerant superconductor CeRh2As227. Therefore, in addition to the appearance of the mid-IR peaks at 300 K, the good correspondence of the mid-IR peaks to the calculated σ1(ω) spectra confirms the strong c-f hybridization strength24,28, which is consistent with the results of previous photoelectron experiments29,30. It should be noted that recent DFT+DMFT calculations on CeRhSn more reproduce the mid-IR peaks31, which also suggests the strong c-f hybridization intensity.
Fig. 2: Mid-IR peaks compared to the band calculations.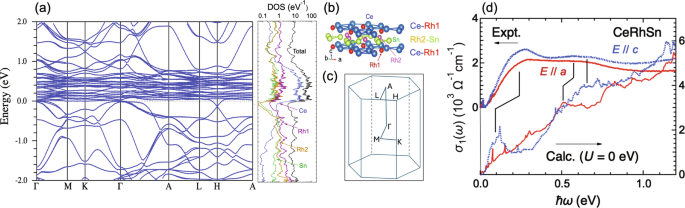
a Band structure and density of states (DOS) of CeRhSn by the LDA calculation with spin-orbit interaction. b Crystal structure of CeRhSn with a quasi-kagome Ce lattice in the basal plane. Rh atoms have two different sites, namely Rh1 and Rh2, corresponding to the different densities of states shown in (a). c The first Brillouin zone and high symmetry points of CeRhSn. d Calculated σ1(ω) spectra for E∥a (red solid line) and E∥c (blue dashed line) compared with the experimentally obtained σ1(ω) spectra after subtraction of the Drude component shown in Fig. S2 in the Supplementary information.
Extended drude analysis
Next, we discuss the spectral shape of the Drude component using the extended Drude analysis32. Figure 3 indicates the obtained mass enhancement (m*/m0, where m* and m0 are the effective mass of the quasiparticles and the rest mass of an electron, respectively) and the scattering rate (1/τ) along both directions. Here, the carrier densities along both axes for the extended Drude analysis were evaluated using the Hall coefficients at the lowest accessible temperature of 6 K20, i.e., 6.9 × 1020 cm−3 for E∥a and 4.2 × 1021 cm−3 for E∥c. In the low-energy limit, the effective mass increased with decreasing temperature in both directions. However, m*/m0 for E∥c increased continuously on cooling from 300 K, whereas m*/m0 for E∥a is almost unchanged down to 80 K, below which m*/m0 increased significantly. Also, in 1/τ, the peak energy at the lowest temperature is about 30 meV for E∥a and about 100 meV for E∥c. The peak energy corresponds to the energy at which m*/m0 begins to increase. These facts suggest the different characteristics of quasiparticles depending on the crystal axis. At the lowest temperature, 1/τ is proportional to ω1 for E∥a. On the other hand, for E∥c, 1/τ is roughly proportional to ω1.5, which is not ω1 nor ω2. It is known that 1/τ is proportional to ω2 in the normal Fermi liquid state33, but it is proportional to ω1 if the state is located very near QCP32. In the case that the state is slightly shifted from QCP but in an NFL state, 1/τ is proportional to ωn with 1 < n < 234. Therefore, the power dependence of 1/τ on ω indicates that the state along the a axis is located very near QCP and is slightly shifted from QCP along the c axis, but both axes are in NFL states. This result is consistent with the recently observed anisotropic NFL behavior in the specific heat23. In CeRhSn, the T-linear region is below 40 K (~3 meV). Even at 80 K, 1/τ is proportional to ℏω as shown in Fig. 3a2. This fact suggests that the Planckian form can be applied at temperatures below 80 K.
Fig. 3: Extended drude analysis.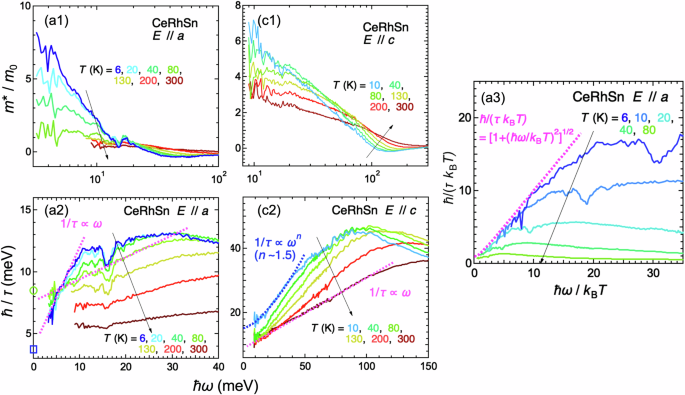
Mass enhancement (m*/m0, a1) and scattering rate (ℏ/τ, a2) as functions of photon energy and temperature for E∥a. ℏ/τ values at ℏω = 0 eV evaluated by the electrical resistivity and Hall coefficient data20 are plotted with an open circle (80 K) and an open square (6 K) in (a2). a3 ℏ/(τkBT) as a function of ℏω/kBT obtained from (a2), but the residual damping of ℏ/τ = 3.3 meV obtained from the electrical resistivity and the Hall coefficient is subtracted. The formula expected from the Planckian dissipation, \(\hslash /(\tau {k}_{{\rm{B}}}T)={[1+{(\hslash \omega /{k}_{{\rm{B}}}T)}^{2}]}^{1/2}\), is also plotted as a dashed line. c1, c2 Same as (a1, a2), but for E∥c. Note that the negative values and approaching zero of m*/m0 in (a1) and (c1) have no meaning because they appear in the photon energy regions outside of Drude components as shown in Fig. 1b.
In Planckian metals of NFL, ℏ/τ will follow \({[{(\hslash \omega )}^{2}+{({k}_{{\rm{B}}}T)}^{2}]}^{1/2}\), i.e., \(\hslash /(\tau {k}_{{\rm{B}}}T) \sim {[1+(\hslash \omega /{k}_{{\rm{B}}}T)]}^{1/2}\). The experimental ℏ/(τkBT) spectra subtracted by the residual damping ℏ/τ(0) = 3.3 meV evaluated from the extrapolated values of the electrical resistivity and Hall coefficient to 0 eV20 are plotted as a function of ℏω/kBT in Fig. 3a3. The slope in the region of ℏω/kBT ≤ 10 is scaled with ℏω/kBT. The ideal Planckian formula \(\hslash /(\tau {k}_{{\rm{B}}}T)={[1+{(\hslash \omega /{k}_{{\rm{B}}}T)}^{2}]}^{1/2}\) is also plotted in the figure. The formula can explain the slope, suggesting that the E∥a of CeRhSn is Planckian.
For E∥a, as shown in Fig. 3a2, the ℏ/τ at ℏω = 0eV decreases with decreasing temperature, which is the definition of Planckian metals, but that at ℏω ~ 10 meV shows the opposite behavior, i.e., the slope (dτ−1/dω) is strongly suppressed with increasing temperature. This result is in contrast to the parallel slope of ℏ/τ(ω) at different temperatures in a high-Tc cuprate13. However, as shown in Fig. 3a3, the constant slope of d(τ−1T−1)/d(ω/T) at different temperatures in the region of ℏω/kBT ≤ 10 following the Planckian scaling might be a property of heavy fermion materials.
Dynamical Planckian scaling
Finally, we discuss whether the temperature dependence of the Drude component can be explained with DPS. If DPS is realized, the temperature dependence of the σ1(ω) spectrum has a relationship11,14:
$${\sigma }_{in}(\omega )\cdot {T}^{\alpha }=f(\hslash \omega /{k}_{{\rm{B}}}T),$$
(1)
where σin(ω) is the real-part intrinsic optical conductivity and f(x) is a function and α = 1 for DPS.
Here, the σ1(ω) spectra in Fig. 1b comprise carriers’ contributions and interband transitions. The carrier component can be classified as “heavy” and “light” quasiparticles with and without strong electron correlation. On the other hand, the second contribution originates from the interband transition from the valence band to the c-f hybridization band with the Ce 4f spin-orbit splitting. Under these assumptions, the σ1(ω) spectrum is decomposed into two Drude (σin(ω) and σBG(ω) for the heavy and light quasiparticle components, respectively) and two Lorentz (corresponding to the Ce 4f5/2 amd 4f7/2 states) components as shown in Fig. S2. The individual contributions from heavy and light quasiparticles manifest in the several effective masses appearing in quantum oscillations35. In σ1(ω) spectra, the evidence of the light quasiparticles appears as a background of the Drude structure36,37. Then, we derive the heavy quasiparticles’ intrinsic optical conductivity σin(ω) spectra from the σ1(ω) spectra by subtracting the light quasiparticles’ background σBG(ω) and two Lorentzians. The DPS plot of σin(ω) is shown in Fig. 4a, b. (The DPS plot for all temperatures for E∥a is shown in Fig. S3 in Supplementary information. In E∥a, the standard deviation (SD) from a straight line to \(\log {\sigma }_{in}(\omega ){T}^{\alpha }\) vs \(\log \hslash \omega /{k}_{{\rm{B}}}T\) at different α values is plotted in the inset of Fig. 4. The minimum SD appears at α ~ 1.02, which is nearly equal to 1. The result is consistent with the case of YbRh2Si214, suggesting a universal behavior in heavy fermion materials. The DPS is realized at temperatures below 80 K for E∥a. However, for E∥c, the data are not scaled even with α = 1.5 and 2. Therefore, it could be concluded that the heavy quasiparticles only for E∥a follow the DPS.
Fig. 4: Dynamical Planckian scaling plot.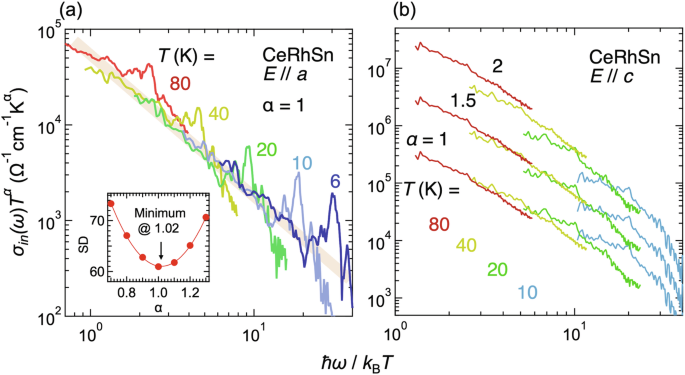
σin(ω) ⋅ Tα as a function of ℏω/kBT as shown in Eq. (1) for E∥a (a) and E∥c (b). The intrinsic heavy quasiparticles’ σin(ω) spectra were obtained by subtracting the background spectra due to light quasiparticles and interband transitions from the original σ1(ω) spectra. The broad solid line in (a) indicates a guide to the eye to indicate the scaling. DPS requires α = 1, but different α values are adopted for E∥c in (b). The inset of (a) shows the standard deviation (SD) of \(\log [{\sigma }_{in}(\omega ){T}^{\alpha }]\) vs \(\log [\hslash \omega /{k}_{{\rm{B}}}T]\) from a straight line as a function of α.
The maximum electrical resistivity along the a-axis appears at about 80 K, below which the coherent Kondo lattice is realized20. The fact suggests that the DPS for E∥a appears in the coherence state. It would be due to the geometrical frustration of the quasi-kagome structure. However, in the temperature regions where the DPS holds in Fig. 4a, the relation between \(\log [{\sigma }_{in}(\omega )\cdot T]\) and \(\log [\hslash \omega /{k}_{{\rm{B}}}T]\) is a straight line with the relation of \({\sigma }_{in}(\omega )\cdot T\propto {(\hslash \omega /{k}_{{\rm{B}}}T)}^{-1.8}\). In high-Tc cuprates, σ1(ω, T) ⋅ T is a universal function of ω/T based on the Drude formula12. The formula for ℏω/kBT ≫ 1 becomes \({\sigma }_{1}(\omega ,T)\cdot T\propto {(\hslash \omega /{k}_{{\rm{B}}}T)}^{-2}\). The relation of \({\sigma }_{in}(\omega )\cdot T\propto {(\hslash \omega /{k}_{{\rm{B}}}T)}^{-1.8}\) for CeRhSn is almost consistent with the simple formula. However, the order is inconsistent with the value of YbRh2Si2, where \({\sigma }_{in}(\omega )T\propto {(\hslash \omega /{k}_{{\rm{B}}}T)}^{-1}\)14. These results imply that the heavy fermion systems of CeRhSn and YbRh2Si2 follow the DPS but have individual scaling, which may provide a meaningful result. Further data should be accumulated to establish a universal DPS in heavy-fermion systems.
As shown in Fig. 3a3, the ℏ/(τkBT) curve can follow the Planckian scaling of \(\hslash /(\tau {k}_{{\rm{B}}}T) \sim {[1+(\hslash \omega /{k}_{{\rm{B}}}T)]}^{1/2}\) and ℏ/(τkBT) ~ 1 at ℏω = 0, which is consistent with quantum oscillation data, where ℏ/(τkBT) ~ 1 is observed6. The same carriers can probably be observed in quantum oscillations and optical conductivity experiments. On the other hand, thermodynamical properties at EF pronounce ℏ/(τkBT) = 0.01 − 0.02, where the Planckian dissipation is under debate15. The inconsistency in ℏ/(τkBT) should be resolved by the results of many further experiments.
In most three-dimensional Ce-based heavy-fermion materials in the vicinity of QCP, the mid-IR peaks are slightly visible owing to the relatively weak c-f hybridization intensity24,38,39,40. However, the mid-IR peaks clearly appear in CeRhSn, being the hallmark of strong valence fluctuation. The simultaneous appearance of the valence fluctuation and DPS owing to the quasi-kagome structure describes that the quantum criticality of CeRhSn is different from usual NFL heavy-fermions like CeCu6−xAux, where AFM correlations are responsible for the quantum criticality41.
Conclusion remarks
To summerize, polarized optical conductivity measurements and first-principles calculations of the quasi-kagome Kondo lattice material CeRhSn have revealed the anisotropic electronic structure and Drude response. Along the hexagonal a- and c-axes, the 4f spin-orbit doublet showing the strong c-f hybridization appears even at room temperature, indicating the strong c-f hybridization intensity. On the other hand, a renormalized Drude response at ℏω ≤ 100 meV indicates the formation of heavy quasiparticles. Analysis of the Drude structure shows that it follows the DPS only along the a-axis, resulting from the magnetic fluctuations based on the Ce quasi-kagome lattice. These findings support that the quantum criticality of CeRhSn coexists with the valence fluctuation. This work should motivate further investigation to clarify whether the anisotropic DPS commonly describes low-temperature responses of low-dimensional NFL heavy-fermion materials.