

Reversing groundwater depletion across the North China Plain
To investigate groundwater recovery in the NCP, we compiled an extensive dataset of in-situ groundwater level measurements from both unconfined and confined aquifers in urban and rural areas within the NCP. The establishment of China’s national groundwater monitoring project in 2018 markedly improved the spatiotemporal coverage and quality of in situ measurements. Prior to 2018, there were many temporal discontinuities in the monitoring data, but the advent of an automatic monitoring system thereafter provided continuous data. Post-2018, there was a notable increase in monitoring well density in the NCP, particularly in the southeastern portions and in confined aquifers (Supplementary Fig. 1). For unconfined aquifers, groundwater levels were deepest (≥40 m) in the piedmont plain in the western portion of the NCP and shallowest (≤10 m) in the eastern portion of the NCP (Supplementary Fig. 1a–d). For confined aquifers, groundwater heads were deepest (≥70 m) in the cities of Tianjin, Cangzhou, and Hengshui (Supplementary Fig. 1e–h). Rapid shallowing trends have been observed across the NCP in both unconfined and confined aquifers (Fig. 2). We calculated Theil-Sen slopes for depth to groundwater at monitoring wells during 2020–2024 (Fig. 2m) because 2020 marked the point of reversal in the average groundwater depth in the NCP. In unconfined aquifers, the most pronounced reversal in groundwater levels was found in the piedmont plain in the western portion of the NCP, with trends exceeding 1.5 m year−1 during 2020–2024. In confined aquifers, rapid shallowing trends in groundwater heads (≥1.5 m year−1) were evident in the piedmont areas, as well as in the cities of Tianjin, Cangzhou, and Hengshui. Additionally, wells with continuous measurements indicated recovery in both urban and rural areas (Fig. 2b–l).
Fig. 2: Trends in groundwater depths across monitoring wells in the North China Plain and comparisons with previously reported cases of recovery.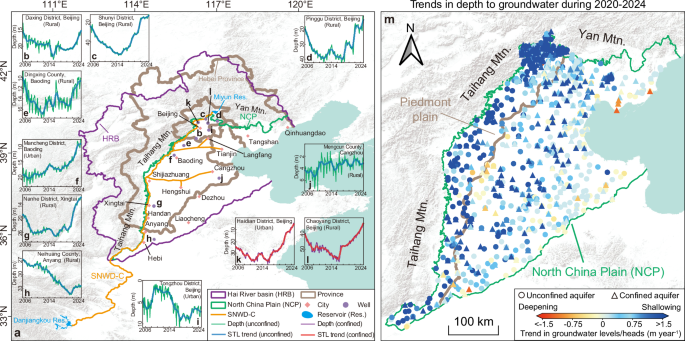
a Overview of the Hai River basin (HRB). The purple line represents the boundary of the HRB. The green line represents the northern and western boundary of the North China Plain (NCP), which is the plain portion of the HRB. Orange lines represent the central route of the South-to-North Water Diversion (SNWD-C). Blue polygons represent reservoirs. Brown lines represent the boundaries of Hebei Province and the provincial-level municipalities of Beijing and Tianjin (Province). Red diamonds represent major cities. Purple circles represent the locations of monitoring wells (b–l). b–j Instances of continuous depth to groundwater measurements in unconfined aquifers during 2005–2024. Green lines represent the depth to groundwater. Thick blue lines illustrate the long-term trends derived from STL decomposition. k, l Instances of continuous depth to groundwater measurements in confined aquifers during 2005–2024. Purple lines represent the depth to groundwater. Thick red lines illustrate the long-term trends derived from STL decomposition. m Trends in groundwater levels and heads at individual wells during 2020–2024. Circles indicate unconfined aquifers, while Deltas represent confined aquifers. Positive trends (blue) indicate shallowing groundwater, while negative trends (red) indicate deepening groundwater.
The groundwater level data indicate that the reversal of deepening trends in the average groundwater depth anomalies in both unconfined and confined aquifers occurred around 2020 (Fig. 3a). By the end of 2024, the average groundwater depth was ~11 m and ~27 m in unconfined and confined aquifers, respectively. In general, depths to groundwater in unconfined and confined aquifers are greatest in summer and smallest in winter, driven primarily by the combined effects of groundwater pumping for irrigation (peaking in spring) and recharge from precipitation (summer monsoonal rainfall accounting for ~60% of annual precipitation). Seasonal variability in groundwater depth within a year is ~1.5 m in unconfined aquifers and ~4 m in confined aquifers. To mitigate the impact of seasonal variability, we isolated the long-term trends in the groundwater depth anomaly time series after removing the seasonal variability using STL decomposition. Our analysis shows that the rate of deepening in groundwater depth in unconfined aquifers slowed before the reversal in 2020 compared to the deepening trend in the late 20th century. Historically, groundwater levels in unconfined aquifers in the Piedmont Plain declined at a rate of 1–2 m year−1 during 1984–200524. The deepening trend decreased to 0.2 m year−1 during 2005–2019, with relatively humid conditions in 2012 and 2016 contributing to mild recoveries. After the reversal in 2020, a rapid recovery rate of 0.7 m year−1 occurred during 2020–2024, with the average groundwater depth anomaly in unconfined aquifers in 2024 nearing levels last seen in 2005. For confined aquifers, we found a deepening trend of ~0.5 m year−1 during 2005–2019, followed by a recovery of ~4 m during 2020–2024. By 2024, the average groundwater head had returned to levels comparable to those in 2013. Notably, the recovery rates for both unconfined and confined aquifers decreased after 2021. Additionally, numerous sources have indicated a recovery in groundwater levels, as shown by the mitigation of land subsidence and re-emergence of springs in regions such as Beijing and Xingtai (see Methods).
Fig. 3: Time series and trends in groundwater depths across the North China Plain.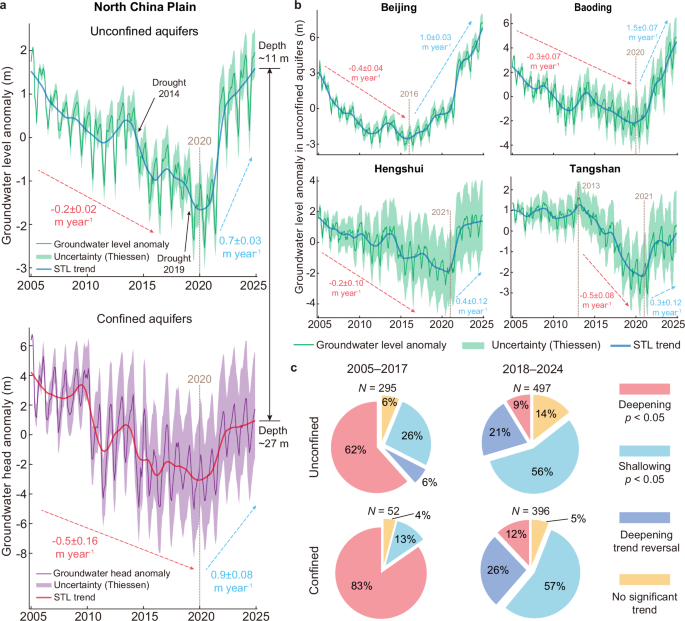
a Time series of average groundwater level anomalies in unconfined and average groundwater head anomalies in confined aquifers. The green and purple lines represent the average groundwater level and head anomalies in unconfined and confined aquifers, respectively. The thick blue and red lines illustrate long-term trends in unconfined and confined aquifers derived from STL decomposition, respectively. The green and purple shadows represent the uncertainty associated with the spatial distribution of the monitoring network and the application of the Thiessen polygon method in unconfined and confined aquifers, respectively. The dashed brown lines represent the timing of reversals. b Average groundwater level anomalies in unconfined aquifers at the city scale. Same legend as in (a). c Proportion of monitoring wells exhibiting deepening (p < 0.05, red), shallowing (p < 0.05, light blue), reversing (dark blue), and no significant trend (orange) during 2005–2017 and 2018–2024.
Beijing experienced the first reversal of deepening groundwater levels in unconfined aquifers, followed by other cities in the NCP (Fig. 3b). Monitoring data from Beijing, the city with the highest quality data in the NCP, indicated the earliest reversal in 2016, followed by a recovery rate of 1 m year−1 during 2016–2024. Since 2021, Beijing’s groundwater level has been shallower than it was in 2005. In Baoding, the reversal occurred in 2020, with a recovery rate of 1.5 m year−1 during 2020–2024. By 2024, the groundwater level in Baoding was shallower than in 2005. The recovery of groundwater levels in Hengshui and Tangshan has been ongoing since 2021, albeit at a slower rate of 0.4 m year−1 and 0.3 m year−1, respectively. The lower uncertainty in average groundwater depth anomalies for Beijing and the NCP, compared to Baoding, Hengshui, and Tangshan, underscores the importance of dense in-situ monitoring networks and comprehensive regional analysis in improving the reliability of groundwater assessments.
We identified and analyzed trends in groundwater depth at continuously monitored wells during 2005–2017 and 2018–2024 (Fig. 3c). A well displaying a monotonic deepening trend followed by a monotonic rebound was labelled as having a reversal of the deepening trend. For other wells, we assessed whether there was a significant deepening or shallowing trend (p < 0.05, MK test). Our findings show that significant deepening trends were predominant during 2005–2017, whereas significant shallowing trends became prevalent during 2018–2024. Approximately 62% and 83% of the monitoring wells in unconfined and confined aquifers show significant deepening trends during 2005–2017, respectively. Approximately 6% of the monitoring wells in unconfined aquifers, mainly in Beijing, experienced a reversal of the deepening trend during this period. In contrast, during 2018–2024, over half of the monitoring wells exhibited a significant shallowing trend, and about a quarter showed signs of a deepening trend reversal. These results align with the first reversal observed in Beijing in 2016 and the overall reversal at the NCP scale in 2020.
Water supply and usage in the Hai River basin
The total water supply in the HRB has remained relatively stable from 2005 to 2023, averaging ~37 km3 annually, but the contribution of different water sources has shifted significantly (Fig. 4a, b). In 2005, groundwater accounted for about two-thirds of the total water supply, with unconfined aquifers providing 18.7 km3, nearly three times the 6.6 km3 supplied by confined aquifers. Around 2009, groundwater extraction from confined aquifers began to decline, providing 5% less in 2014 relative to the volume provided in 2005, with reclaimed water compensating for most of this reduction. Meanwhile, surface water supply from reservoirs increased (+1.8 km3) during 2005–2023 and now constitutes over a quarter of the total water supply. Water diverted from the Yellow River remained stable at ~4.4 km3 annually, representing 10% of the total water supply, except for a spike in 2019 and 2020. Reclaimed water use grew steadily, reaching 4.4 km3 by 2023 and accounting for 12% of the total water supply in 2023. Reclaimed water is primarily used for river and lake replenishment, as well as for sanitation, landscape irrigation, and industry. Despite initiatives promoting desalination, the use of desalinated seawater in the HRB has remained minimal, with an annual capacity of ~0.25 km3 in 2023, contributing <1% to the total water supply.
Fig. 4: Annual water supply and usage in the Hai River basin.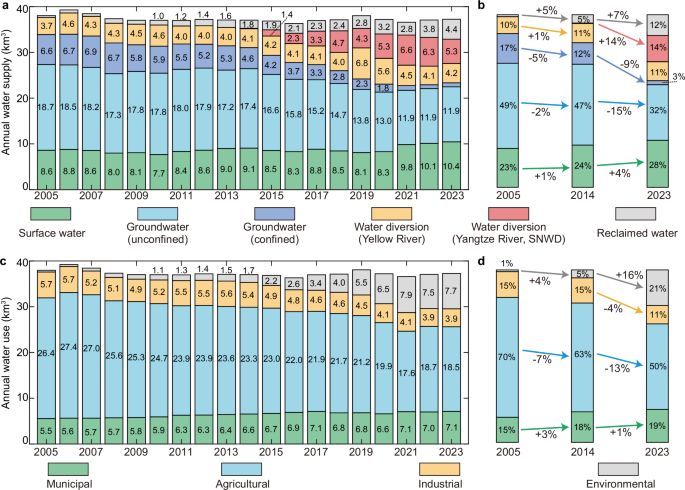
a Annual water supply from various sources (km3), including surface water from reservoirs, groundwater from unconfined and confined aquifers, water diversion from the Yellow River, water diversion from the Yangtze River (South-to-North Water Diversion, SNWD), and reclaimed water. b Proportions of total water supply in 2005, 2014, and 2023. c Annual water use across different sectors (km3), including municipal, agricultural, industrial, and environmental water usage. d Proportions of total water use in 2005, 2014, and 2023.
The central route of the South-to-North Water Diversion (SNWD-C), which began operations in December 2014, introduced significant diversification into the water supply structure of the HRB. The SNWD-C was designed to divert 9.5 km3 of high-quality water annually from the Danjiangkou Reservoir on the Han River, the largest tributary of the Yangtze River, to northern China. The eastern route of the SNWD (SNWD-E), which diverts water from Jiangdu near the Yangtze River, supplies a small amount of water (~0.2 km3 year−1) to the southeastern parts of the NCP, with the majority benefiting areas in Shandong Province outside the NCP. In 2023, the SNWD provided 5.3 km3 of water, accounting for 14% of the total supply, making it the third largest source after unconfined aquifers (11.9 km3, 32%) and surface water from reservoirs (10.4 km3, 28%).
Groundwater usage in 2023 (~13 km3) was nearly half of what it was in 2005 (~25 km3), with a steeper decline in confined aquifers (~85% reduction) than in unconfined aquifers (~36% reduction) from 2005 to 2023. By 2023, pumping from confined aquifers decreased to <1 km3, accounting for only 3% of the total water supply. This greater reduction in confined aquifer use is largely attributed to its greater substitution by water from the SNWD project. Historically, confined aquifers, valued for their high water quality, have been a primary source for municipal use, particularly because unconfined aquifers are more vulnerable to contamination. With the introduction of water from the SNWD project, groundwater from confined aquifers that had been used for municipal supplies has increasingly been replaced, thereby reducing groundwater pumping. However, the SNWD supply is affected by drought conditions in its source areas. For example, drought conditions upstream of the Danjiangkou Reservoir led to the SNWD supply being decreased by 16% from 2022 to 2023 (from 6.3 km3 to 5.3 km3).
Despite generally stable total water use, a shift towards increased allocation to environmental flows has led to a reduction in total municipal, agricultural, and industrial use, from 37.6 km3 in 2005 to 29.5 km3 in 2023 (Fig. 4c, d). Agricultural water use, which accounted for 70% of the total in 2005, has steadily declined to 50% by 2023. In addition to a ~ 10% decrease in cropland area (Supplementary Fig. 2), this reduction is attributed to policies aimed at mitigating water shortages and curbing groundwater extraction, including adjustments to cultivation practices, dryland farming, seasonal fallow, and use of plastic mulch to conserve soil moisture30. Municipal water use increased by ~30% during 2005–2023, driven by population growth, while industrial water use decreased by a similar percentage due to conservation efforts31. Environmental water use, which includes watering trees and grasslands as well as replenishing lakes and rivers17, has been over 7 km3 since 2021, becoming the second-largest water use sector (>20% of the total) after agriculture. Reclaimed water, along with water diverted from the Yellow and Yangtze rivers and surface water from reservoirs32, plays a crucial role in supporting these environmental flows17.
Water diversion and aquifer restoration policies drive groundwater recovery
The observed groundwater recovery in the NCP is primarily attributable to sustained human intervention, with wet years (e.g., 2021) providing additional but temporary reinforcement (Fig. 5). A pivotal measure was the substitution of groundwater pumping with water from SNWD-C. Initially, in 2015, Beijing received the bulk of diverted water (0.8 km3 out of 1.4 km3 delivered to the NCP), which led to an early recovery of groundwater levels beginning in 2016. This recovery remained resilient even during droughts in 2019 and 2022 (Fig. 5c). After 2020, SNWD-C deliveries expanded to other parts of the NCP, reaching over 4 km3 per year and supporting a broader reversal of regional groundwater declines (Fig. 5a).
Fig. 5: Groundwater depth response in unconfined aquifers to precipitation variability.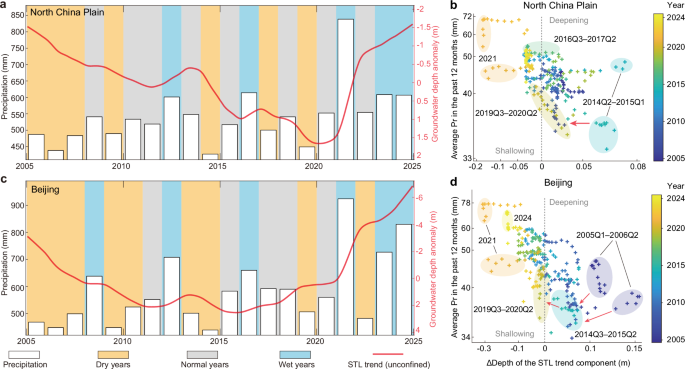
a Annual precipitation in the Hai River basin (HRB, white bars) and average groundwater depth anomalies in unconfined aquifers across the North China Plain (NCP). Background shading denotes dry (orange), normal (gray), and wet (blue) years. The red line shows the long-term trend in average groundwater depth anomalies, derived via STL decomposition. b Scatter plot relating 12-month average precipitation (Pr) in the HRB to the corresponding change in the STL trend component of groundwater depth anomalies in the NCP. Both axes use logarithmic scales. Point colors indicate months, and labels such as “2014Q2” denote the year and calendar quarter. The red arrow indicates the leftward shifts observed during droughts. The dashed gray line indicates a stable trend. c Same as (a), but for Beijing: annual precipitation and groundwater depth anomalies in unconfined aquifers. d Same as (b), but for Beijing: precipitation-groundwater trend relationships based on STL decomposition.
The coupling between precipitation and groundwater depth anomalies further highlights the impact of these interventions (Fig. 5b, d). A systematic leftward shift in precipitation-groundwater scatter plots indicates increasingly shallow groundwater conditions, even under similar rainfall conditions. These shifts are particularly pronounced during drought years (the red arrow in Fig. 5b), suggesting that the interventions have altered the groundwater balance and strengthened the system’s resilience. A similar pattern is observed in Beijing (Fig. 5d), where 2024 groundwater depths significantly improved compared to 2005. Although the extreme rainfall in 2021 temporarily accelerated groundwater recovery, its effect was short-lived, as soil moisture returned to baseline levels by early 2022 (Supplementary Fig. 3). In contrast, the continued groundwater rises in Beijing (2016–2020) and the ongoing NCP-wide recovery since 2022 underscore the effectiveness and durability of policy-led groundwater restoration efforts.
MAR and reduced irrigation-related pumping are critical strategies for restoring depleted aquifers (Fig. 6a–c). For years, rivers in the NCP had dried up due to upstream reservoir interception and declining groundwater levels. Experimental river replenishment began in 2018 in the Fuyang, Hutuo, and Juma rivers. Since then, over 10 km3 of water from the SNWD project has been allocated to restore rivers across the NCP by 2024. Additional contributions came from Yellow River diversions and local reservoirs, benefiting rivers (e.g., the Yongding River) and lakes (e.g., the Baiyangdian Lake). These efforts have rejuvenated drying rivers, restored riparian ecosystems, and enhanced aquifer recharge. Wells near replenished rivers exhibited more rapid groundwater recovery rates (Fig. 6b), confirming the effectiveness of river-based MAR. Other MAR methods, including flood-restoring recharge ponds and injection wells targeting confined aquifers, were employed but at smaller scales. In parallel, changes in irrigation practices also contributed to partial recovery. The NCP’s dominant double cropping system (winter wheat and summer maize rotation) requires intensive spring irrigation, historically sustained by groundwater pumping. Between 2013 and 2018, the area under double cropping declined by ~10,000 km2 30. In rural areas between Beijing and Langfang, where the reduction was the greatest30, groundwater recovery began as early as 2013–2014 (Fig. 6c). Since 2018, further decline in double-cropped area has slowed, as diverted water has allowed local surface water to be redirected for irrigation30. In contrast, the southeastern NCP retained stable cropping patterns due to reliance on Yellow River diversions. Despite the cropping adjustments, regional food production in Beijing, Tianjin, and Hebei rose from ~28 million tons in 2005 to ~42 million tons in 2023 (Supplementary Fig. 4)33, aided by increased yield per unit area, helping to ensure local food security.
Fig. 6: Engineering and policy approaches for reversing groundwater depletion.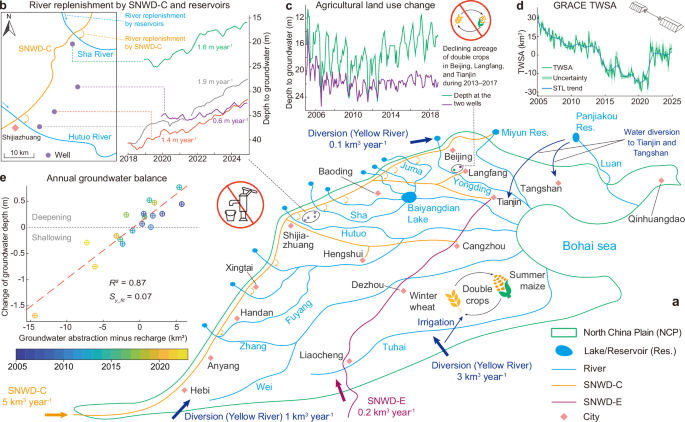
a Water diversion and river replenishment in the North China Plain (NCP). The green line represents the boundary of the NCP. Blue polygons represent lakes and reservoirs. Blue, orange, and dark red lines represent rivers, the central route of the South-to-North Water Diversion (SNWD-C), and the eastern route of the South-to-North Water Diversion (SNWD-E), respectively. b Groundwater depth in unconfined aquifers near replenished rivers. Green, purple, gray, and red lines correspond to four monitoring wells located between the Sha and the Hutuo rivers from 2018 to 2024. c Groundwater depth in unconfined aquifers in areas where double-cropped acreage declined substantially between 2013 and 2017. Green and purple lines represent two representative monitoring wells. d GRACE-derived total water storage anomalies (TWSA) in the NCP. The green line shows the average of the JPL and CSR mascon products; the shaded green area shows their spread. The thick blue line represents the trend (based on STL decomposition). e Annual groundwater balance in the NCP from 2005 to 2023. The x axis shows net groundwater abstraction (abstraction minus recharge) based on Hai River Water Resources Bulletins (km3). The y axis represents the annual change in the trend in groundwater depth (based on STL decomposition) in unconfined aquifers, with the dashed gray line indicating a stable trend. Sy_fit indicates the fitted specific yield derived from the slope of the balance-depth relationship.
Groundwater depth recovery observed in monitoring wells is consistent with both satellite-based and water balance estimates (Fig. 6d, e). Interannual changes in groundwater depth in unconfined aquifers show a strong linear relationship (R2 = 0.87) with net water balance deficits, calculated as annual groundwater abstraction minus recharge from the Hai River Water Resources Bulletins (Fig. 6e). The fitted specific yield (Sy_fit) of 0.07 generally matches reported values of ~0.12 in the piedmont plains and ~0.04 in other regions of the NCP25, supporting the reliability of the water balance approach34 (see Methods). Satellite observations from GRACE and GRACE-FO show a recovery in total water storage anomalies (TWSA) beginning around 2020 (Fig. 6d), yet this rebound compensates for only about half of the ~49 km3 of total water storage depletion between 2005 and 2019. Based on a 3 m decline in groundwater level and the estimated Sy_fit, unconfined aquifer storage alone decreased by ~27 km3 during this period. Confined aquifers, characterized by much smaller storage coefficients (0.0004–0.004), contributed relatively little to the total depletion, indicating that the majority of groundwater loss occurred in unconfined systems25. Discrepancies between GRACE TWSA data and in-situ groundwater trends likely stem from variations in soil and surface water storage, uncertainties in specific yield and storage coefficients, or inherent limitations in GRACE resolution. A full attribution of these differences is beyond the scope of this study.