
In quantum materials, Coulomb interactions can cause two types of effects. In the first, phases with spontaneously broken symmetry can emerge, even when the interaction strength U is relatively small compared with the bandwidth W. Fermi surface instabilities develop through peculiarities in the band structure. These instabilities, arising from phenomena like the Van Hove singularity or Fermi surface nesting, give rise to a wide range of electronic orders, which can manifest as the spatial modulation of spin, charge or current1 to density waves that break time-reversal symmetry2,3. The second type of effect arises when the interaction strength U reaches or exceeds the bandwidth W, so that quantum fluctuations become pronounced. This results in non-Fermi-liquid (NFL) behaviour, which is most strikingly evidenced by a linear temperature dependence of the resistivity rather than the quadratic temperature dependence typical of Fermi-liquid behaviour. This strange metallicity signifies the breakdown of the Fermi-liquid quasiparticle paradigm and is often accompanied by the emergence of unconventional superconductivity at lower temperatures4,5.
Prototypical heavy-fermion metals represent a canonical example of this regime of amplified quantum fluctuations. Our understanding of this regime relies on the role of f-electron local moments through the competition between Kondo and Ruderman–Kittel–Kasuya–Yosida interactions6. Strange metallicity develops in the quantum critical regime, where the fluctuations between a ground state of the local moments forming Kondo singlets with the conduction electrons and one in which they form spin singlets among themselves, thereby destroying the Kondo singlets7,8,9,10. Spectroscopically, prototypical heavy-fermion metals exhibit a zero-bias peak–dip structure11,12. There is a growing indication that the strange metallicity and related singular properties have a large degree of commonality across materials platforms5, but how that happens microscopically remains unclear.
Flat bands near the Fermi energy promise to shed new light on this universality13. In these systems, the interaction strength can readily exceed the width of the flat band. The empirical evidence is particularly clear in kagome metals with active flat bands and their three-dimensional counterparts, the pyrochlore metals. Experiments have identified strange-metal behaviour14,15,16 as well as a phase diagram17, both of which resemble what are seen in heavy-fermion metals. Yet, the nature of the moments that act as the 4f electronic degrees of freedom has thus far remained elusive. The kagome flat bands result from the destructive quantum interference of the orbitals on the kagome sites. Recent studies have analysed these systems through the concept of compact molecular orbitals (CMOs)18,19,20. As a representation of the states localized by destructive interference and, crucially, in a symmetry-preserving way that forms an orthonormal basis, the localized orbitals seem to capture the essential microscopic elements behind the formation of flat bands. These emergent degrees of freedom experience substantial Coulomb interactions, and they are the analogue of the 4f electrons in heavy-fermion systems. Their couplings to the more extended light-band orbitals result in phenomena such as quantum criticality and strange metallicity18,19,20. This Kondo description realizes selective Mott correlations of the molecular orbitals. Flat bands near the Fermi level have only recently been discussed for CsCr3Sb5, Fe-doped CoSn and pyrochlores15,17,21,22,23. The universality in the regime of amplified quantum fluctuations may also cover other flat-band systems13, including moiré structures, for which the Kondo analogy is also being pursued24,25,26.
Here we demonstrate that these emergent localized states act as the essential microscopic building blocks that relate the formation of the kagome flat band with the onset of strange-metal phenomenology. Although the rare-earth atomic orbitals in heavy-fermion systems that dominate the low-energy physics can be seen, for example, by measuring the atomic form factors using neutron scattering and other spectroscopic means, in kagome metals, the analogous moments are distributed over a more extended spatial range. Thus, they naturally lend themselves to probing by atomic-scale spectroscopic mapping with scanning tunnelling microscopy (STM). Moreover, a CMO, being a linear superposition of atomic states, encodes a definite phase relation between the atomic states. We carry out such measurements with sub-unit-cell resolution. We further show the interaction of the emergent flat-band moments with light Dirac bands through spectroscopic imaging, in which the scattering among the wide bands is suppressed at the flat-band energy. This is a direct result of the loss of quasiparticles within the strange-metal phase, which resembles the amplified quantum fluctuations. Additionally, the zero-bias peak–dip spectra evolve with temperature and magnetic field, akin to their heavy-fermion counterparts11,12.
We investigated Ni3In, whose strange-metal characteristics are well established14,27. Ni3In crystallizes in the P63/mmc space group, and its crystal structure can be seen as AB-stacked kagome lattices (Fig. 1a). Within the individual kagome layers, the Ni–Ni bond lengths are slightly different: 2.78 Å and 2.57 Å for the wider triangle (dark blue) and the narrower one (light blue), respectively. The inter-kagome hybridization gives rise to a destructive quantum interference process, resulting in a hardly dispersing flat band in the kagome plane. When spin–orbit coupling is considered, a topologically non-trivial gap is expected14,28 (Supplementary Section 1). We show below that the bilayer nature, paradoxically, simplifies the construction of the CMO29. Away from the a–b plane, it shows a finite dispersion14. Density functional theory (DFT) calculations show a simple electronic band structure near the Fermi level at an out-of-plane momentum kz = 0 Å−1 (ref. 14; Fig. 1b). The flat band is mainly formed by the dyz + dxz orbitals when viewed in the global basis, that is, with the x, y and z axes of each Ni atom being the same as the global x, y and z axes. The flat band has a bandwidth WDFT ≈ 90 meV and crosses a Dirac nodal ring at E = −12 meV, where the nodal ring is predominantly formed by the same dyz + dxz orbitals in one branch and by \({d}_{xy}+{d}_{{x}^{2}-{y}^{2}}\) in the other. The saddle point of the kagome dispersion with the same orbital composition, dominated by \({d}_{xy}+{d}_{{x}^{2}-{y}^{2}}\), is seen at E = −250 meV (ref. 30).
Fig. 1: Zero-bias dip-peak spectrum and its relation to the Doniach phase diagram.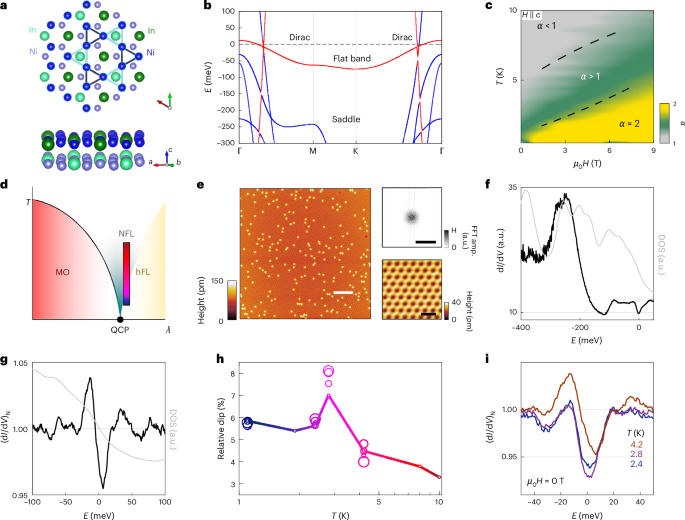
a, Ni3In crystal structure. The light coloured atoms represent the underlying kagome layer. The dark blue Ni–Ni bond length is 2.78 Å. The light blue one has a length of 2.57 Å. b, The bulk electronic band structure of Ni3In. In red, the bands are mainly dominated by the dyz + dxz orbitals. c, Phase diagram of the exponent α = T(dρ/dT)/(ρ − ρ0), where ρ0 = \(\mathop{\rm{lim}}\limits_{T\to \,0}\rho (T)\) (ref. 27). d, The location of Ni3In, represented by the temperature colour scale, in the Doniach phase diagram, which hosts a magnetically ordered phase, a hFL and a NFL, all emanating from a quantum critical point. λ denotes a tuning parameter, which in Ni3In is the applied magnetic field H. e, Large-scale topography (applied bias voltage Vbias = −250 mV and current set point Isp = 50 pA; scale bar, 5 nm). Top inset: the Fourier transform of the same area (scale bar, 10 nm−1). Bottom inset: high-resolution topography (Vbias = 30 mV and Isp = 50 pA; scale bar, 1 nm). f, Large energy interval dI/dV spectrum (Vbias = 50 mV and Isp = 200 pA) taken at an In site. g, Higher-resolution dI/dV spectra, recorded at a Ni site, showing a zero-bias peak–dip structure (Vbias = −100 mV and Isp = 250 pA). Here and in the following, the spectrum is normalized by the value at 20 meV, right above the dip (dI/dVN = (dI/dV)/(dI/dVV=20meV)), both measured at T = 4.2 K. The grey lines are the calculated momentum-integrated surface DOS. h, Temperature dependence of the relative dip, defined by the suppression of the DOS at the dip minimum. Larger symbols are used for higher magnetic fields. The solid line is a guide to the eye. i, Temperature dependence of dI/dV (Vbias = −100 mV and Isp = 250 pA). FFT amp., fast Fourier transform amplitude; MO, magnetically ordered phase; QCP, quantum critical point.
We study here thin films of Ni3In on SrTiO3 grown by molecular-beam epitaxy (ref. 27). These films contain crystallites of Ni3In amidst an amorphous conducting mash (Extended Data Fig. 1 and Supplementary Section 2). Magneto-transport measurements of the crystallites find a phase diagram consistent with previous single-crystal studies14,27. At temperatures above 1 K, we unveiled an NFL state characterized by a power-law temperature dependence ρ ∝ Tα that evolved through several regimes (Fig. 1c). We mainly focused on the low-temperature crossover from Fermi-liquid behaviour for α ≈ 2 (yellow region) to NFL behaviour for 1 ≤ α ≤ 2 (green region) at a field-dependent temperature of about 2 K. At higher temperatures, the NFL behaviour continued to evolve as α dropped below 1 (grey region) with possible spin coherence, and it ended with the strange-metal phase for α ≈ 1 at elevated temperatures of the order of 100 K (ref. 27; Extended Data Fig. 1). The enhanced Kadowaki–Woods ratio and Sommerfeld coefficient27 indicate stronger interactions among the charge carriers. Raman spectroscopy measurements further showed fingerprints of Kondo coherence31. All these indicate that Ni3In is close to a quantum critical point (Fig. 1d).
Establishing the on-site correlations
Motivated by this intriguing phenomenology, using STM and spectroscopy, we visualized and explored the role of the Fermi-level flat band in thin films of Ni3In (Supplementary Section 2). To obtain thin films with a clean surface, we first annealed them in ultrahigh vacuum and then searched the topography for Ni3In crystallites. Representative large-area topographies show low concentrations of adatoms and defects, indicative of the high-quality samples investigated in this work (Fig. 1e). The Fourier transform revealed hexagonal Bragg peaks, from which we extracted a lattice constant a = 5.31(2) Å. This value aligns closely with the bulk lattice constant abulk = 5.29 Å (ref. 14), indicating that there was no surface reconstruction. The high-resolution topography of such an Ni3In island revealed a hexagonal lattice (Fig. 1e). Here the three Ni atoms at the edge of the six triangles of the kagome layer were not fully resolved, and instead, the corner of the hexagon was in the middle of the Ni triangles. This is consistent with previous STM observations of many kagome materials, such as Co3Sn2S2, AV3Sb5 (A = K, Rb or Cs), Mn3Sn, CoSn and RT6Sn6 (R is a rare earth and T = V or Mn)32,33.
Having obtained a flat and clean surface, we focused on the differential conductance (dI/dV) spectroscopy, as shown in Fig. 1f (black line), along with the calculated integrated density of states (DOS), η(E) (grey line). For non-interacting single-particle states, we expected dI/dV ∝ η(E) to hold34. At E ≈ −250 meV, we found a notable peak in the spectrum, which corresponded to the kagome saddle point30 (Fig. 1b) and anchored the chemical potential of the DFT calculation marked by the dashed line in Fig. 1b. More interesting are the spectral features at the vicinity of the Fermi level, which seem to deviate from the single-particle picture captured by the DFT calculations. In the high-resolution measurements in Fig. 1g (black line), we found a peak–dip structure around zero bias. The band structure calculations show that the crossing point between the flat band and the Dirac nodal rings occurred at E = −12 meV, which coincided with the centre of the observed peak in the differential conductance spectrum. However, our calculation (grey line) showed only a shallow shoulder at E = −12 meV as a possible hint for the presence of the flat band. The reduced peak in the integrated DOS may be related to the finite out-of-plane dispersion of the flat band (Supplementary Section 3). Even more puzzling is the dip structure around the Fermi level, which was completely absent in our single-particle DOS calculation. Structures around the Fermi energy have been reported in kagome metals, often linked to a charge-density wave33 and many-body resonances35. For Ni3In, charge instabilities are not expected31, nor do our STM measurements have any further signatures of a density wave.
The zero-bias peak–dip spectrum resembles a Fano line shape (Supplementary Section 4). The Fano spectrum in the tunnelling DOS (tDOS) is usually associated with two distinct mechanisms. The first involves the Kondo screening of magnetic impurities by a metal. The Kondo screening forms a zero-bias resonance, and the interference between co-tunnelling to that resonance and the metal leads to an asymmetric peak–dip structure in the spectrum36. The second mechanism occurs in heavy-Fermion materials where deep 4f moments interact with a Fermi-level light band to form a zero-bias flat band that hybridizes with the light band and opens a hybridization gap. Here the peak signifies the flat band, whereas the dip signifies the gap11,12,37,38. Ni3In hosts neither magnetic impurities nor a partially filled core f shell, yet it shows strange-metal phenomenology akin to that of heavy-Fermion systems (Fig. 1c,d, respectively) and a Fano-like peak–dip spectrum at zero bias. Nevertheless, it has a kagome flat band at the Fermi level.
To explore the origin of the zero-bias peak–dip spectrum and its relation to the kagome flat band in Ni3In, we examined the response of the peak–dip spectrum to varying temperatures and magnetic fields. The spectra have a non-monotonic evolution with temperature, as demonstrated in Fig. 1i. With increasing temperature, the dip first deepened and then decreased as the peak increased in height and width. The full temperature evolution that we extracted from individual spectra is summarized in Fig. 1h, which shows the temperature dependence of the gap depth relative to the differential conductance value just above it (Supplementary Section 5). We validated this temperature evolution through two complementary ways. First, we reproduced it in different tip and sample configurations. Then, we took extreme care to maintain the same robust tip state (Supplementary Section 5). Intriguingly, the relative dip exhibits a narrow maximum at the intermediate temperature of 2.8 K, about which we also found the crossover from heavy Fermi liquid (hFL) to NFL behaviour in resistivity. The response of the peak–dip spectrum to the magnetic field is also distinct on either side of this crossover temperature (Extended Data Fig. 2). We, thus, found that the dip is suppressed with increasing temperature (Fig. 1h) and then with increasing field (Supplementary Section 5), in correspondence with the crossover to the NFL magneto-transport and the Doniach phase diagram.
Imaging the molecular orbital-selective correlations
We next explored the origin of the zero-bias peak–dip spectrum and its relation to the kagome flat band in Ni3In. The kagome flat band originates in the destructive interference between the orbitals, and as such, its wavefunction is predicted to have a unique localization pattern20. To resolve this, we obtained spectroscopic imaging maps in clean areas and constructed their super-resolved unit cell to visualize the energy dependence of the wavefunction localization with an optimal sublattice resolution39,40,41 (Fig. 2 and Supplementary Section 6). At energies above and below the peak–dip structure, the electronic wavefunction was localized at the centres of three out of the six Ni triangles, as exemplified in Fig. 2a,b (Extended Data Fig. 3). However, at the energy interval of the peak–dip spectrum around zero bias, the wavefunction shifted to a Ni site, as demonstrated in Fig. 2c,d.
Fig. 2: Real-space wavefunction distribution and its evolution as a function of energy.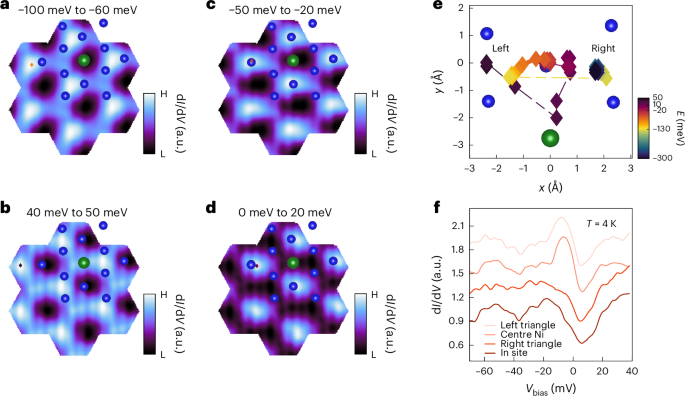
a–d, Super-resolved unit cell maps obtained by averaging the differential conductance maps for the energy intervals: −100 meV ≤ E ≤ −60 meV (a), 40 meV ≤ E ≤ 50 meV (b), −50 meV ≤ E ≤ −20 meV (c) and 0 meV ≤ E ≤ 20 meV (d) (Vbias = 50 mV, Isp = 200 pA and modulation voltage VAC = 7.5 meV). Blue and green circles mark the Ni and In lattice sites, respectively. The diamond symbols mark the centre of mass of the wavefunction. e, Energy evolution of the centre of mass position of the wavefunction. Left and right denote the left-hand and the right-hand Ni triangles. f, Full dI/dV spectra for the centre of mass positions at different energies corresponding to diamond symbols in a–d. H, high; L, low.
We extracted the local centre of mass of the wavefunction, and we track in Fig. 2e its evolution with energy. At low bias and up to about −150 meV, the wavefunction was fixed at the centre of the right-hand triangle. At about −130 meV, it shifted to the centre of the left-hand triangle, subsequently gradually moving towards the Ni site. Its position remained stable at the Ni sites between approximately −50 meV and 20 meV, which corresponds to the peak–dip structure energies. At these energies, the electronic structure apparently broke the C3 symmetry while preserving C2, which is consistent with sudden changes in the spectrum42 (Supplementary Section 6). Finally, at higher energies, the wavefunction shifted back to the centre of the left-hand triangle. This evolution of the wavefunction distribution agrees nicely with an evolution extracted from an independent Bragg peak phase analysis (Extended Data Fig. 4). The super-resolved cell construction also enabled us to accurately compare subtle spectral changes across different points within the unit cell, as shown in Fig. 2f (Supplementary Section 6). Although the dip seems rather uniformly distributed, the peak feature was localized on a Ni atom and absent elsewhere.
This low bias on the Ni localization pattern of the wavefunction contradicts the DFT prediction. A partial charge-density projection obtained from our slab DFT peaks at three of the six Ni triangle centres across a broad energy interval, −0.5 eV ≤ E ≤ 0.5 eV, is shown in Fig. 3a (on the corners of the dashed unit cell). We, therefore, analysed the wavefunction structure from the point of view of emergent localized orbitals18,19,20. We first considered a simplified model that includes only an intra-unit-cell hopping term t1 between the top and bottom layers (Fig. 3a). The constructed elementary band representations are dominated by the dxz orbitals, which describe the topological flat band (Supplementary Section 7). To obtain the tDOS, we projected the elementary band representations onto the tunnelling matrix:
$$\mathrm{tDOS}(V\,)=\frac{2{\rm{\pi }}e}{\hslash }\mathop{\sum }\limits_{nk}{\left|\left\langle \,p\right|\hat{T}\left|{\psi }_{nk}\right\rangle \right|}^{2}{\rm{\delta }}\left(eV-{E}_{nk}\right).$$
(1)
Here e is the charge on an electron, ℏ is the reduced Planck constant, the δ function denotes the count of the states at a particular energy Enk and the tunnelling matrix \(\widehat{T}\) results in interference between \(\left|p\right\rangle\), the probe states (the electronic states of the tip) and the ψnk eigenstates34. The spatial distribution of the zero-bias tDOS across the unit cell is shown in Fig. 3b. Notably, the flat-band peak is localized on Ni sites, as we visualized in spectroscopic mappings (Fig. 3c,d).
Fig. 3: CMOs and their interactions with the Dirac band.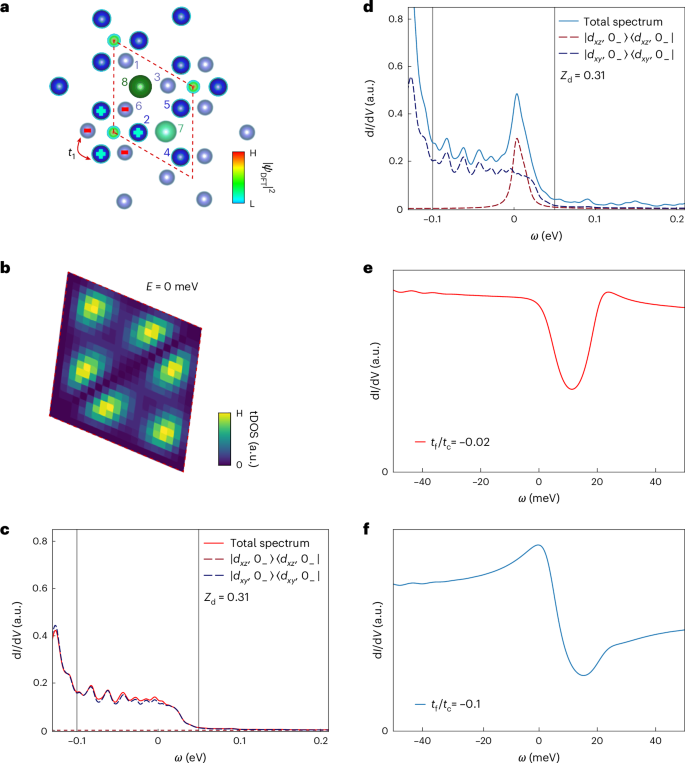
a, Ni3In crystal structure showing the location of the projected charge density ∣ΨDFT∣2 for −0.5 eV ≤ E ≤ 0.5 eV. The DFT wavefunction is localized at the centres of the triangles (corners of the unit cell marked by a dashed line). t1 denotes the hopping term used for the simplified model. b, Simplified calculation of the spatial distribution of the zero-bias tDOS of the intra-unit cell (t1) within the unit cell denoted by the red dashed line in a. c,d, CMO-based calculation of the tDOS for the tip positioned at the centre of a small In triangle (corners of the dashed diamond in a) (c) and on a Ni site (1–6 in a) (d). The grey vertical lines represent the energy window explored experimentally. Zd is the quasiparticle weight and ω is the energy. e,f, CMO-based calculation of the tDOS when the light bands and heavy bands are coupled with the tip at the same locations as c (e) and d (f). The ratio tf/tc is the tunnelling ratio between the molecular orbitals and the Dirac light bands.
Yet, a model that accounts for intra-unit-cell hoppings alone is insufficient to accurately capture the wavefunction structure, especially that of the flat band. We constructed a comprehensive CMO model that shows the validity of the calculated tunnelling states, which also captured the role of electronic correlations. For that, we considered that the AB-stacked nature of Ni3In fully describes the flat band along the kz = 0 Å−1 plane29 (Supplementary Section 7). We constructed a CMO consistent with the lattice symmetries and the elementary band representation of the flat band:
$$\left|{d}_{xz},{0}_{-}\right\rangle =\frac{1}{\sqrt{6}}\left(\left|{\mathrm{Ni}}_{1{\prime} }^{{d}_{xz}}\right\rangle +\left|{\mathrm{Ni}}_{3{\prime} }^{{d}_{xz}}\right\rangle +\left|{\mathrm{Ni}}_{6}^{{d}_{xz}}\right\rangle -\left|{\mathrm{Ni}}_{2{\prime} }^{{d}_{xz}}\right\rangle -\left|{\mathrm{Ni}}_{4{\prime} }^{{d}_{xz}}\right\rangle -\left|{\mathrm{Ni}}_{5{\prime} }^{{d}_{xz}}\right\rangle \right),$$
(2)
which is a linear combination of six dxz orbitals of the i = 1 to 6 Ni atoms in a local basis, as described in ref. 29. This is enumerated in Fig. 3a. The primes indicate that the orbital is not in the primitive unit cell. This description captures most of the flat-band weight (Supplementary Section 7). The description of localized orbitals disentangles the contribution of the flat band from the other light bands of the band structure.
With a proper description of the flat band, we calculated the spectra at different points of interest within the unit cell. At the centre of the smaller Ni triangles, where the wavefunction of the flat band is predicted to be localized by DFT, we found no spectral weight contributed to by the flat band, as seen by the spectra in Fig. 3c. The absence of the spectral weight is due to destructive quantum interference between the tunnelling matrix and the flat-band CMO, which has a distinct angular momentum. In stark contrast, at the Ni sites, we recovered the \(\left|{d}_{xz},{0}_{-}\right\rangle\) contribution of the flat band, as shown in Fig. 3d. Thus, this methodology resolves the unusual charge distribution that we found at low biases, tracing it to the destructive interference that forms the kagome flat band.
Molecular orbitals also resolve the discrepancy between the experimentally obtained flat-band peak width Wflat ≈ 30 meV and the thrice broader DFT value (Supplementary Sections 7 and 8). As the flat band in Ni3In is partially filled, we added a single-site Hubbard interaction U to our molecular orbital \(\left|{d}_{xz},{0}_{-}\right\rangle\) (ref. 29). The interaction renormalizes the flat band, which gets narrower when the quasiparticle weight Zd decreases as U increases, as shown in Supplementary Section 7. The decrease in the area under the flat-band peak in the measured STM spectrum compared with the DFT result is directly related to the modification of the tunnelling amplitude. Tunnelling occurs between the tip and just a fraction of the bare electrons, resulting in quasiparticles. Therefore, only the coherent quasiparticles contribute to the peak, and the remaining electronic contribution spreads out in the featureless spectral background.
Our spectroscopic measurements unveil that the molecular orbital resembles the f atomic orbital in heavy-fermion systems, with CMO-selective correlations capturing the dominating interaction physics. Having established the contribution of the local moments to the formation of the low-bias peak, we addressed the origin of the zero-bias dip in the dI/dV spectrum (Fig. 1g). Coupling tDOS with the Dirac light bands in our model reproduces the peak–dip structure (Fig. 3e,f and Supplementary Section 7). In heavy-fermion systems, the co-tunnelling Fano line shape can be either symmetric or asymmetric depending on the tunnelling rates to the heavy- or light-band states36,37,38. However, for molecular orbitals, the line shape obtained is deeply connected to the different nature of the local moments. Here the same destructive quantum interference plays an important role, and we did not obtain strongly asymmetric line shapes. As a result, at the flat-band site, we obtained a line shape similar to the Si-terminated surface of the canonical heavy fermion YbRh2Si2 (refs. 11,12).
Visualizing the interaction between the light and flat bands
After establishing the intriguing properties of the flat band and its many-body renormalization in Ni3In, we examined the role of the light Dirac band and the mutual interaction among the two. For this, we measured quasiparticle interference (QPI) patterns embedded in the local DOS by elastic scattering of the electrons43,44, as shown in Fig. 4. We imaged ripples in the spectroscopic imaging maps in Fig. 4a–c around adatoms that were traced by the topography (Fig. 1e). The Fourier transforms of the respective maps show a clear circular pattern, with a slight enhancement along the Γ–M direction compared with Γ–K. By inspecting the cuts along the two high-symmetry directions, presented in Fig. 4d, we found two different scattering processes, q1 and q2, at high and low momentum transfers, respectively.
Fig. 4: QPI of the Dirac light bands and their interaction with the flat band.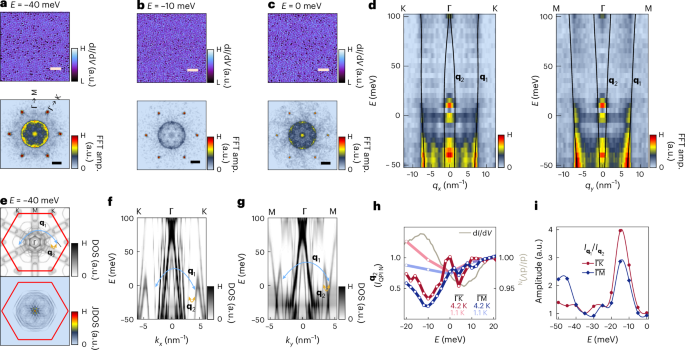
a–c, Top: spectroscopic dI/dV maps for E = −40 meV (a), −10 meV (b) and 0 meV (c). Bottom: the respective Fourier transforms (Vbias = 100 mV and Isp = 400 pA; scale bars, 5 nm). These were obtained from the same area of Fig. 1e. d, Energy-dependent line cuts of the Fourier transform along the high-symmetry momentum directions Γ–K (left) and Γ–M (right). The scattering processes are denoted by q1 and q2. The solid black lines represent the identified scattering modes in the calculated JDOS. e, Constant-energy slab DOS and its respective JDOS at E = −40 meV (top and bottom panels, respectively). To obtain the JDOS, we considered only the Dirac bands marked by scattering arrows q1 and q2. f,g, Slab electronic structure along the same high-symmetry directions: Γ–K (f) and Γ–M (g). h, Energy-dependent intensity of the scattering process q2 along the Γ–K and Γ–M directions for T = 1.1 K and 4.2 K (Vbias = −20 mV and Isp = 200 pA). The grey line (right-hand y axis) denotes the dI/dV spectrum at a Ni site. i, The ratio between the intensities of q1 and q2 at T = 4.2 K as a function of energy along the Γ–K and Γ–M directions.
We next compare the measured QPI modes with the band structure in our surface-projected slab calculations. The circular-like scattering indicates that ring-like pockets, such as the Dirac nodal ring in Fig. 1b, played an important role. Additionally, the relatively weak energy dependence of the modes, as well as their termination at finite momentum transfer (Supplementary Section 9), indicates that the modes originated from interband scattering. Although for the low-q mode other candidates are viable, the best-matching scattering wavevectors among the two Dirac bands are marked by arrows in the momentum K-dependent constant-energy η(K) in the top panel of Fig. 4e (Supplementary Section 10). They generated a circular pattern in the calculated joint density of states (JDOS), shown in the bottom panel, which resembles the measured pattern, including the intensity modulation between the Γ–K and Γ–M directions. We enhanced the visibility of the q2 signal by subtracting the disorder structure factor (Supplementary Section 10). The dispersion of the Dirac bands along the two momentum cuts is displayed in Fig. 4f,g, respectively. The interband scattering between those two Dirac nodal rings describes well the dispersive q1 and q2 (black lines in Fig. 4d), although backward scattering could describe q2 almost as well (Supplementary Section 10). Although intermediate scattering can also be identified along Γ–K, we now focus our comparison to between q1 and q2, as these are two direct points of comparison for distinct directions and are the two most extreme scattering processes (Extended Data Fig. 5). The absence of an intraband scattering process could be due to the helical nature of the light bands, which exclude backscattering45 from non-magnetic scatterers46,47 (Supplementary Section 11).
We did not find any direct signatures of the flat band in the QPI, presumably because it does not host well-defined scattering hot spots. Notably, though, the intensity of both the q1 and q2 modes at T = 4.2 K is non-monotonic, with strong suppression right at the energy of the −12 meV peak in dI/dV that we have associated with the kagome flat band. This non-monotonic behaviour signifies enhanced electronic interactions between the light and flat bands in Ni3In (ref. 48). The suppression of the QPI is highlighted in Fig. 4h, where we compare the intensity of q2 along Γ–K and Γ–M at T = 4.2 K and 1.1 K with the spectrum taken at a Ni site (solid line) (Supplementary Section 12). Notably, within the hFL phase (T = 1.1 K), the suppression is absent, with its q2 intensity following the average spectrum (Supplementary Section 12).
The absence of QPI suppression in the hFL regime rules out its origin being due to the presence of a hybridization (or spin–orbit-induced) gap between the kagome flat band and the dispersive Dirac bands, which are commonly imaged in heavy-fermion systems38,49,50. This suppression seems to be isotropic in the momentum space, ruling out an origin due to magnetic and nematic fluctuations51,52,53,54. On the other hand, quantum critical charge fluctuations result in the loss of quasiparticles everywhere on the Fermi surface7,19,55,56. In other words, the loss of phase coherence due to the collapse of the quasiparticle stability within the strange-metal phase will affect the QPI intensity7,19,55,56 (Supplementary Section 12). Note that the suppression of q2 is stronger than for q1 at T = 4.2 K (Fig. 4i), again consistent with the suppression being directly linked to an electronic localization–delocalization instability (Supplementary Section 13).
Discussion and conclusion
Our uncovering of the emergent localized states as a proper description of the flat band in kagome systems is possible only due to their being localized in a relatively compact region but extended from the perspective of atomic sites. As such, spectroscopic imaging provides the smoking gun used to identify these building blocks and, subsequently, the electronic correlations in this kagome lattice. As a consequence of imaging the molecular orbitals, the peak in the dI/dV spectra can be directly linked to the presence of the flat band in Ni3In. As mentioned before, the suppression of the QPI at these energies arises from the loss of coherence of the quasiparticles in the system, which is in agreement with the strange-metal behaviour. We estimated the width of the flat band Wflat ≈ 30 meV from both measurements. This bandwidth is at least one order of magnitude smaller than the flat bands observed previously in other kagome lattices23,57,58. Previous dynamical mean field theory calculations estimated that the Coulomb interaction U ≈ 3–7 eV in Ni3In (ref. 59), which would give us the ratio U/W ≈ 100–230, comparable with other prototypical correlated materials13. Moreover, Wflat ≪ U < Wwide, where Wwide is the width of the light bands, in the regime of the CMO acting as 4f orbitals, so that it mimics a Doniach phase diagram18,19,20,29. Naturally, due to the out-of-plane dispersion of the flat band, the average U/W extracted from macroscopic measurements, such as specific heat, will be much smaller14,27. Our experiment thus unmasks the essential microscopic building blocks of the kagome metal. These encode the complexity of the material and enable the effective interactions that create the amplified quantum fluctuations; the latter give rise to properties in this material that are in common with such correlated systems as heavy-fermion metals. As such, our work visualizes the kagome origin of the NFL strange-metal phase of Ni3In and, more generally, forges an avenue towards understanding how diverse materials platforms yield universal singular low-energy physics in the regime of amplified quantum fluctuations.
Finally, we could directly access a new mechanism in quantum materials to obtain local moments and their hybridization with conduction electrons. Owing to the intrinsic topological nature of flat bands in kagome lattices (and moiré-based materials), one remaining question is whether other exotic phases, such as superconductivity, can emerge around the quantum critical point and whether these would be unconventional due to the magnetic fluctuations and the topological origin. Our work establishes microscopic evidence of this realization, opening a new route in searching for topological superconductivity with non-abelian excitations60 and potentially other exotic electronic phases.