March was a lousy beginning of spring selling season. But mortgage rates ticked up only modestly.
By Wolf Richter for WOLF STREET.
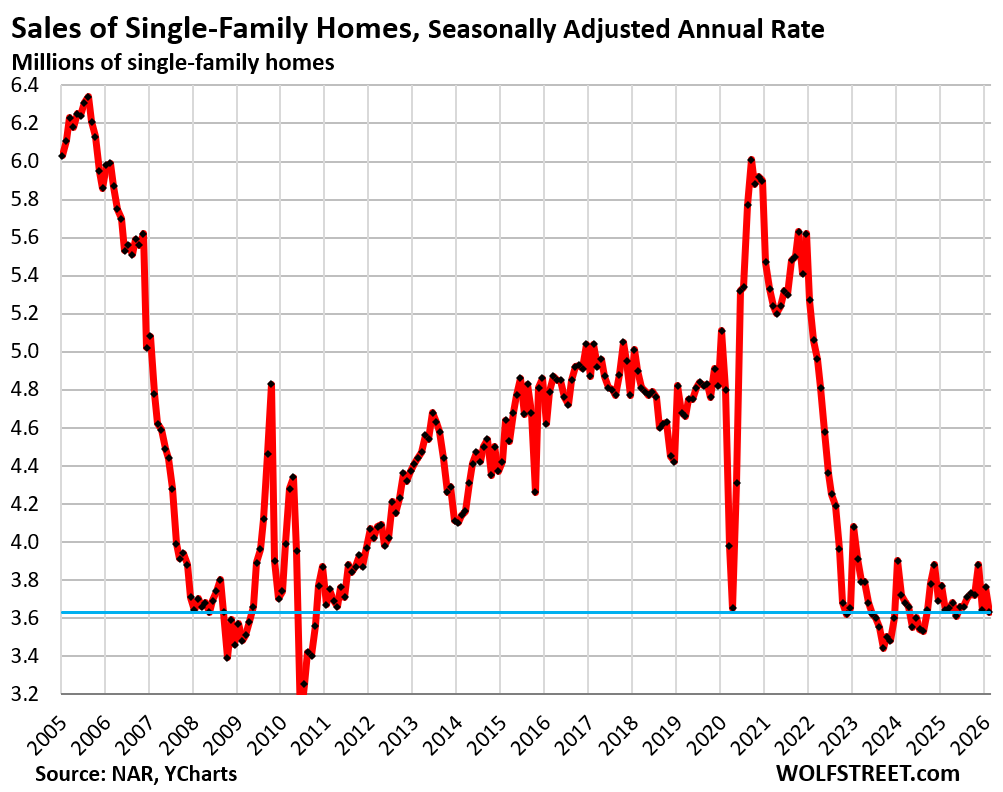
Sales of existing single-family homes that closed in March fell seasonally adjusted by 3.5% from February, to an annual rate of 3.63 million sales, the lowest since June 2025, and before then since September 2024, according to data by the National Association of Realtors today. It was four years ago, in March 2022 as mortgage rates began rising from suppressed levels, that home sales began to plunge and a few months later ended up in the deepfreeze, where they’re still today.
Compared to March in (historical data from YCharts):
2025: -0.3% (year-over-year)
2024: -2.4%
2023: -7.2%
2022: -28.3%
2021: -31.9%
2019: -22.4%
2015: -21.8%
1996: -4.7%
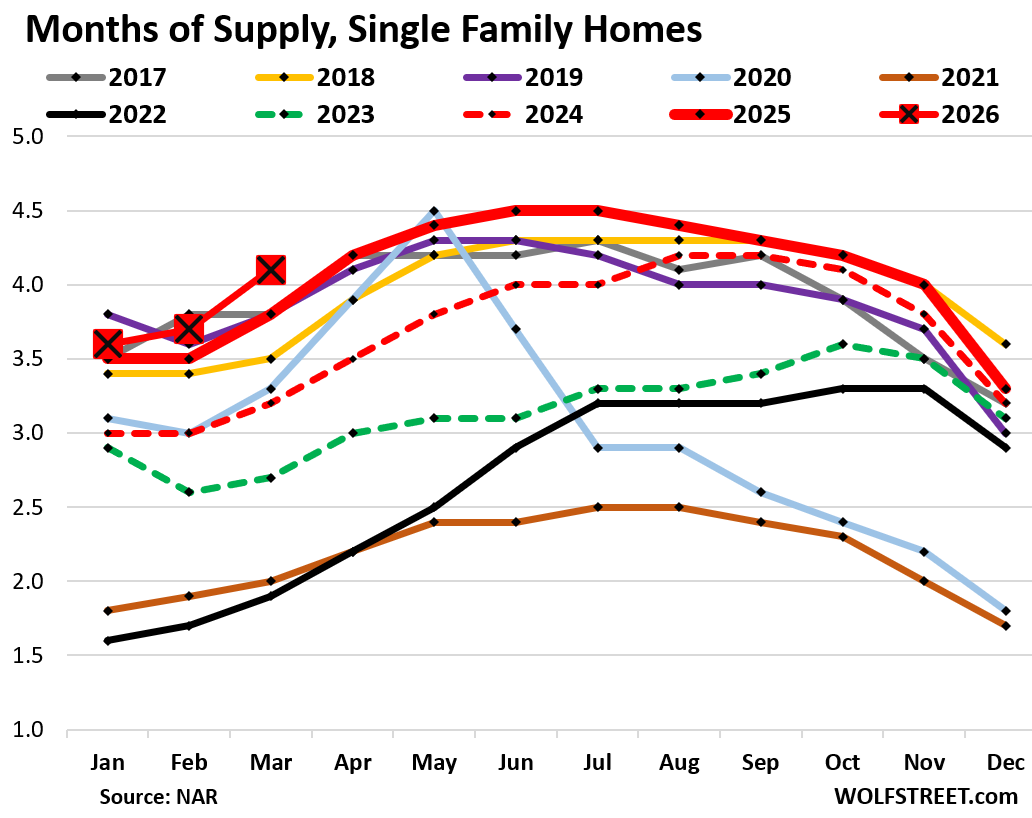
Supply of single-family homes jumped to 4.1 months in March (red line with big red squares in the chart below), the highest supply for March since 2015.
Supply is a function of sales (demand) and inventory. Inventory in a vacuum doesn’t matter that much; what matters is how much inventory there is in relationship to sales, and sales have plunged, which drives up the ratio of months’ supply.
Supply in 2025 had marked the high end for supply in the time range going back through 2016. And in 2026 so far, supply is even higher (historical data from YCharts).
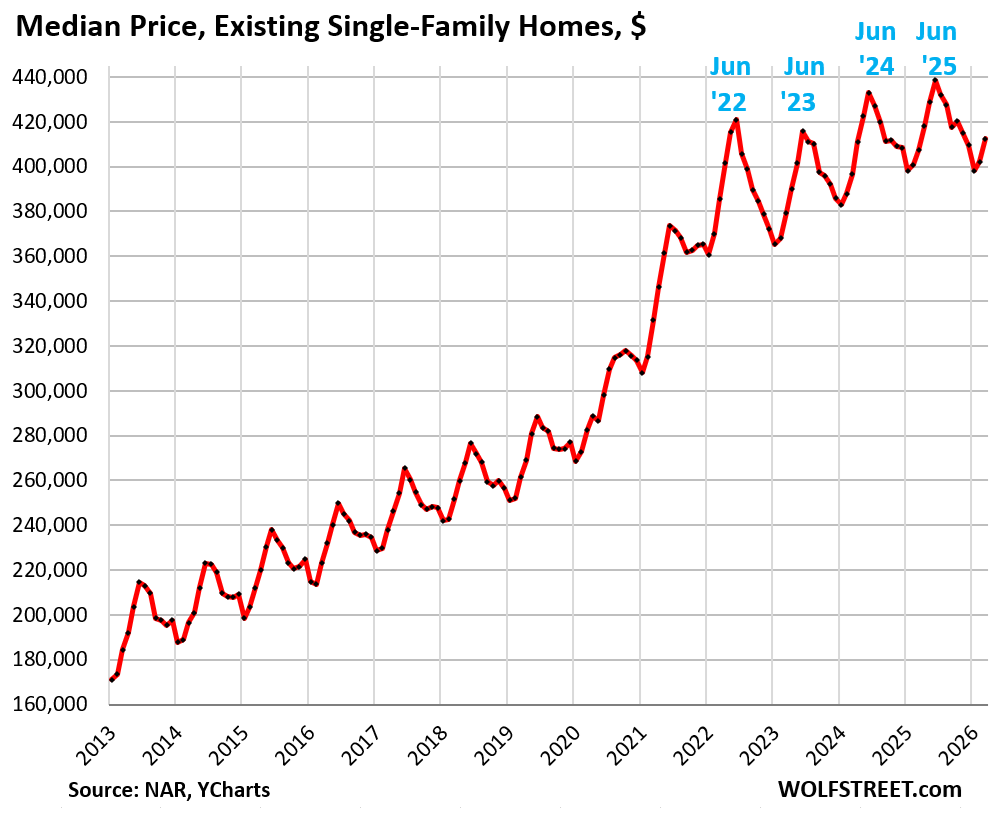
The national median price of single-family homes inched up year-over-year by 1.2% not seasonally adjusted.
The median price had exploded by 41% from June 2020 through June 2022, from already high prices. Those too-high prices (the core of the “affordability issues”) are one reason home sales have been in the deepfreeze since then.
The national median price is irrelevant for local markets. Since mid-2022, prices have dropped in some cities (for example by -25% in Austin and Oakland) and have continued to rise in others (for example year-over-year in Chicago by +2.5% and in New York City by +4.0%). For more, see my city-by-city analysis of home prices in 33 big cities.
The median price is very seasonal, rising and falling with the shift in inventories and sales, as a larger portion of expensive homes comes on the market and sells in the spring, thereby changing the mix of what sold, and shifting the median price up through June. In the second half of the year, the mix reverts, and the median price drops and bottoms out in January.
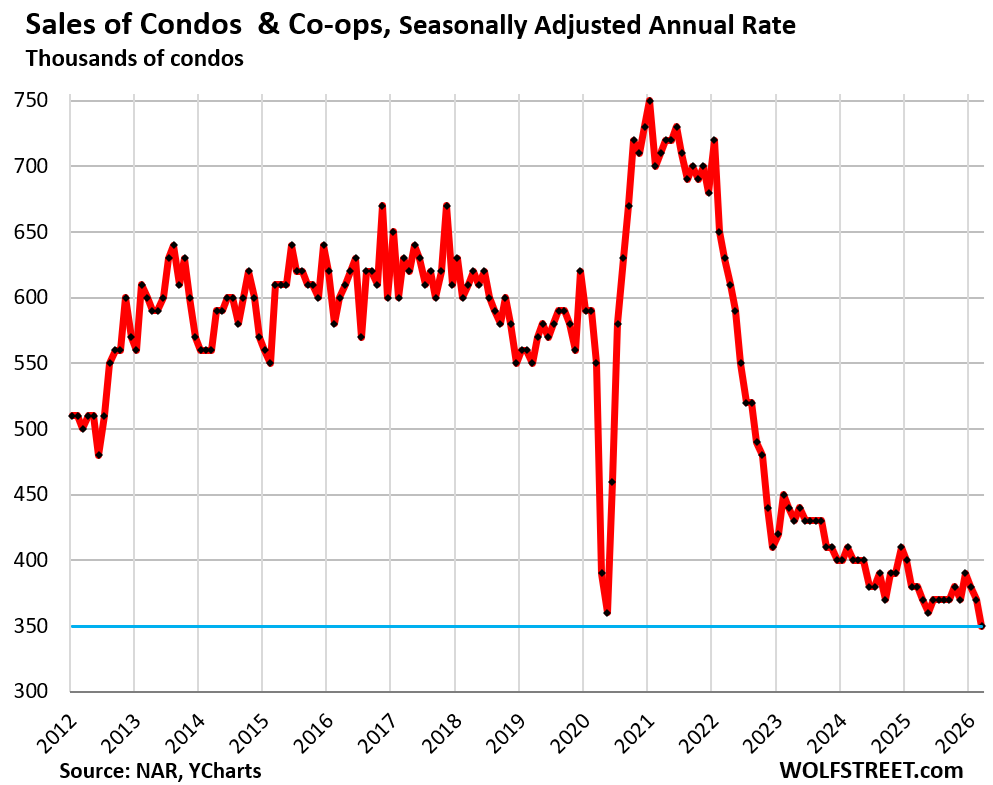
Sales of condos and co-ops plunged seasonally adjusted by 5.4% in March from February to an annual rate of 350,000, the lowest in NAR’s data on condos and co-ops, which go back only to late 2011; March 2012 was the first March in the data; note the 30% plunge since then:
Compared to March in:
2025: -7.9% (year-over-year)
2021: -50.7%
2019: -36.4%
2012: -30.0%
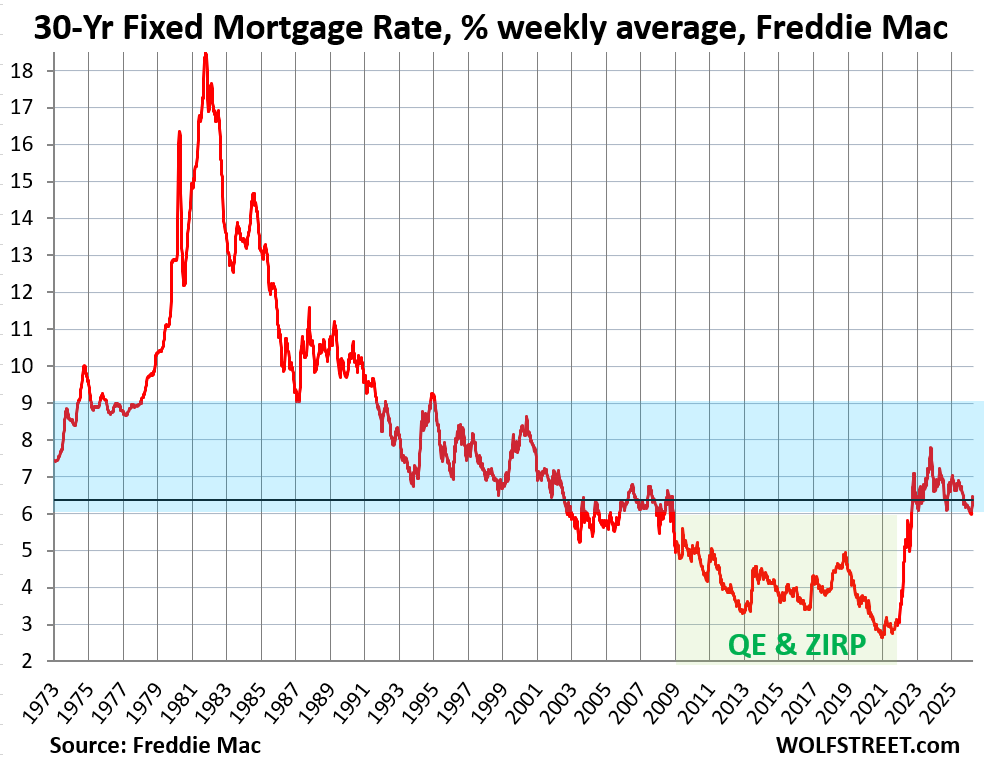
Mortgage rates ticked back up into the 6%-plus range in March, after dipping barely below 6% for just one week in late February.
The average 30-year fixed mortgage rate rose to 6.46% at the end of March, from 5.98% at the end of February, according to Freddie Mac’s weekly measure of mortgage rates. In the latest week, the average rate dipped to 6.37%. These moves are modest and are barely visible on a long-term chart.
Mortgage rates roughly track the movements of the 10-year Treasury yield, but are higher, and the spread between them varies. The 10-year Treasury yield moved back into the 4%-plus range, on accelerating inflation, which had already been accelerating for several months through February, before the war in Iran; and it is now leaping on the spike in energy prices.
These current mortgage rates are historically at the low end of the range in the decades before the era of the Fed’s QE – when the Fed bought trillions of dollars of mortgage-backed securities and Treasury securities with the purpose of pushing down mortgage rates deeply below the rate of inflation, which had caused home prices to explode, triggered the affordability problem, and helped trigger the worst inflation in 40 years.
Sales by region.
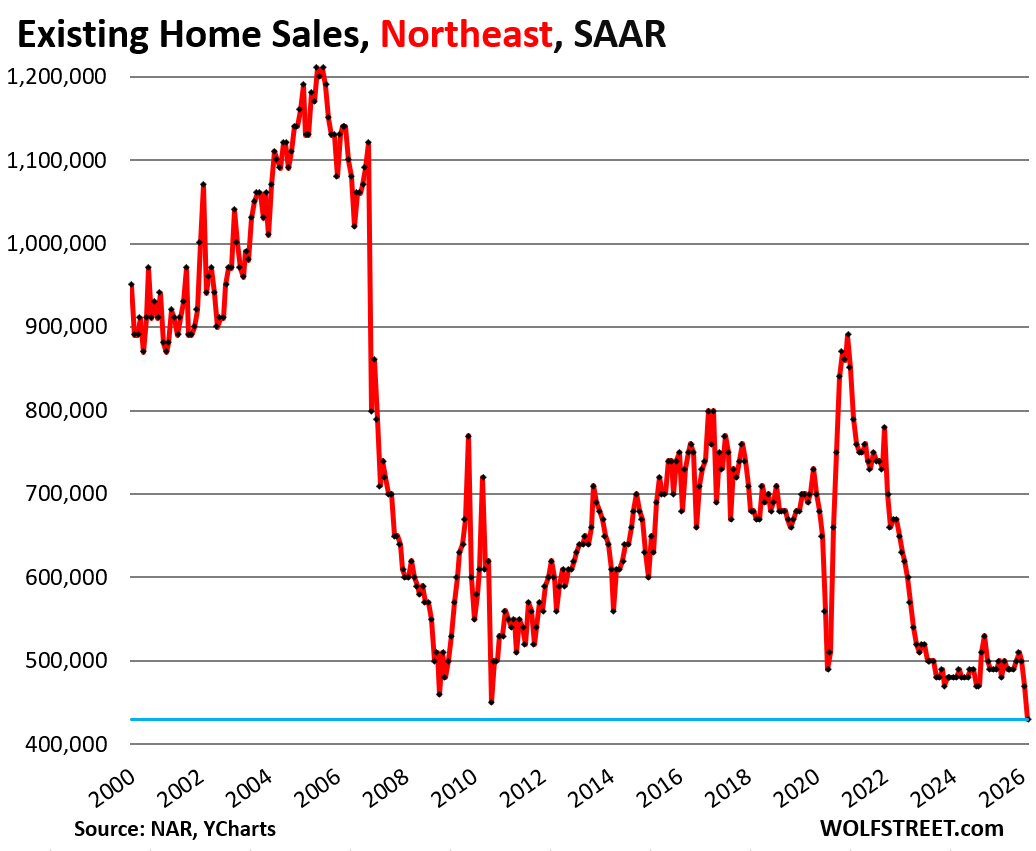
Home sales dropped in all regions in March from February, seasonally adjusted, but plunged the most in the Northeast.
The charts below show the seasonally adjusted annual rate of sales (SAAR) in the four Census Regions of the US. A map of the four regions is below the article at the top of the comments.
In the Northeast, the seasonally adjusted annual rate of sales plunged by 8.5% in March from February, after having already plunged by 6.0% in February from January, to 430,000 homes, the record low in NAR’s data, which goes back to 1999.
Compared to March in:
2025: -12.2% (year-over-year)
2024: -12.2%
2023: -17.3%
2022: -34.8%
2019: -35.8%
2018: -36.8%
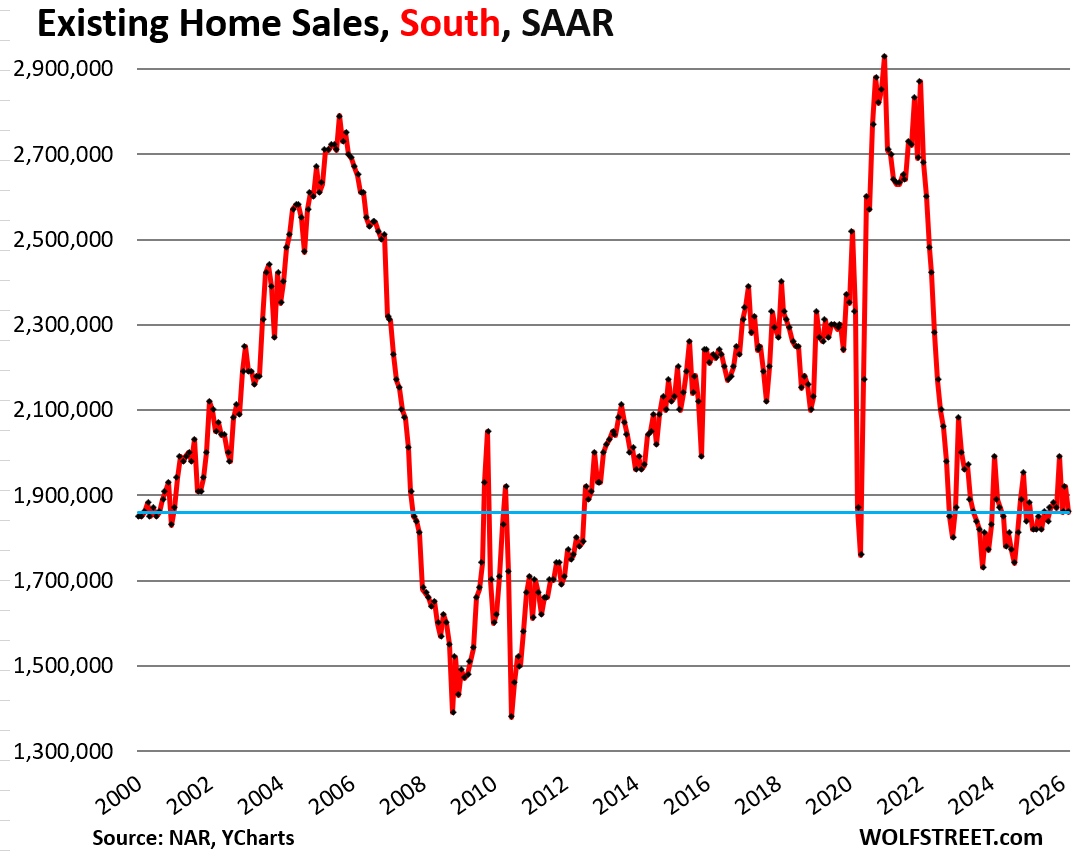
In the South, the seasonally adjusted annual rate of sales fell by 3.1% in March from February, to 1.86 million homes.
Compared to March in:
2025: +2.2% (year-over-year)
2024: -1.6%
2023: -7.0%
2022: -28.5%
2019: -18.1%
2018: -20.2%
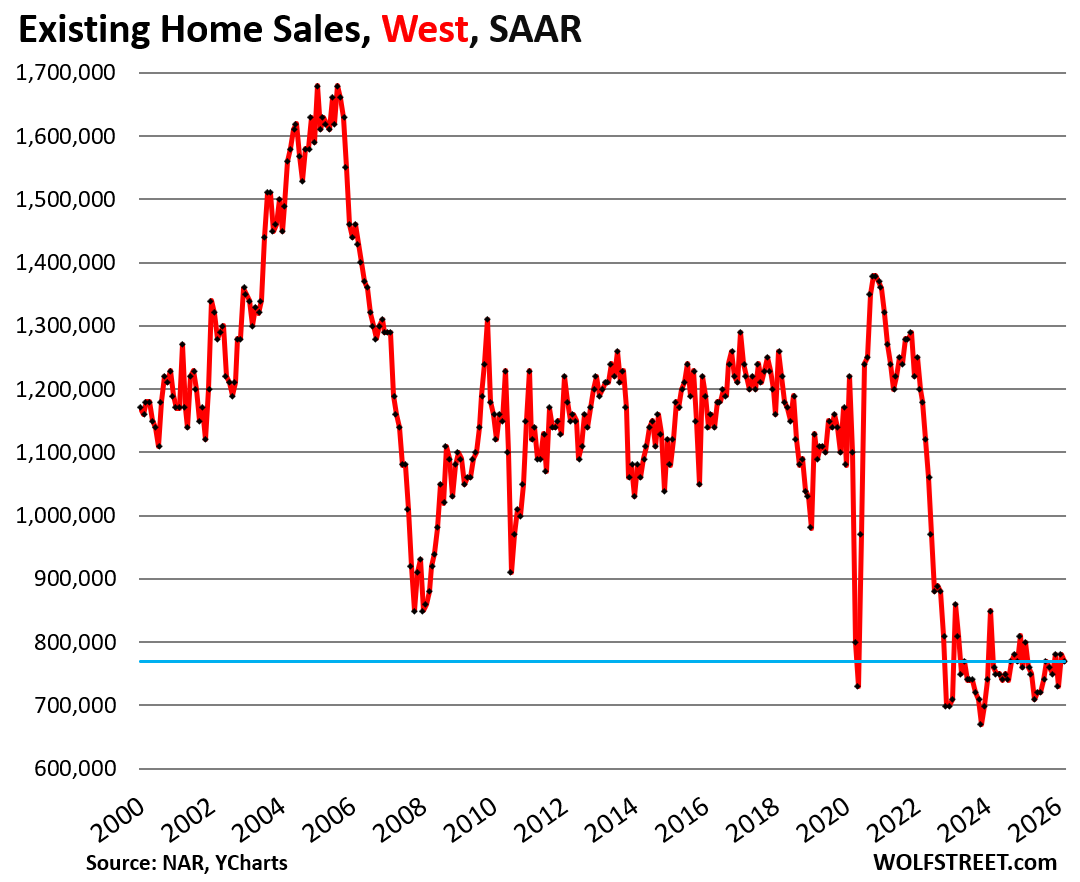
In the West, the seasonally adjusted annual rate of sales fell by 1.3% in March from February, to 770,000 homes.
Compared to March in:
2025: +1.3% (year-over-year)
2024: +1.3%
2023: -4.9%
2022: -34.7%
2019: -29.4%
2018: -36.9%
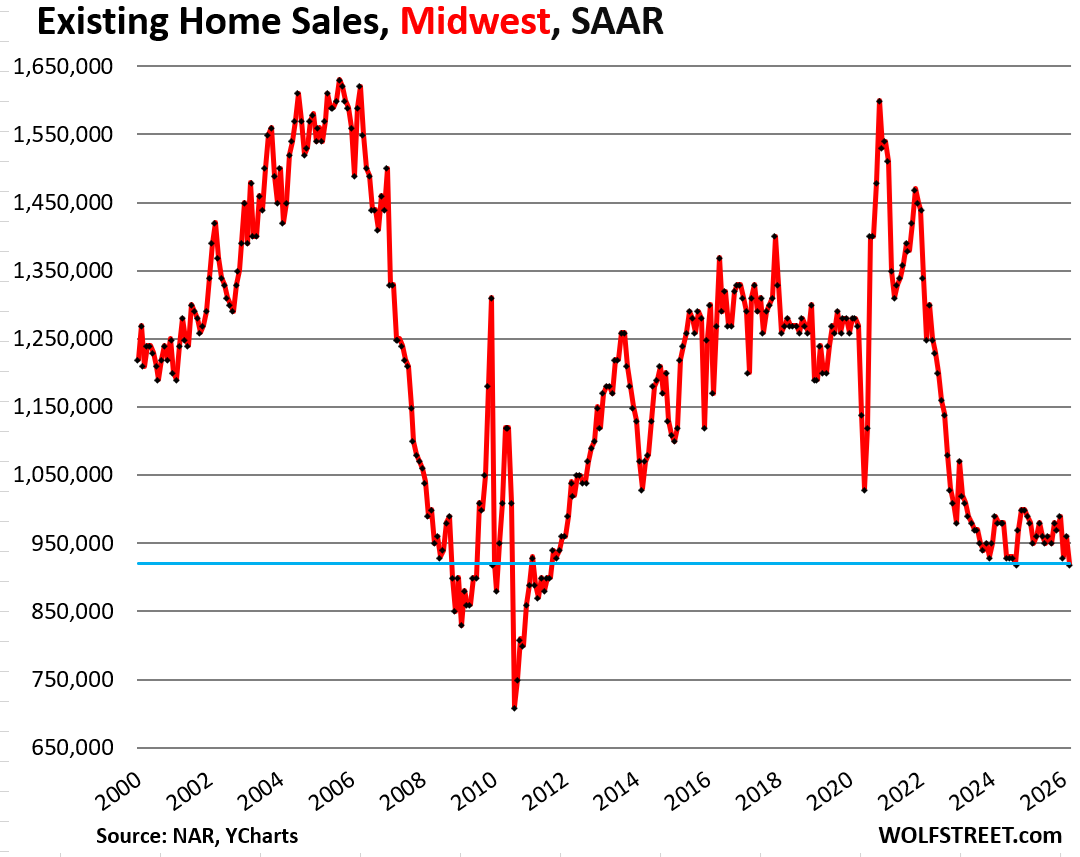
In the Midwest, the seasonally adjusted annual rate of sales fell by 4.2% in March from February, to 920,000 homes.
Compared to February in:
2025: -3.2% (year-over-year)
2024: -6.1%
2023: -9.8%
2022: -26.4%
2019: -25.8%
2018: -27.6%
In case you missed it: Update on the “Lock-in Effect” in the Housing Market: Below-3% & 4% Mortgages Fade Very Slowly
Enjoy reading WOLF STREET and want to support it? You can donate. I appreciate it immensely. Click on the mug to find out how: