

If you are wondering whether Bank of Montreal stock is still priced sensibly after a strong run, you are not alone in questioning what you are really paying for today. At a last close of C$225.53, the stock has posted returns of 10.5% over 30 days, 24.2% year to date and 58.0% over the past year, with a 3 year return of 119.5% and 5 year return of 119.6%. Recent headlines around Bank of Montreal have focused on broader sector conditions and investor sentiment. This helps frame why the stock’s performance has been in the spotlight. This context matters because shifts in confidence toward banks can quickly influence how much investors are willing to pay for each dollar of earnings or book value. Even after these returns, Bank of Montreal records a valuation score of 1 out of 6. The next sections will compare different valuation approaches to see how that stacks up and then finish with a way of thinking about value that goes beyond any single model.
Bank of Montreal scores just 1/6 on our valuation checks. See what other red flags we found in the full valuation breakdown.
Approach 1: Bank of Montreal Excess Returns Analysis
The Excess Returns model looks at how much profit a bank is expected to earn above the return investors require on its equity, then converts those surplus returns into an intrinsic value per share.
For Bank of Montreal, the starting point is its book value of CA$119.96 per share and a stable book value estimate of CA$120.09 per share, based on weighted future book value estimates from 8 analysts. On this equity base, analysts expect a stable EPS of CA$15.76 per share, sourced from weighted future return on equity estimates from 11 analysts. That implies an average return on equity of 13.12%.
Investors are assumed to require a cost of equity of CA$9.49 per share, so the model estimates excess return of CA$6.27 per share. Aggregating these future excess returns produces an intrinsic value estimate of about CA$247.16 per share.
Compared with a recent share price of CA$225.53, this Excess Returns valuation suggests the stock is trading at an intrinsic discount of roughly 8.8%, which is a modest gap rather than a deep one.
Result: ABOUT RIGHT
Bank of Montreal is fairly valued according to our Excess Returns, but this can change at a moment’s notice. Track the value in your watchlist or portfolio and be alerted on when to act.
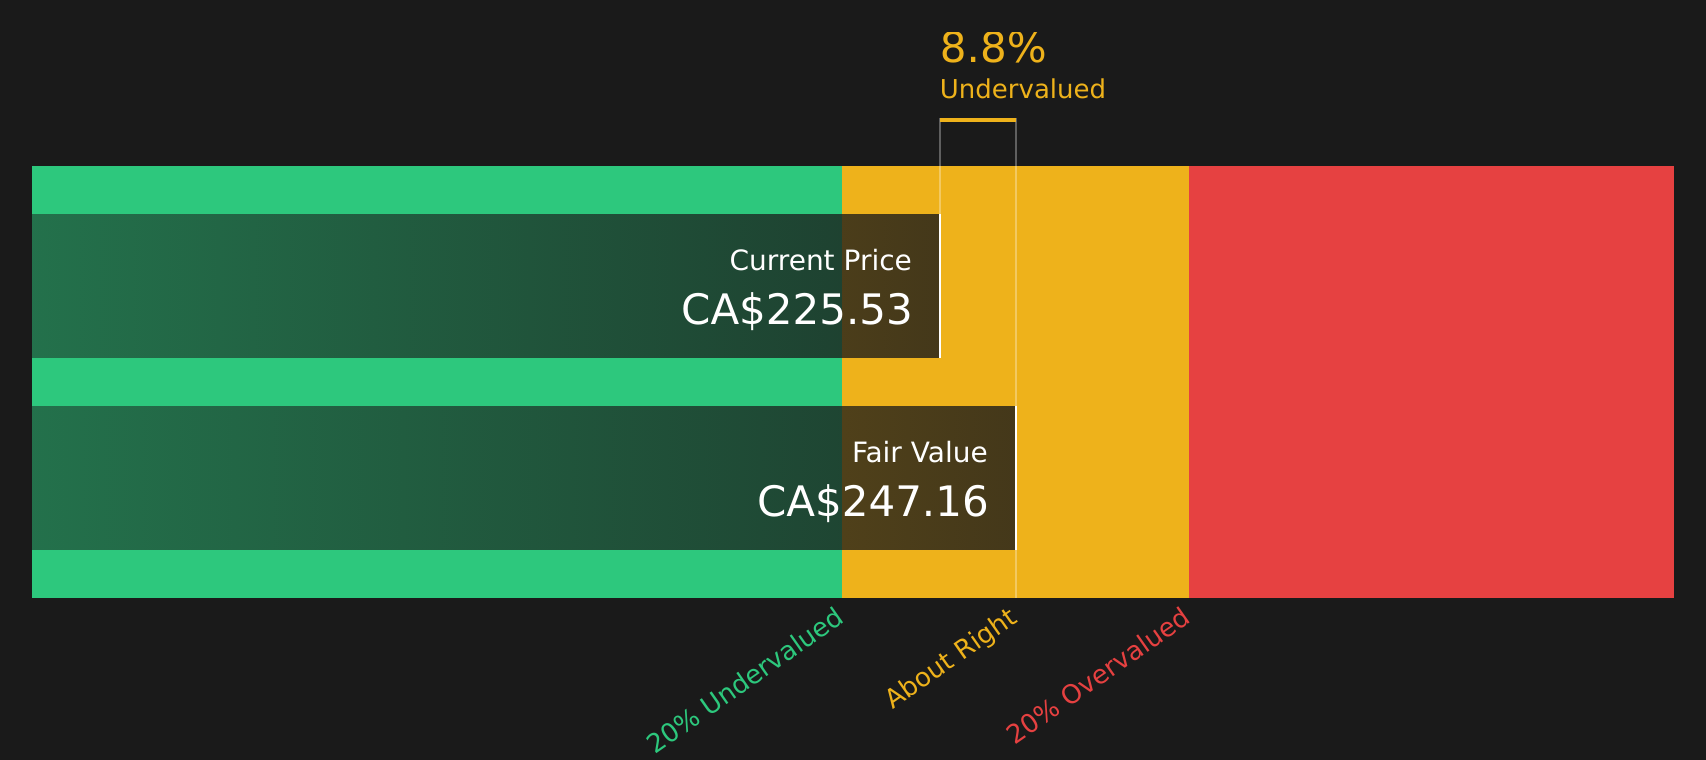 BMO Discounted Cash Flow as at Jun 2026
Approach 2: Bank of Montreal Price vs Earnings
For a profitable bank, the P/E ratio is a practical way to think about value because it links what you pay for each share to the earnings that support that share. The level of P/E investors are willing to pay usually reflects what they expect for future earnings and how much risk they see in those earnings.
Bank of Montreal currently trades on a P/E of 17.02x. That is above the broader Banks industry average of 10.95x and also above a peer group average of 16.24x, so the stock sits at a premium on this simple comparison.
Simply Wall St’s Fair Ratio for Bank of Montreal, which is 16.44x, is a proprietary estimate of what a more tailored P/E might look like after considering factors such as earnings growth, profit margins, risk profile, market cap and its position within the Banks industry. This tends to be more informative than a straight peer or industry comparison, which treats all companies as if they carry the same prospects and risks.
Compared with the current P/E of 17.02x, the Fair Ratio of 16.44x points to the stock being slightly above that tailored level. However, the gap is small enough to suggest pricing is broadly in line with those fundamentals.
Result: ABOUT RIGHT
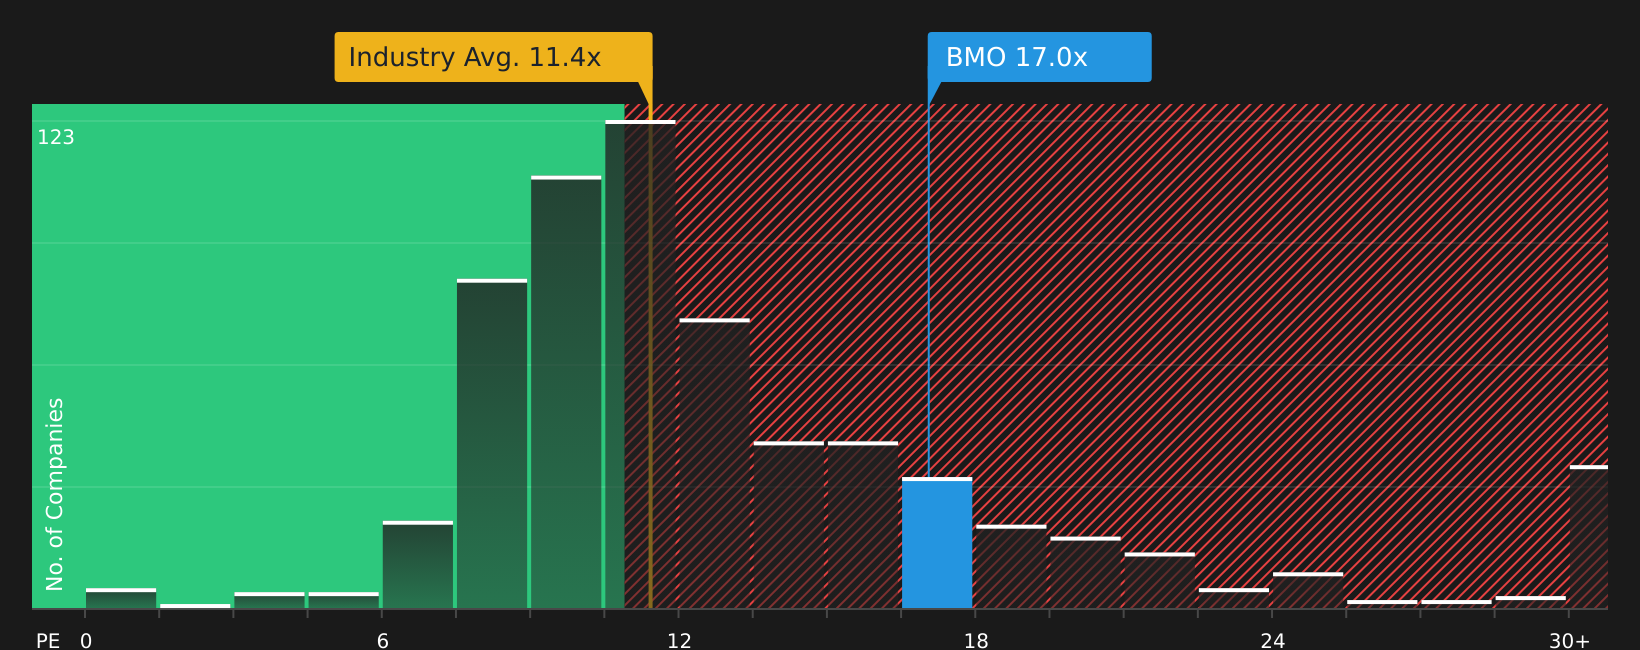 TSX:BMO P/E Ratio as at Jun 2026
P/E ratios tell one story, but what if the real opportunity lies elsewhere? Start investing in legacies, not executives. Discover our 3 top founder-led companies.
Upgrade Your Decision Making: Choose your Bank of Montreal Narrative
Earlier it was mentioned that there is an even better way to understand valuation. Narratives on Simply Wall St’s Community page let you set a story for Bank of Montreal, link that story to concrete assumptions about future revenue, earnings, margins and a fair value, then compare that fair value with the current price. All of this updates automatically when new earnings or news arrive. For example, one investor might build a bullish narrative around digital banking, AI and sustainable finance that lines up closer to the CA$234.0 analyst target. Another might focus on credit risks, expenses and U.S. loan growth uncertainty and land nearer the CA$175.0 target. This gives you a clear, price based framework for deciding whether the stock looks attractive or not under your own view.
Do you think there’s more to the story for Bank of Montreal? Head over to our Community to see what others are saying!
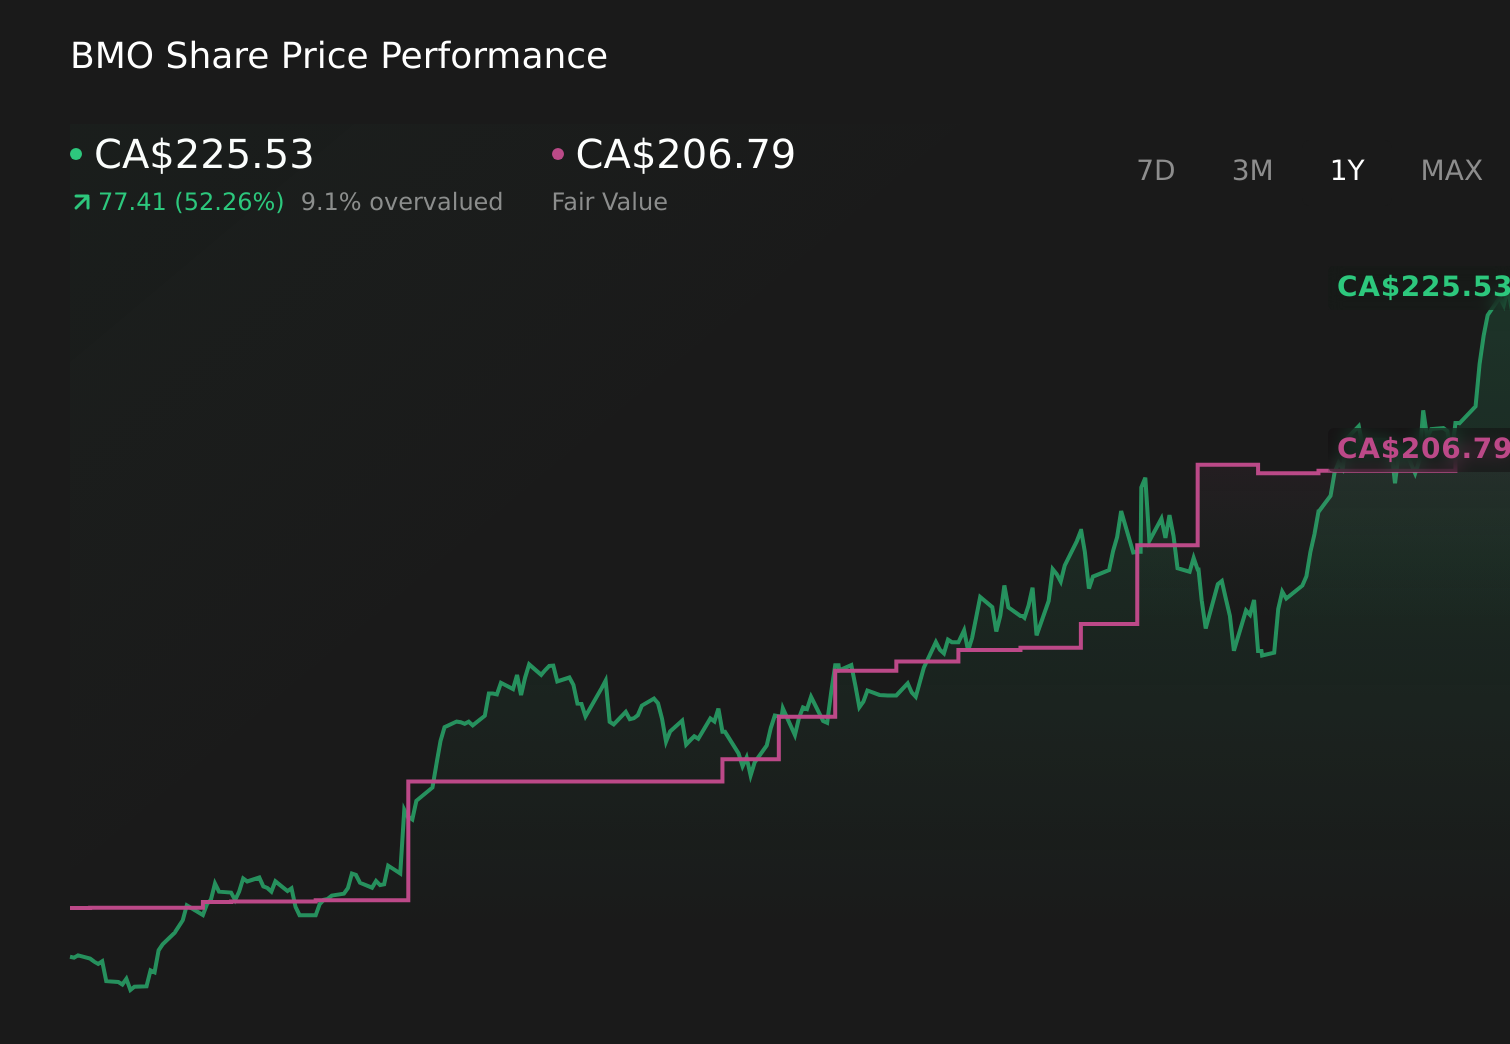 TSX:BMO 1-Year Stock Price Chart
This article by Simply Wall St is general in nature. We provide commentary based on historical data
and analyst forecasts only using an unbiased methodology and our articles are not intended to be financial advice. It does not constitute a recommendation to buy or sell any stock, and does not take account of your objectives, or your
financial situation. We aim to bring you long-term focused analysis driven by fundamental data.
Note that our analysis may not factor in the latest price-sensitive company announcements or qualitative material.
Simply Wall St has no position in any stocks mentioned.
Valuation is complex, but we’re here to simplify it.
Discover if Bank of Montreal might be undervalued or overvalued with our detailed analysis, featuring fair value estimates, potential risks, dividends, insider trades, and its financial condition.
Have feedback on this article? Concerned about the content? Get in touch with us directly. Alternatively, email editorial-team@simplywallst.com