
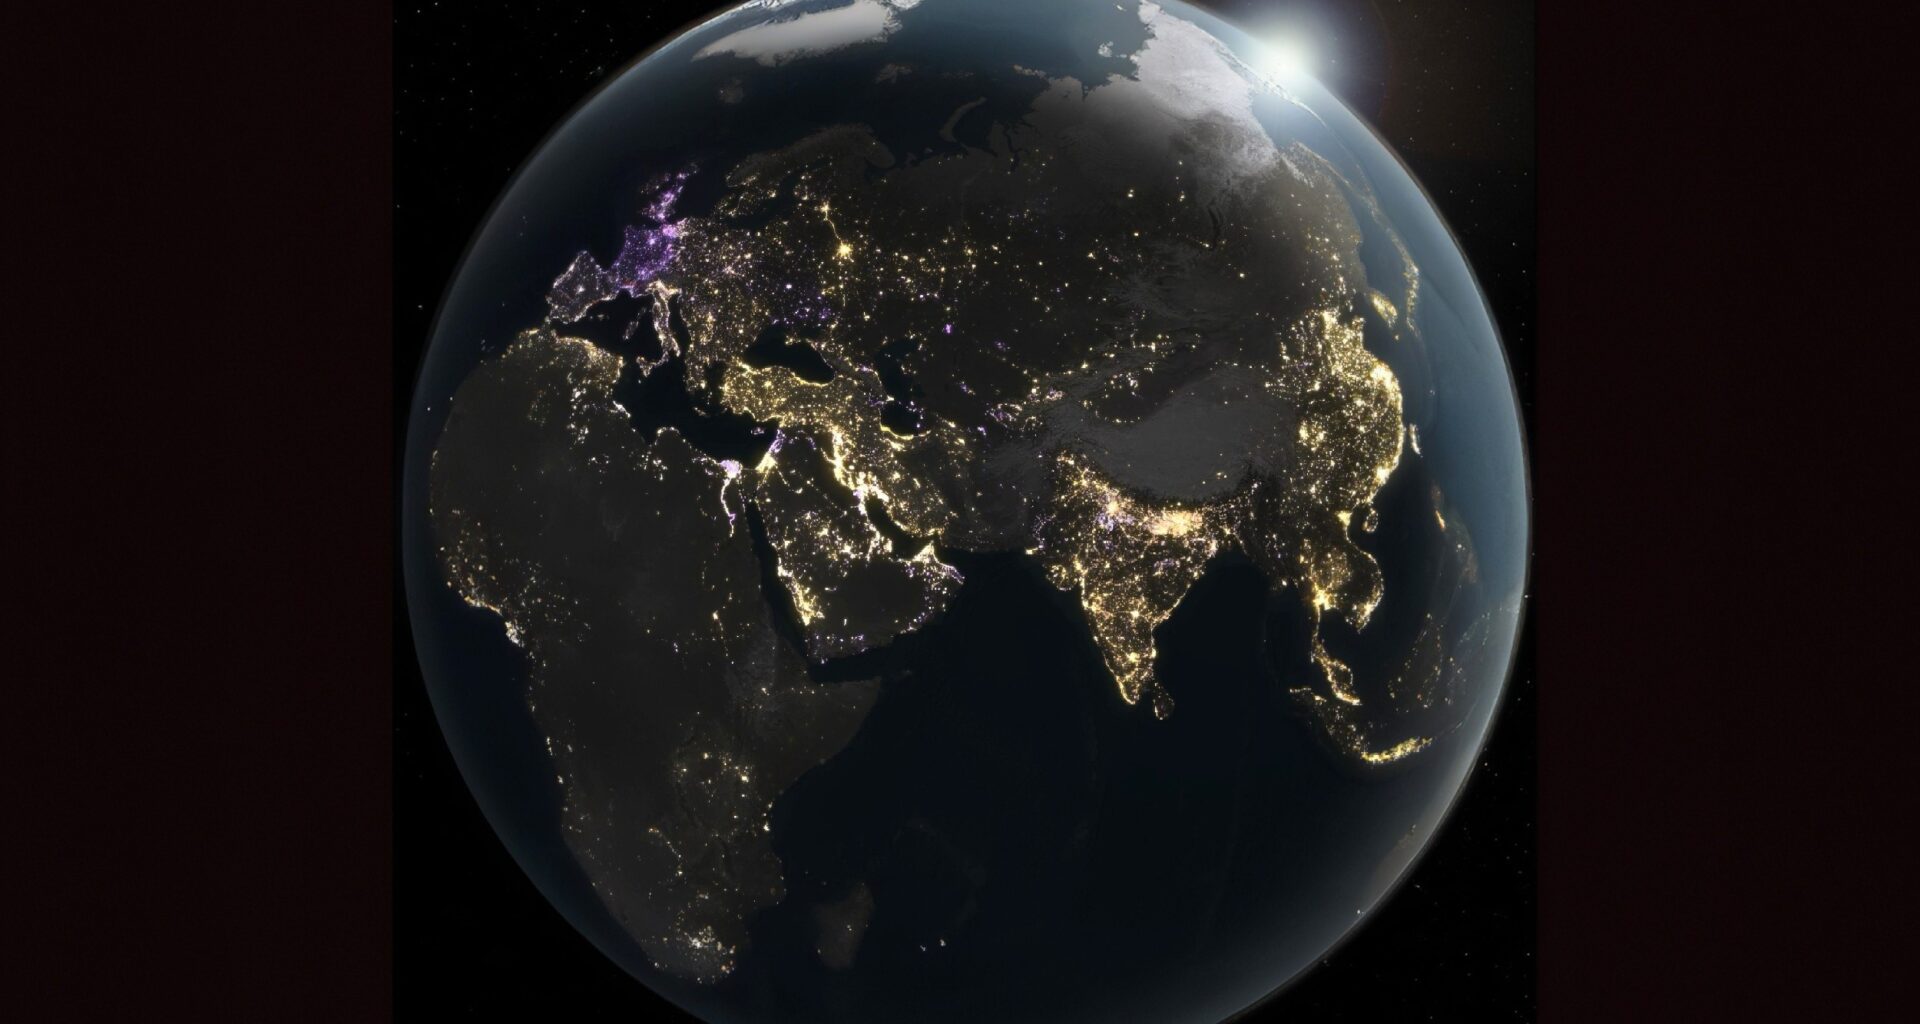
Today’s Image of the Day from NASA Earth Observatory features a planet that is changing after dark.
New maps built from satellite data show where the world has been getting brighter at night.
The maps also show where Earth has been dimming. The changes reveal shifts in economics, technology, energy use, and urban growth.
The images come from NASA’s Black Marble project, which tracks artificial light across Earth using satellites equipped to detect nighttime illumination.
What is revealed about modern life
Instead of showing a simple rise in global brightness over time, the maps reveal something far more uneven.
Some regions glow brighter year after year as cities expand and industries grow.
Others fade as governments adopt energy-saving technology or face economic hardship and power shortages.
Artificial light has become one of the clearest visible signs of human activity on Earth.
From highways and apartment towers to ports and factories, nighttime illumination can reveal where development is accelerating and where it is slowing down.
It also exposes how deeply modern life depends on electricity.
What satellites see after dark
NASA’s Black Marble project relies on observations from the VIIRS sensors aboard the Suomi-NPP, NOAA-20, and NOAA-21 satellites.
These instruments measure nighttime light in wavelengths ranging from green to near-infrared.
The system can detect city lights, reflected moonlight, auroras, and other faint nighttime signals.
Scientists then apply filtering methods to isolate artificial lighting patterns from natural sources of light.
Changes in nighttime brightness
The new analysis examined changes in nighttime brightness between 2014 and 2022 across most of the inhabited world, from 60 degrees south to 70 degrees north latitude.
On the resulting maps, yellow and gold regions indicate places where lighting increased, while purple areas show dimming.
The study was published in April 2026 in the journal Nature, and one of the visualizations appeared on the magazine’s cover.
Researchers found that global radiance increased by 34 percent during the study period. That number alone sounds straightforward, but the details tell a much more complicated story.
Cities brighten while others fade
The maps show that brightening and dimming often happen side by side.
In the United States, many West Coast cities became brighter as populations grew and urban development expanded.
At the same time, large portions of the East Coast became dimmer.
Researchers linked much of that dimming to the spread of energy-efficient LED lighting and broader economic changes.
LEDs use far less electricity than older lighting systems and have rapidly replaced traditional streetlights in many cities over the past decade.
Light measurements from space
This shift has changed the appearance of cities from space. Older sodium vapor lights produced a warmer orange glow, while LEDs tend to create a whiter, sharper light.
Because satellites measure light differently depending on wavelength, some transitions to LEDs can actually appear dimmer in satellite observations even when streets remain fully lit.
That distinction matters because scientists increasingly use nighttime light data as a way to estimate economic activity, population growth, and infrastructure expansion.
Changes in lighting technology can complicate those measurements.
Rapid development and industrial growth
Some of the most dramatic increases in nighttime brightness appeared in China and northern India.
Rapid urban development, industrial growth, and expanding transportation networks contributed to large surges in artificial lighting across both countries.
Over the last two decades, many cities in those regions have expanded at extraordinary speed. New housing developments, highways, airports, and industrial zones have transformed once-dark landscapes into densely illuminated urban corridors visible from orbit.
Nighttime light data has become a valuable tool for tracking those changes because it offers a near real-time picture of development.
In some parts of the world where official economic statistics may lag behind events on the ground, satellite observations can provide clues about growth patterns and infrastructure activity.
Consequences of artifical light
The spread of artificial light also carries environmental consequences. Brighter nights affect wildlife migration, insect behavior, sleep cycles, and human health.
Researchers have linked excessive nighttime illumination to disruptions in circadian rhythms and declining populations of some nocturnal species.
While parts of Asia grew brighter, several European countries showed substantial declines in nighttime illumination.
France dimmed by 33 percent during the study period, while the United Kingdom dimmed by 22 percent and the Netherlands by 21 percent.
Researchers connected those declines to energy conservation efforts and the wider adoption of LEDs.
A crisis visible from space
But the maps also captured a sudden and more dramatic shift in 2022, when Europe faced a major energy crisis following the outbreak of the Russia-Ukraine conflict.
As energy prices surged and governments urged conservation, cities and businesses reduced lighting to save electricity.
Public monuments went dark earlier, storefronts cut back illumination, and municipalities lowered street lighting levels in some areas.
The result became visible from space almost immediately.
The new NASA maps show that artificial light is more than a sign of modern civilization. It acts as a record of human decisions, economic pressure, technological change, and political events.
Every brightening skyline and every dimming city leaves a trace visible far above Earth’s surface.
Image Credit: NASA Earth Observatory
—–
Like what you read? Subscribe to our newsletter for engaging articles, exclusive content, and the latest updates.
Check us out on EarthSnap, a free app brought to you by Eric Ralls and Earth.com.
—–