
On this page
Text begins
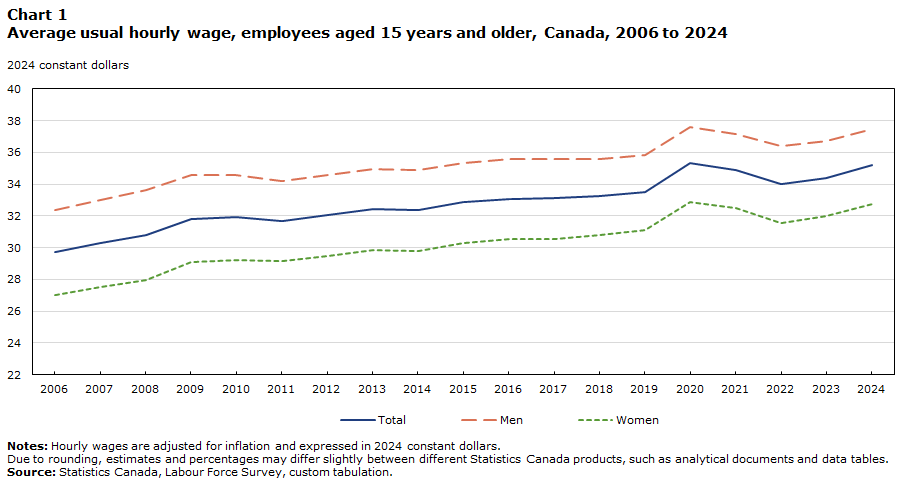
In 2024, the average hourly wage of employees aged 15 years and older was $35.20 per hour. After adjusting for inflation, the average hourly wage was up $1.69 (+5.0%) compared with its 2019 pre-pandemic level, and up $5.47 (+18.4%) compared with its 2006 level, the earliest year of available comparable data.Note Despite the increase in average earnings over the last two decades, in 2024, wages remained lower among women, younger employees, Indigenous people, and in several racialized groups.
A number of other factors affect hourly wages such as educational attainment, industry, and occupation. From the perspective of quality of employment, a higher average hourly wage may be indicative of more highly rewarded characteristics in the labour market and offers insights on the income and benefits obtained from employment.
The average earnings indicator is based on annual averages from the Labour Force Survey (LFS) for employees aged 15 years and older. Unless otherwise stated, hourly wages are adjusted for inflation and expressed in 2024 constant dollars.
Historical trends, 2006 to 2024
The average hourly wage of employees in Canada has generally followed an upward trend since the beginning of the comparable data series in 2006. During the first year of the COVID-19 pandemic in 2020, average hourly wages grew markedly, rising $1.79 (+5.3%) to $35.30 (in 2024 constant dollars). This was driven by large employment declines in lower-paid occupations, which resulted in a shift in the composition of employment. Notably, the number of employees in sales and service occupations—the broad occupational category with the lowest average wage—declined by 604,000 (-14.3%) from 2019 to 2020.
As public health restrictions eased in 2021 and 2022, the proportion of employees in lower-paid jobs recovered. In 2022, inflation also reached a 40-year high of 6.8% on an annual average basis, with notable increases recorded in the price of energy (+22.5%), transportation (+10.6%) and food (+8.9%).Note Together, the two factors contributed to pulling down the inflation-adjusted average wage by 3.7% (-$1.29 to $34.01) from 2020 to 2022.
The inflation-adjusted average hourly wage regained ground from 2022 to 2024, rising to $35.20 (+3.4%) alongside slower inflation, and year-over-year employment increases in higher-paid occupations, such as management (+253,000, +20.6%) and education, law and social, community and government services (+138,000, +6.6%).
Data table for Chart 1
Data table chart 1
Table summary
This table displays the results of Data table chart 1 Total, Men and Women, calculated using 2024 constant dollars units of measure (appearing as column headers).
Total
Men
Women
2024 constant dollars
Notes: Hourly wages are adjusted for inflation and expressed in 2024 constant dollars. Due to rounding, estimates and percentages may differ slightly between different Statistics Canada products, such as analytical documents and data tables.
Source: Statistics Canada, Labour Force Survey, custom tabulation.
2006
29.73
32.35
27.02
2007
30.29
33.00
27.52
2008
30.82
33.65
27.95
2009
31.83
34.60
29.08
2010
31.90
34.60
29.21
2011
31.67
34.17
29.14
2012
32.03
34.58
29.44
2013
32.44
34.97
29.85
2014
32.36
34.87
29.79
2015
32.87
35.35
30.31
2016
33.08
35.59
30.51
2017
33.10
35.58
30.55
2018
33.24
35.59
30.81
2019
33.51
35.86
31.09
2020
35.30
37.61
32.86
2021
34.87
37.14
32.51
2022
34.01
36.39
31.55
2023
34.39
36.70
31.98
2024
35.20
37.50
32.77
Women continue to have lower average hourly wages compared to men
The average hourly wages of women have historically been lower than that of men. However, from 2006 to 2024, average hourly wages have grown faster among women (+21.3%) than men (+15.9%). As a result, while the average wage of women aged 15 and older was 16.5% below that of men in 2006, the gap had narrowed to 12.6% in 2024.
In 2024, young women ($20.58) and men ($21.88) aged 15 to 24 both tended to have relatively low wages, and the gender wage gap among younger employees was less pronounced (5.9%). Compared with 2006, the gender wage gap in 2024 was down 3.3 percentage points in this age group.
The gender wage gap is more pronounced among women aged 55 and older, who earned 16.6% less than their male counterparts on average in 2024 ($33.15 compared with $39.73). In 2006, the gender wage gap for employees aged 55 and older was 20.7%.
Among employees in the core-age group (aged 25 to 54), women earned 12.2% ($35.33 compared with $40.22) less than men on average in 2024, down from a gap of 16.4% in 2006.
A recent snapshot
Employees with a bachelor’s degree or higher earned more on average
Higher educational attainment is typically associated with greater earnings. In 2024, employees aged 25 and older with a bachelor’s degree or a higher level of education earned $44.67 per hour on average, a figure 55.0% higher than the average wage of those with a high school diploma or less ($28.82). Employees with postsecondary education below a bachelor’s had an average hourly wage of $34.38 in 2024.
Within each level of educational attainment, women aged 25 and older earned less than their male counterparts on average. The gender pay gap was less pronounced among employees with at least a bachelor’s degree, with women earning $0.86 for every dollar earned by men—a gap of 13.9% ($41.55 and $48.26, respectively).
In comparison, for employees with a high school diploma or a lower level of education, women earned 16.9% less than men on average ($25.69 compared with $30.91) in 2024. The gender pay gap was widest among those with postsecondary education below a bachelor’s degree at 18.3% ($30.78 for women compared with $37.68 for men).
Despite having grown more quickly since the mid-2000s, average earnings in the private sector continue to be lower than in the public sector
The average hourly wage of employees has grown to a greater extent in the private sector (+22.0%) than in the public sector (+7.6%) since 2006. In 2024, however, public sector employees ($40.83) continued to earn more on average compared with those in the private sector ($33.35).
The educational attainment of employees explains part of this persistent difference. In 2024, more than half of public sector employees (52.8%) had a bachelor’s degree or a higher level of education compared to 3 in 10 (31.8%) private sector employees.
The share of occupational groups in each sector also accounts for part of the difference in average earnings. In 2024, private sector employees were more concentrated in occupations with lower average wages, with more than one quarter of them working in sales and service occupations (27.6%). In comparison, public sector employees were more likely to work in occupations such as education, law and social, community and government services (34.1%), which tend to offer higher wages.
Finally, unionization also plays a role in maintaining higher average earnings among public sector employees. In 2024, 76.6% of them were covered by a collective bargaining agreement compared to 15.0% of their private sector counterparts. In 2024, employees covered by a collective bargaining agreement earned $37.15 per hour on average, $2.80 more than those who were not covered ($34.35).
Indigenous employees had lower average earnings compared to non-Indigenous employees
Among core-aged employees in 2024, First Nations living off-reserve ($33.37), Métis living in the provinces ($35.67), and Inuit living in the provinces ($33.42) all had average hourly wages that were below that of their non-Indigenous counterparts ($37.77). In 2024, the wage gap with non-Indigenous employees was 11.6% for First Nations employees living off-reserve, 5.6% for Métis employees living in the provinces and 11.5% for Inuit employees living in the provinces.
These wage gaps partly reflected differences in educational attainment,Note as smaller shares of First Nations employees living off-reserve (19.0%) and Métis employees living in the provinces (24.2%) held a bachelor’s degree or a higher level of education compared with non-Indigenous employees (46.0%).
Among employees with a bachelor’s degree or a higher level of education, the wage gap compared to non-Indigenous employeesNote was smaller for First Nations employees living off-reserve (2.8%)Note and non-existent for their Métis counterparts living in the provinces.
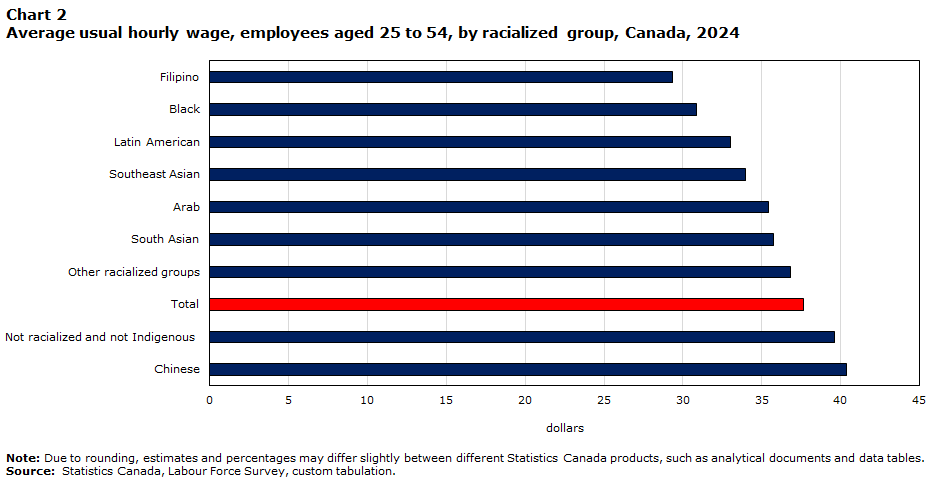
Filipino and Black employees have the lowest average hourly earnings
In most racialized groups, core-aged employees had lower average hourly wages than their non-racialized, non-Indigenous counterparts. In 2024, the largest wage gaps were recorded for Filipino (-25.9%) and Black employees (-22.2%). At the same time, the average hourly wage of Chinese employees was 1.9% higher than that of non-racialized, non-Indigenous employees.
The lower average wage of Filipino and Black employees held for different levels of education. For example, core-aged Filipino employees with a bachelor’s degree or higher earned 33.4% less than their non-racialized, non-Indigenous counterparts ($32.14 compared to $48.26) in 2024. Among Black employees with a university degree, the average wage was $34.76 per hour—28.0% lower than for non-racialized, non-Indigenous employees with the same level of education.
Chinese employees with a bachelor’s degree or higher had an average hourly wage ($44.32) that was 8.2% lower than the average wage of their non-racialized, non-Indigenous counterparts ($48.26) in 2024. This suggests that the higher overall average wage among Chinese employees was partly due to the high proportion of them who have a university degree (72.5% compared with 37.7% among non-racialized employees).
Data table for Chart 2
Data table chart 2
Table summary
The information is grouped by Racialized group (appearing as row headers), , calculated using (appearing as column headers).
Racialized group
Dollars
Note: Due to rounding, estimates and percentages may differ slightly between different Statistics Canada products, such as analytical documents and data tables.
Source: Statistics Canada, Labour Force Survey, custom tabulation.
Filipino
29.35
Black
30.84
Latin American
33.02
Southeast Asian
33.97
Arab
35.43
South Asian
35.71
Other racialized groups
36.80
Total
37.66
Not racialized and not Indigenous
39.62
Chinese
40.37
Start of text box
Information on the indicator
Description or definition
The average earnings indicator measures the usual average hourly wages of employees at their main job in 2024 constant dollars.
Source
Statistics Canada, Labour Force Survey, 2006 to 2024.
Information for interpretation
For more information on the Labour Force Survey (LFS) methodology and population coverage, please consult the Guide to the Labour Force Survey, 2025.
The LFS estimates are based on a sample and are therefore subject to sampling variability. The analysis focuses on differences between estimates that are statistically significant at the 95% confidence level. Due to rounding, estimates and percentages may differ slightly between different Statistics Canada products, such as analytical documents and data tables.
Occupations are coded according to the National Occupational Classification (NOC) 2021.
In the LFS, the concept of Indigenous group includes persons who reported being an Indigenous person, that is, First Nations, Métis or Inuk (Inuit). Excluded from the survey’s coverage are people living on reserves and other Indigenous settlements in the provinces as well as those living in the territories.
Beginning in January 1997, the LFS collects information on the usual wages or salaries of employees at their main job. Respondents are asked to report their wage/salary before taxes and other deductions, and include tips and commissions. Weekly and hourly wages are calculated on the basis of usual paid work hours per week. Average hourly wages, average weekly wages and wage distributions can then be cross-tabulated by other characteristics such as age, sex, education, occupation, and union status. In the present article, the analysis is restricted to the 18-year period of 2006 to 2024. Due to changes in the treatment of outliers applied as part of the 2023 Revisions of the Labour Force Survey (LFS), wage data prior to 2006 are no longer directly comparable with later years.
LFS data are based on sex of person up to December 2021 and gender of person from January 2022 onward. Although gender and sex at birth are two different concepts, this change does not cause a significant break in the trend because the two concepts produce very similar distributions. All data products from the LFS now adopt the term “gender” for all years and periods.
Hourly wages adjusted for inflation were calculated from nominal hourly wages, by dividing them by the Consumer Price Index (CPI) for the year, then multiplying the result by 100. For this study, CPI=100 in 2024, meaning that results are presented in 2024 constant dollars.
CPI values are from Statistics Canada Table 18-10-0005-01 Consumer Price Index, annual average, not seasonally adjusted.
Other related information
Additional Statistics Canada data are available on the following subject:
Earnings, wages and non-wage benefits
End of text box
Notes
Note
Due to changes in the treatment of outliers applied as part of the 2023 LFS revisions, wage data from 1997 to 2005 are no longer directly comparable with later years.
Note
The Daily — Consumer Price Index: Annual review, 2022
Note
The rate of attainment of a university degree for Inuit could not be reported separately due to sample size.
Note
Wages by educational attainment for Inuit could not be reported separately due to sample size.
Note
Difference only significant at the 68% confidence level.