
Water drops sliding over insulating and hydrophobic surfaces can accumulate electric charge. Consequently, the solid surfaces underneath a drop acquire opposite charges, a process referred to as slide1,2 or contact electrification, analogous to triboelectricity between solids3. It is not clear how charges are transferred, given that bringing a unit charge from the solid–water interface to the free solid surface is highly energetically unfavourable. Unlike solid tribocharging, where high shear stresses easily break chemical bonds at asperities4,5, the contact line of a drop is soft. While the charging of drops has been recognized for over a century6,7, quantitative experiments have been scarce until recently. In the past decade protocols have emerged to quantify this charging of sliding drops8,9,10,11. Understanding the mechanisms behind water drop electrification is essential to understanding dynamic wetting and has major implications for many areas related to condensation, energy generation, printing and desalination12,13,14.
Despite extensive efforts, the microscopic origin of charge transfer in slide electrification remains debated15,16,17. For liquid water, the prevailing view attributes charging primarily to surface charges, which form spontaneously at the water–solid interface. The bound surface charges are usually formed by the dissociation of surface groups such as amino groups18 or the adsorption of ions that remain on the solid surface at the receding contact line. This initial (or primary) charge separation is driven by chemical energy. As the contact line of the drop recedes, the counterions in the diffuse part of the electrical double layer (EDL) accumulate in the sliding drop, while the surface charge remains on the dewetted surface2,19,20. For hydrophobic surfaces there is still no consensus on how surface charges are formed15,16,17,18,21. Zeta potential measurements22, potentiometric titration23,24 and surface force experiments25 demonstrate that they are usually negatively charged. These observations suggest that an enrichment of OH− at the interfaces leads to surface charging. Electron transfer has been proposed as an additional mechanism to ion transfer: direct electronic exchange due to electron cloud overlap of the solid–liquid interface contributes to surface charging15,16,17,21. Electron transfer is commonly considered to be the dominant charge transfer mechanism in contact electrification for solid–solid contact pairs of metals and semiconductors. For insulators, and particularly for polymers, electron transfer is not convincing26,27,28. Charge transfer in contact electrification of insulators is still debated.
It is well known that ice–vapour and ice–solid interfaces of water are often charged29,30,31. In ice, the main charge carriers are believed to be protons (or H3O+) and OH−, but not electrons29,32,33. Tribocharging of solid surfaces by ice can lead to charge densities above 1 mC m−2. The effect has even been used to build triboelectric nanogenerators34,35. For ice, the formation of the diffuse part of an EDL would be supressed. Although a liquid-like interfacial layer is often reported at ice surfaces and solid–ice interfaces, the thickness of this layer under sub-freezing conditions is generally considered to be much thinner than that of a typical EDL. Furthermore, it is expected to decrease with decreasing temperature to below 1 nm (refs. 36,37,38). For this reason, one would expect that charge separation occurring between a solid and ice is different from slide electrification between a solid and liquid water.
In this Article we ask whether the charging observed in liquids and their frozen counterparts is fully captured by an ion-transfer-based description or whether additional mechanisms contribute (and if so, which). To elucidate the fundamental process(es) of charge transfer, we studied the tribocharging and the slide electrification of frozen and liquid water, formamide (both polar), diiodomethane and 1-bromonaphthalene (both non-polar). Formamide is another polar self-ionizing liquid (2HCONH2 ⇌ HCONH3+ + HCONH−, pKₐ = 16.8)39. Unlike water and formamide, non-polar liquids do not contain free ions because the dissociation of chemical groups or the dissolution of salt is energetically too costly. Accordingly, substantial slide electrification has only been observed for polar liquids40. He and Darhuber observed that, for a series of liquids, the generation of charges is at least ten times lower for liquids with a relative permittivity εr < 30 than for water41. Similar observations were found in other reports42,43. The finite conductivity caused by contamination in non-polar liquids is often responsible for the electrification44.
We performed experiments on five chemically different surfaces. Using a tilted plate set-up with capacitive current detection11, we quantified charge accumulation under controlled temperature conditions. Our results show that the frozen state of polar liquids, despite reduced ionic mobility, continues to charge substantially, with enhanced charging near the melting transition. Non-polar liquids in both liquid and frozen phases displayed consistent charge deposition, indicating an additional mechanism.
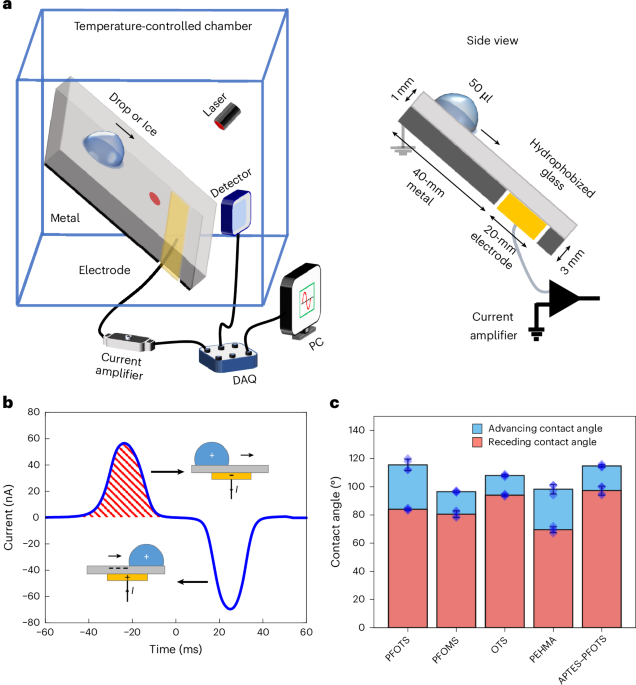
To measure the charge (Q) deposited by the liquid/solid phase we used a tilted plate set-up enclosed in a temperature-controlled chamber (Fig. 1a and Supplementary Videos 1 and 2)11. The ice or drops slide down a hydrophobized glass plate. A 20-mm-long copper electrode at the back of the substrate was connected to a current amplifier to detect the drop charge. It was positioned at a drop/ice sliding distance of 40 mm (ref. 2). While a drop slides down the solid surface it acquires an electrical charge and leaves an opposite charge on the surface. The sliding distance (40 mm) was chosen such that the drop/ice would be saturated with charge45. We measured the resulting capacitive current induced when the charged drop slides over the electrode. When a charged drop passes over the electrode, it generates a bipolar induced current signal (Fig. 1b) due to the generation of image charges. For a water drop sliding over octyltrichlorosilane (OTS)-coated glass, the first peak is a positive current peak due to the accumulated positive drop charge. Electrons are flowing into the electrode. After the drop passes the centre of the electrode, the current reverses to a negative peak due to electrons flowing back to ground (Insets Fig. 1b). We integrated the first half of the bipolar current peak to estimate the amount of accumulated charge (red shaded area in Fig. 1b). As the contact area of sliding ice cannot be determined reliably, owing to possible microscopic roughness and the presence of a quasi-liquid layer, we report total charge rather than charge density. The surface is initially neutralized with an ion gun, meaning that the recorded drop charges correspond to the charges of the first drop sliding on a previously uncharged surface. Advancing and receding contact angles of water drops on various hydrophobic coatings are given in Fig. 1c. Characterizations and properties of the surfaces and liquids used are given in Table 1 and Supplementary Figs. 1 and 2.
Fig. 1: Measuring charge.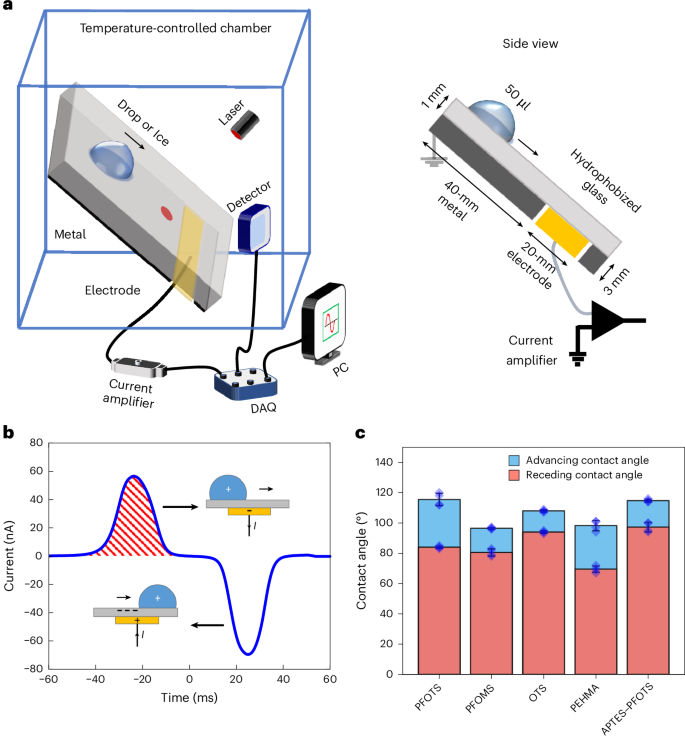
a, Set-up for measuring the charge on drops and ice, comprising a hydrophobized glass plate tilted at 50° with a copper electrode at the back, which is connected to a current amplifier for signal detection. A laser and detector were placed 10 mm above the bottom electrode (red dot) to trigger the recording of the signal. The current signal was amplified and recorded by a data acquisition (DAQ) system. b, The recorded signal from a 50-µl water drop sliding on OTS-coated glass. The first peak corresponds to the accumulated charge in a drop, while the second (inverse) peak represents the deposited charge due to slide electrification in addition to the charge on the drop. Inset: diagram showing the current (I) direction away from the electrode (positive peak) and toward the electrode (negative peak). The red shaded area was integrated to determine the accumulated charge on the drop. c, Advancing and receding contact angles of water drops on various hydrophobic coatings on glass. APTES, (3-aminopropyl)triethoxysilane; PEHMA, poly(2-ethylhexyl methacrylate). Data are presented as mean values ± s.d. of n = 3 independent measurements of contact angles.
Table 1 Properties of liquids used in the study at 20 °C
As an example, we present the drop charges measured using OTS-coated glass, as these surfaces lead to strong charge separation (Fig. 2). Within a temperature range of 0 to 20 °C, a 50-μl water drop accumulates a charge of around 1 nC. Following the common theory, we attribute this signal to adsorbed hydroxide ions (OH⁻)1,2,20,46,47. Water contains hydroxide ions and hydronium ions (H3O+) due to self-ionization. During its interaction with the hydrophobic surface, OH− ions are adsorbed at the surface–liquid interface and form an EDL22. On dewetting, some OH− ions stay on the surface, resulting in a negatively charged surface. The water drops accumulate H3O+ ions, resulting in a net positive charge. We would like to point out that it has not yet been proved that hydroxide ions cause slide electrification, and that other ions (for example carbonate) may also be involved48.
Fig. 2: Inequality of charge at the melting point.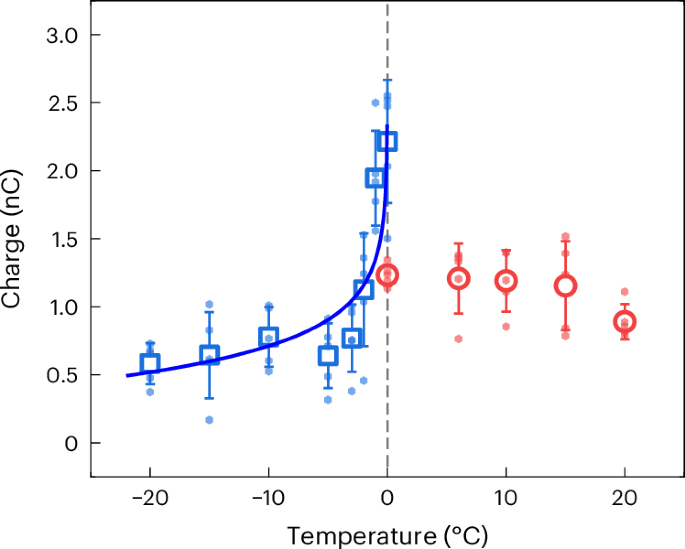
The charge accumulated in water drops (red) and ice (blue) on OTS-coated glass as the temperature is varied (±1 °C). The widths of the ice and water drops were around 5 mm. The blue curve represents the weighted fitting of the logarithmic form Q = Aln(Tm − T) + B, where Tm is the melting temperature and A and B are fitting parameters with units of Coulombs. Fitting parameters and reduced χ2 values are given in Supplementary Table 2. Data are presented as mean values ± s.d. of n = 5 measurements of charge.
Ice showed a lower and constant charge (0.5–0.8 nC) at temperatures ≤−5 °C. Near the melting point, the charge (Fig. 2) was even higher with ice (2.2 nC) than with a water drops (0.8–1.2 nC). The pronounced increase in deposition rates for ice near 0 °C indicates that other processes in addition to ionic transfer of surface charges contribute in this regime36. Similar charging behaviour—high charging for the liquid, low charging for ice at or below −5 °C and a peak near the melting point—was observed for perfluorooctyltrichlorosilane (PFOTS)- and chloro(dimethyltridecafluorooctyl)silane (PFOMS)-coated substrates (Fig. 3). This difference did not arise because of different sliding velocities, as the velocities remained almost constant across phase and temperature (Supplementary Fig. 3).
Fig. 3: The effect of coating on electrification.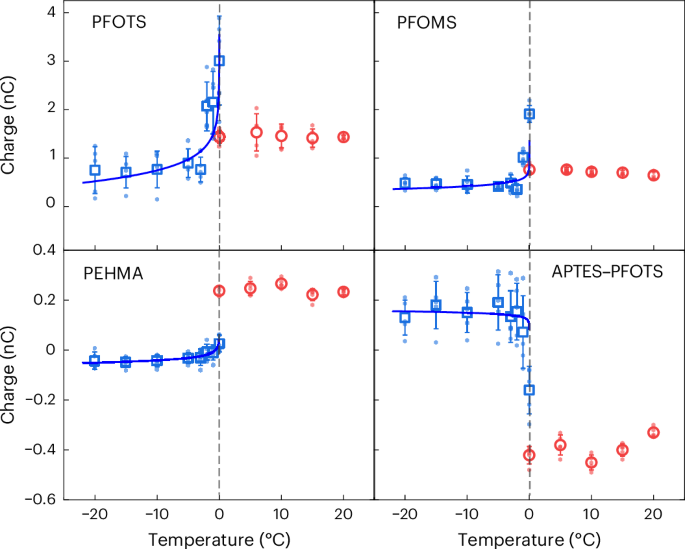
Drop charge versus temperature (±1 °C) are shown for water (red) and ice (blue) measured on PFOTS-, PFOMS-, PEHMA- and APTES–PFOTS-coated glass. Blue curves represent the weighted fitting of the logarithmic form Q = Aln(Tm − T) + B. Data are presented as mean values ± s.d. of n = 5 independent measurements of charge.
The two charging regimes for ice and water and the peak in between them indicate that two different charge transfer processes prevail. For water at T ≥ 0 °C, the results are consistent with the deposition of anions from the EDL. Below 0 °C, the formation of a diffuse layer is hindered for ice. It is established that a liquid-like layer exists at ice–vapour and ice−solid interfaces49. This quasi-liquid layer, which forms due to surface premelting36,37,38,50,51, can enable OH⁻ ion transfer and deposition onto the surface52. The thickness of this layer is highly temperature dependent53. Below approximately −16 °C, it has been reported to decrease to the order of a bilayer of water molecules53. This layer is much thinner than the typical Debye length of an aqueous EDL (~100 nm). Moreover, our measurements show no temperature dependence of charge deposition that would correlate with changes in the thickness of the liquid-like layer or with residual temperature gradients in the ice. However, protons and hydroxides still exist, and can diffuse and cause substantial charging. In addition, formamide showed a charging behaviour similar to that of water (Supplementary Fig. 4).
A possible second mechanism, which may dominate below 0 °C, involves electron transfer driven by direct contact between the ice and the substrate during sliding54. In this scenario, the overlap of electron clouds at the interface facilitates net electron transfer from the ice to the surface, leading to negative surface charging. Near 0 °C, the simultaneous presence of both solid and liquid water phases can promote a hybrid charging mechanism, where electron transfer coexists with ionic (OH⁻) transfer, enhancing the overall deposition rate and thus increasing the charge on ice36.
Ice and water do not always charge in the same polarity (Fig. 3). For PEHMA-coated glass, interaction with a water drop results in a positive charge of 0.22 nC to 0.27 nC, which is consistent with OH⁻ adsorption from the liquid onto the surface (Fig. 3). In contrast, when the same coating interacts with ice at temperatures at or below −5 °C, a net negative charge of −0.03 nC to −0.05 nC is accumulated (Fig. 3). This polarity switch cannot be explained by ions alone, pointing towards an alternative mechanism. The effect is reversed for APTES–PFOTS coatings, on which water charges negatively and ice positively (Fig. 3). The amine group is protonated by the sliding water drop (R-NH2 + H3O+ → R-NH3+ + H2O), resulting in a net positive surface charge when contacted by water at near-neutral pH; the surface pKa of the primary APTES layers is ≈ 9.6, so a substantial fraction is protonated under our conditions18,55. As a result, the drop charges negatively. However, ice may transfer electrons to the surface, making it negatively charged. At 0 °C, the measured charge for both coatings lies between that of water and ice. This is consistent with a regime where ion and electron transfer occur simultaneously but in opposite directions, partially cancelling one another and yielding a reduced net charge.
The polarity inversion suggests that ion transfer from the quasi-liquid layer does not fully account for ice charging below −5 °C. While direct evidence of electron transfer in such systems is still lacking, earlier work has shown that ice–metal contact electrification depends on the Volta potential (V) difference56,57,58,59. Reported logarithmic dependences of the form V ∝ ln(Tm − T) suggest a change in charging as the melting point is approached58. To assess compatibility with this logarithmic form, we performed weighted fits of the function Q = Aln(Tm − T) + B to the data (blue curves in Figs. 2 and 3). As shown in Supplementary Table 2, the reduced χ2 values (\(\chi^2_{\mathrm{r}}\)) vary across substrates (\({\chi }_{\mathrm{r}}^{2}\,\approx1.1\) for OTS and PFOTS, \({\chi }_{\mathrm{r}}^{2}\,=3.26\) for PFOMS and \({\chi }_{r}^{2}\,\ll1\) for PEHMA and APTES–PFOTS) and coefficients are weakly constrained. Thus, the logarithmic form cannot be rejected, but neither can it be uniquely confirmed as the physically required dependence, particularly given the non-uniform behaviour across surfaces.
Moreover, the polarity reversal between PEHMA and APTES–PFOTS surfaces constitutes a violation of the transitive property of the triboelectric series: if charging were governed by a single ordered series, the polarity of deposition should follow a consistent ranking across all surfaces and liquids. The observed reversal therefore is difficult to reconcile with a single surface-potential-based mechanism. We note that surface and liquid contamination can influence charge polarity60, but the systematic and reproducible nature of the polarity patterns across surfaces makes contamination an unlikely sole explanation for the observed behaviour.
Phase-dependent charging in polar liquids alone cannot confirm distinct mechanisms; however, charging behaviour in a non-ionizing liquid does provide an important clue. We carried out charge measurements with non-polar liquids that have a high surface tension, such as diiodomethane and 1-bromonaphthalene. In contrast to the polar liquids tested, the number of free ions and the formation of an EDL should be negligible44. Moreover, our tested polar liquids are self-ionizing in nature, while non-polar liquids are not. Drop charging was reduced to 30–50% of that of water (Fig. 4). For the non-polar liquids, drop charging decreased presumably because the formation of surface charges and an EDL is suppressed44. Charge reversal was even observed for OTS- and PEHMA-coated surfaces. Considerable charge with non-polar liquids suggests the presence of an alternative mechanism (Fig. 4). As non-polar liquids have relatively low relative permittivities (εr = 5.3 for diiodomethane and 4.8 for 1-bromonaphthalene) compared with those of polar liquids (εr = 80 for water and 111 for formamide), the electrostatic energy cost of separating charges is high (U ≈ 1/εr). The much larger U in non-polar liquids implies that ion pairs are much more tightly bound and that spontaneous ion separation is strongly suppressed44. Thus, the higher energy cost suppresses ion-based charge separation during sliding. However, other charging pathways (that is, electrons) can still operate and result in substantial deposition.
Fig. 4: Electrification of non-polar liquids.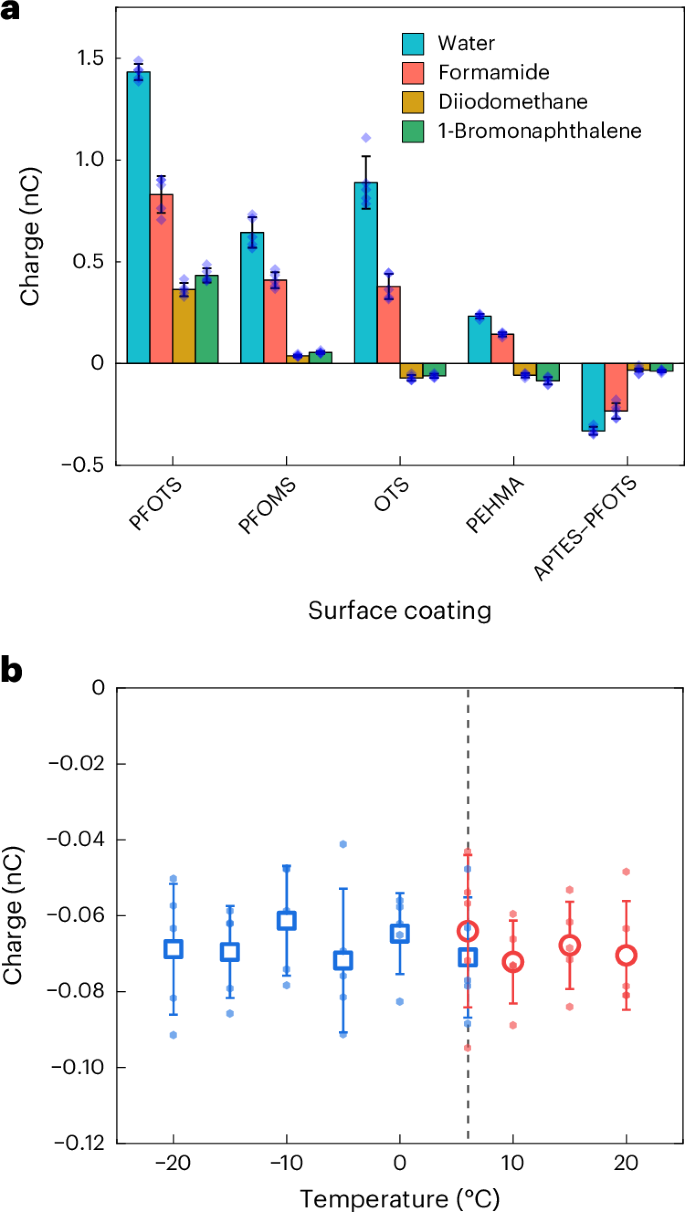
a, Comparison of charges on polar (water and formamide) and non-polar (diiodomethane and 1-bromonaphthalene) drops at 20 °C on various surfaces. b, The charges on liquid- and frozen-phase diiodomethane drops on OTS-coated glass showed consistent behaviour without any peak at the melting point (6 °C, vertical black dashed line). Data are presented as mean values ± s.d. of n = 5 independent measurements of charge.
In Fig. 4a we compare drop charges measured with different liquids on surfaces with different chemical functionalities. On PFOTS, PFOMS and APTES–PFOTS coatings, all liquids consistently deposited charges of the same polarity, although the magnitudes differed. Conversely, for OTS and PEHMA coatings, a polarity reversal was observed when switching from polar to non-polar liquid (Fig. 4a). These results demonstrate that hydroxyl groups (for PFOTS and PFOMS) or protons (APTES–PFOTS) are not the only charges that are transferred, because these cannot explain the drop charges for diiodomethane and bromonaphthalene.
Furthermore, if water contamination was responsible for the charging by diiodomethane and bromonaphthalene, the polarity would remain consistent with water drops across all surfaces. We performed Karl Fischer coulometry to quantify residual water and found <0.05% water in the non-polar liquids and <0.4% in formamide. The observed reversal therefore supports an additional mechanism at play in non-polar liquids.
We also compared charge deposition for a non-polar liquid and its frozen phase (Fig. 4b). A liquid diiodomethane drop (50 μl) at room temperature accumulated a charge of around −0.07 nC on OTS-coated glass. The charge was independent of temperature for the tested range of −20 °C to 20 °C. No appreciable change was detected at the melting point (6 °C) between liquid and frozen diiodomethane, which differs from our observation with polar liquids (Fig. 2a). A similar charging behaviour was also observed for other hydrophobic substrates and non-polar liquids (Supplementary Figs. 5 and 6). The fact that a discontinuity was observed for polar liquids but not for non-polar liquids suggests that it is not a trivial consequence of a phase transition. It instead reflects a fundamental difference between charging mechanisms. We note, however, that temperature-dependent Volta potential data analogous to those reported for ice are not available for diiodomethane or 1-bromonaphthalene. Therefore, the non-polar-liquid data obtained here cannot be used as a direct test of the logarithmic Volta potential dependence proposed in ref. 58. Nevertheless, the finite charging of non-polar liquids, together with their weak phase dependence and occasional polarity reversal relative to water, supports the presence of an additional charge transfer pathway beyond conventional ion transfer. It is consistent with the electron transfer hypothesis: as ions most probably do not contribute to charge deposition in non-polar liquids, electrons may provide the dominant transfer pathway. In addition, the charging magnitudes of polar liquids consistently exceeded those of non-polar liquids by approximately one order of magnitude across all five tested surfaces. This observation can be explained naturally by the contribution of ions that are present in polar, self-ionizing liquids but absent in non-polar ones. Electron transfer cannot be strictly ruled out as the only mechanism on the basis of the absence of a melting-point discontinuity alone, as the Volta potentials of non-polar compounds may vary only weakly across the melting point.
To further analyse a possible contribution of electron transfer to charging, we plotted the average electronegativity of the liquids and surface functional groups with the polarity of charge deposition. For the non-polar liquids we found a correlation between the average electronegativity of the liquid and the surface functional groups with the polarity of charge deposition. Specifically, the direction of charge transfer was correlated with the difference in electronegativity between the surface coating and the liquid molecules (Fig. 5). Here the electronegativity difference is defined as Δen = χs − χl, where χs and χl are the average Pauling’s electronegativities for the surface groups and liquid molecules, respectively. The χs and χl values were calculated by taking arithmetic averages of the electronegativities of individual atoms61,62. These values are presented in Supplementary Table 1. When the average electronegativity of the surface exceeds that of the liquid (Δen > 0), electrons preferentially transfer from the sliding liquid to the surface, resulting in a net positive charge of the drop. Conversely, when the liquid has a higher electronegativity (Δen < 0), electrons transfer from the surface to the liquid, leaving the drop negatively charged. This correlation provides a straightforward explanation for the polarity reversals observed in Fig. 4a. For example, PFOTS- and PFOMS-coated surfaces, which possess more electron-withdrawing groups than the tested non-polar liquids, can charge the liquid positively due to electron donation from the liquid. In contrast, coatings such as OTS and PEHMA, which have lower effective electronegativities relative to the liquid, charge the liquid negatively.
Fig. 5: Electronegativity correlation.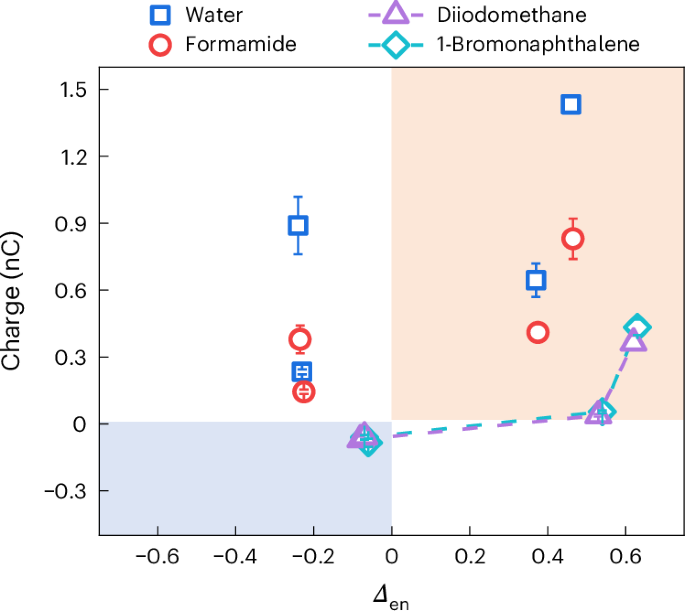
The liquid charge variation (at 20 °C) with Δen is shown for polar and non-polar liquids. The red shaded area represents the region where drop charge and Δen are positive; the blue shaded area represents negative values. Dashed connecting lines are plotted for better visibility of non-polar liquids. Data are presented as mean values ± s.d. of n = 5 independent measurements of charge.
However, polar liquids do not follow this trend, probably due to the dominant contribution from ion transfer. In addition, no direct correlation was observed between the amount of charge deposition and Δen, as charge deposition is influenced by multiple factors (including surface wettability, drop velocity, sample preparation and surface roughness). Furthermore, the electronegativity of the outermost exposed surface groups is likely to play a more important role in the charge transfer process than that of the inner functional groups. Water and non-polar liquids in their frozen states generally follow the trend in electronegativity differences, except for ice on OTS, which may indicate that the contribution from the quasi-liquid interfacial layer still dominates (Supplementary Fig. 7). These results suggest that interfacial electron transfer is governed by relative electronegativity differences, and provide a predictive descriptor for charge polarity in liquid–solid triboelectrification. Electronegativity, as used here, serves as a molecular-level proxy for the same driving force that underlies Volta potential differences at the condensed-matter level. When Volta potential data for the relevant liquid–solid pairs become available, they may provide a more rigorous quantitative test of this picture. Although our observations strongly indicate a contribution from electron transfer as an additional mechanism, direct evidence for electron involvement is still lacking.