
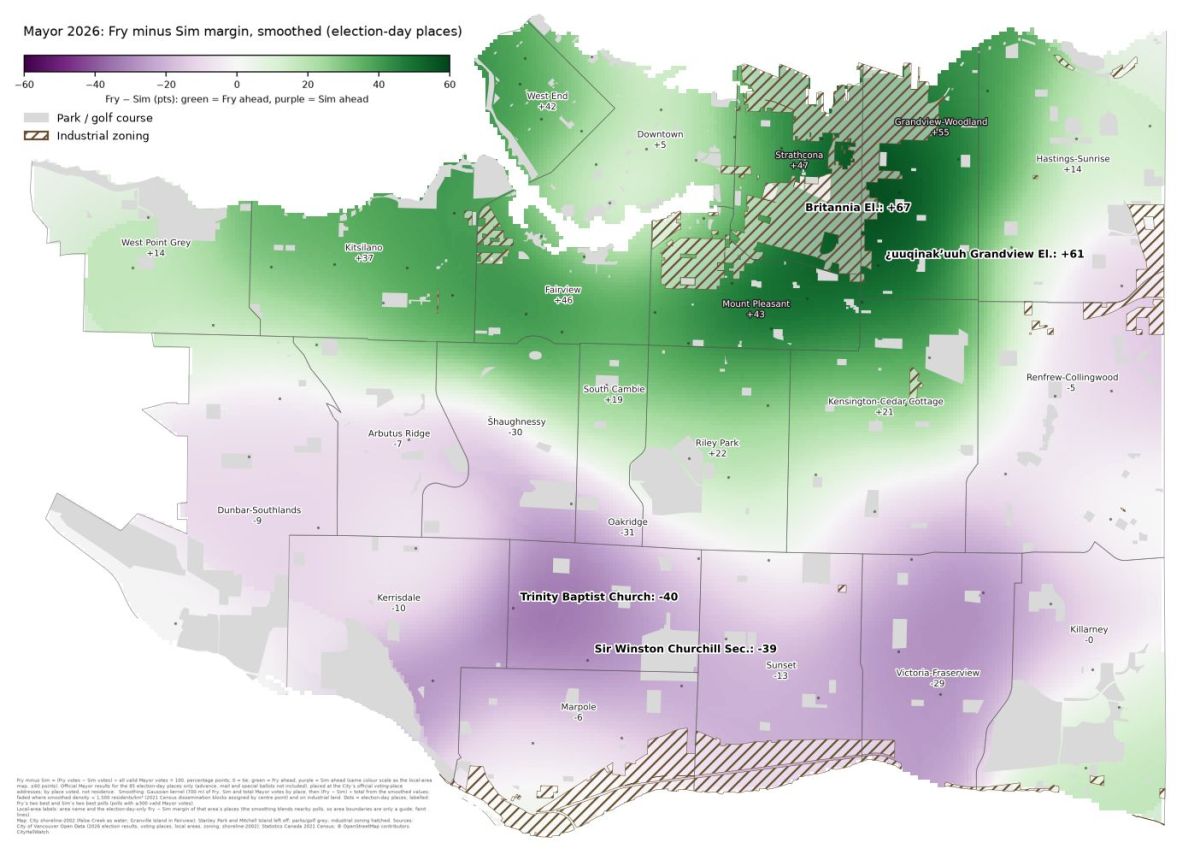
 2026 margins for Fry and Sim
The City of Vancouver has now published the official 2026 election results for every voting place on its open data portal (files dated October 22). This post looks at turnout and at how different parts of the city voted for Mayor and Council. It follows our earlier posts Polling station distribution by neighbourhood and population (Vancouver 2026 civic election) and Official 2026 Vancouver election results: Burns passes Klassen by 2 votes for 9th, both still elected; both plebiscite questions pass.
Key takeaways
Voters delivered a decisive mandate for progressive governance. Pete Fry (GREEN) secured the mayoralty with a commanding 98,748 votes to Ken Sim’s 67,598, driven by overwhelming margins in the northeast and inner neighbourhoods around Fairview, Mount Pleasant and Kitsilano, and Grandview-Woodland. Ken Sim (ABC Vancouver) led in the south and southwest. The split is not really east versus west but rather north versus south, and all three broad regions favoured Fry: by 9.6 points on the Westside, 16.6 in East Vancouver and 19.5 in the Downtown and the West End.
The electorate effectively dismantled the incumbent ABC majority, electing a left-leaning slate of GREEN and COPE councillors, two parties with many shared values, and leaving just one OneCity councillor, Lucy Maloney, and Mike Klassen as the sole ABC survivor among the ten city councillors. This shift indicates a profound rejection of the previous administration’s overall civic management, with voters heavily backing candidates who described themselves as “progressive.”
Tip: There are many ways to slice-and-dice and compare the large quantity of numbers. Readers will likely find it most useful to scan the whole post for the maps, tables, and headings, and then zero in on topics and areas of greatest personal interest.
Key takeawaysCitywide numbersPoll-by-poll tidbitsMayoral raceCouncillor raceTurnout and ballot quirksHow people voted: election day, advance, mailThe local view: neighbourhood by neighbourhood (22 local areas)Ballots per 100 residentsCouncil slate strength by local areaTurnout and party strength mapsWhere election-day turnout was highestWhere each party was strongestSlates that won no Council seatsPark Board and School Trustee slate strength comparisonGrouping the neighbourhoodsLooking at the city as seven areas (“main grouping”)The city in five groupsEast, West and Downtown + West End: a three-region viewWhich Council slate won each neighbourhood (local area)Where each slate was strongestNotes and caveatsSources
Citywide numbers
2026Registered voters483,324Ballots cast209,711Turnout43.39%Pete Fry (GREEN), Mayor98,748Ken Sim (ABC Vancouver), Mayor67,598
The registered-voter total includes 9,199 voters in the UBC Lands and UEL, who can vote only in the School Trustee race.
Poll-by-poll tidbits
These details cover the Mayor and Council races at the 85 election-day and 59 advance voting places. UBC is left out because it votes for School Trustee only, and mail and special ballots aren’t broken down by place. The smallest polls are noisy: Morris J. Wosk Centre for Dialogue (225 ballots), Musqueam Community Centre (251) and West Point Grey Community Centre (257). Area names in brackets come from the City’s local areas.
Mayoral race
Pete Fry’s best poll was Britannia Community Elementary School (Grandview-Woodland). He received 77.5% of the votes there on election day. At its advance poll he got 82.0% to Ken Sim’s 8.0%, margins of +66.9 and +74.0 points.
Ken Sim’s best election-day polls were Trinity Baptist Church (Oakridge), 61.5% to 21.3%, and Sir Winston Churchill Secondary School (Oakridge), 60.1%. His best poll overall was the advance poll at Dr R. E. McKechnie Elementary School (Kerrisdale), 66.0% to 15.9%.
Fry’s weakest election-day poll was Shaughnessy Elementary School (Shaughnessy), 20.9%.
Closest race: Musqueam Community Centre, Fry 41.0% to Sim 40.6% on 251 ballots. Next closest was Collingwood Neighbourhood House (Renfrew-Collingwood), Fry +1.3 on 2,219 ballots. The closest advance poll was Lord Byng Secondary School (West Point Grey), Sim +1.5.
Polls won: Fry 54 and Sim 31 of the 85 election-day polls, and Fry 33 and Sim 26 of the 59 advance polls. No other candidate won any poll, election day or advance.
Colleen Hardwick’s best showings were 24.2% at the West Point Grey Community Centre advance poll and 18.5% at Dunbar Community Centre on election day.
Kareem Allam’s best showings were 8.6% at the Sunset Community Centre on election day and 7.5% at the Coal Harbour Community Centre advance poll.
Rebecca Bligh’s best showings were 7.6% at Fraser Lands Church and at David Lloyd George Elementary on election day, and 5.8% at the Champlain Heights Community Centre advance poll.
Advance and election-day voters were very similar: Sim 34.2% vs 32.0%, and Fry 47.5% vs 47.3%.
Councillor race
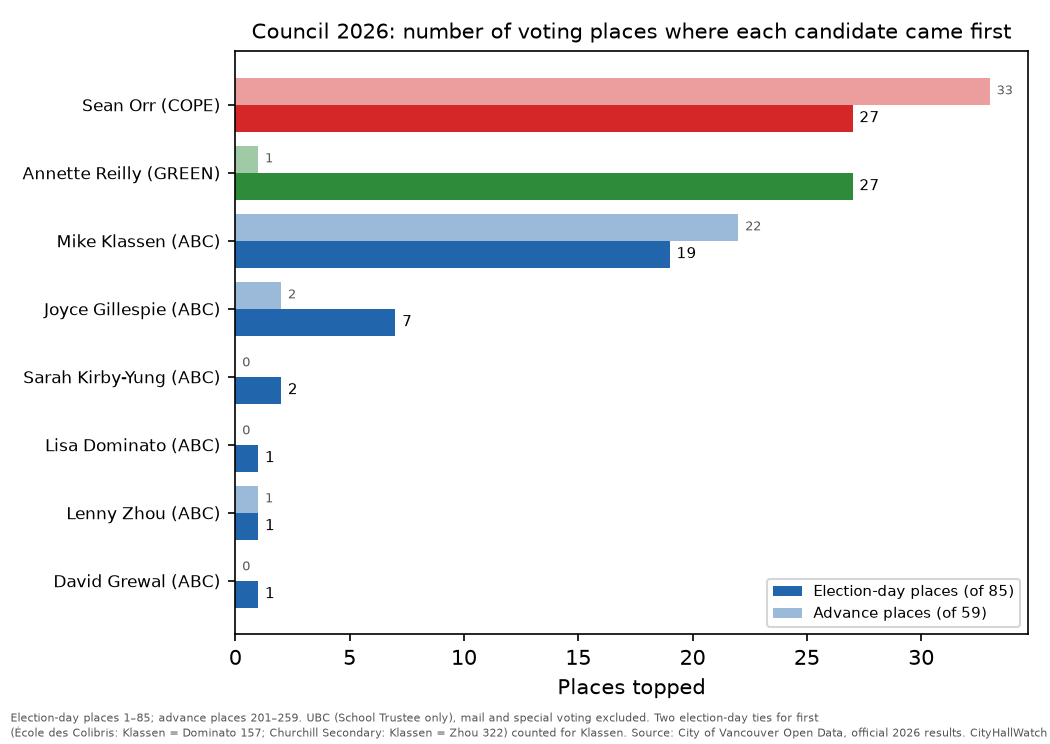
Most polls topped:
Sean Orr (COPE): 27 election-day and 33 of 59 advance polls.
Annette Reilly (GREEN): 27 election-day and 1 advance.
Mike Klassen (ABC Vancouver): 19 election-day and 22 advance. His count includes two ties.
Reilly came second most often on election day (23 polls), then Orr (22).
Orr was marked on 76.1% of ballots at the Britannia advance poll and 65.5% at Grandview Elementary School on election day. The top five Council showings in each channel are all his. (Note: The term “channel” refers to election day, advance polls, mail-in ballots, and special voting stations.)
Topped polls but weren’t elected, all ABC Vancouver:
Joyce Gillespie: 7 election-day and 2 advance. Her best was 47.6% at the Tecumseh Elementary School advance poll (Victoria-Fraserview).
Sarah Kirby-Yung: 2.
Lisa Dominato and David Grewal: 1 each.
Lenny Zhou: 1 election-day and 1 advance.
Elected but never topped a poll: Camil Dumont, Bridget Burns and Stephanie Smith (GREEN); Devyani Singh, Chloe Leslie and Solomon Yi-Kieran (COPE); and Lucy Maloney (OneCity).
Exact ties for first, both counted for Klassen above:
École des Colibris (Marpole): Klassen and Dominato, 157 votes each.
Sir Winston Churchill Secondary: Klassen and Zhou, 322 each.
Near-ties: Sunset Community Centre on election day (Klassen 528, Grewal 527) and Musqueam (Reilly 79, Dominato 78).
Very little ticket-splitting at the top. On election day, every poll Fry won was topped by a COPE or GREEN Council candidate, and every poll Sim won by an ABC Vancouver candidate. The one exception in either channel was the John Norquay Elementary School advance poll: Sim won the Mayor vote and Orr topped Council.
Best independent showings: John Jones, 7.6% at the Walter Moberly Elementary School advance poll (Sunset), and Rollergirl, 7.3% at Carnegie Community Centre (Downtown) on election day.
Turnout and ballot quirks
Busiest election-day polls: Roundhouse Community Arts & Recreation Centre (2,289), Collingwood Neighbourhood House (2,219) and Mount Pleasant Community Centre (2,002). The busiest advance poll was Mount Pleasant Community Centre (4,611).
Quietest: Morris J. Wosk Centre for Dialogue, 225 on election day and 376 at advance voting.
Collingwood Neighbourhood House had the most overvoted ballots on election day: 7 for Mayor and 13 for Council.
Renfrew Community Elementary School voters left the most Council choices blank: on average, 2.9 of their 10 votes went unused per ballot.
How people voted: election day, advance, mail
Almost half of Mayor ballots were cast at advance voting.
ChannelShare of Mayor ballotsFrySimElection day41.5%47.3%32.0%Advance49.6%47.5%34.2%Mail8.2%53.4%26.7%Special voting0.7%28.9%39.2%
Fry’s best channel was mail and Sim’s was special voting. Mail ballots rose from 6,727 in 2022 to 17,158 in 2026, or from 3.9% to 8.2% of all ballots.
The local view: neighbourhood by neighbourhood (22 local areas)
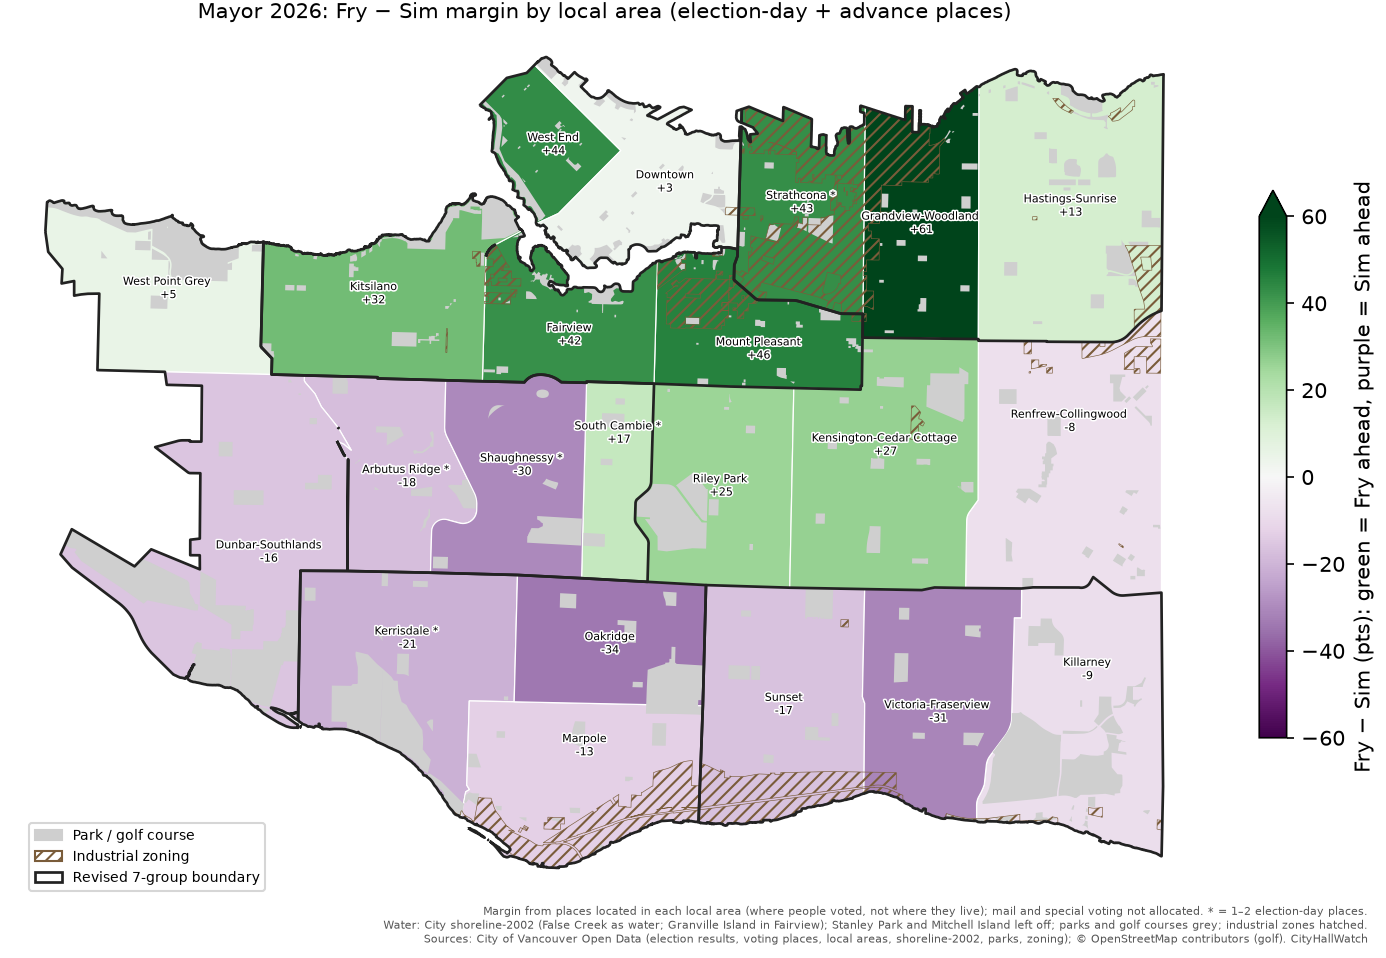
While citywide totals provide the final outcome, zooming in on Vancouver’s 22 distinct neighbourhoods shows where Fry and Sim each did best. This detailed breakdown illustrates a stark geographic divide across the city, highlighting the specific communities that served as strongholds for both Fry and Sim before diving into the local margins.
Breaking the city into its 22 neighbourhoods (local areas) shows the pattern more clearly. Fry’s lead over Sim was largest in Grandview-Woodland (+61.4 points), and Sim’s was largest in Oakridge (+34.0), followed by Victoria-Fraserview (+31.2) and Shaughnessy (+30.4). Fry led in 12 areas, mostly in the north and centre of the city. Sim led in 10, across the south and southwest, plus Renfrew-Collingwood.
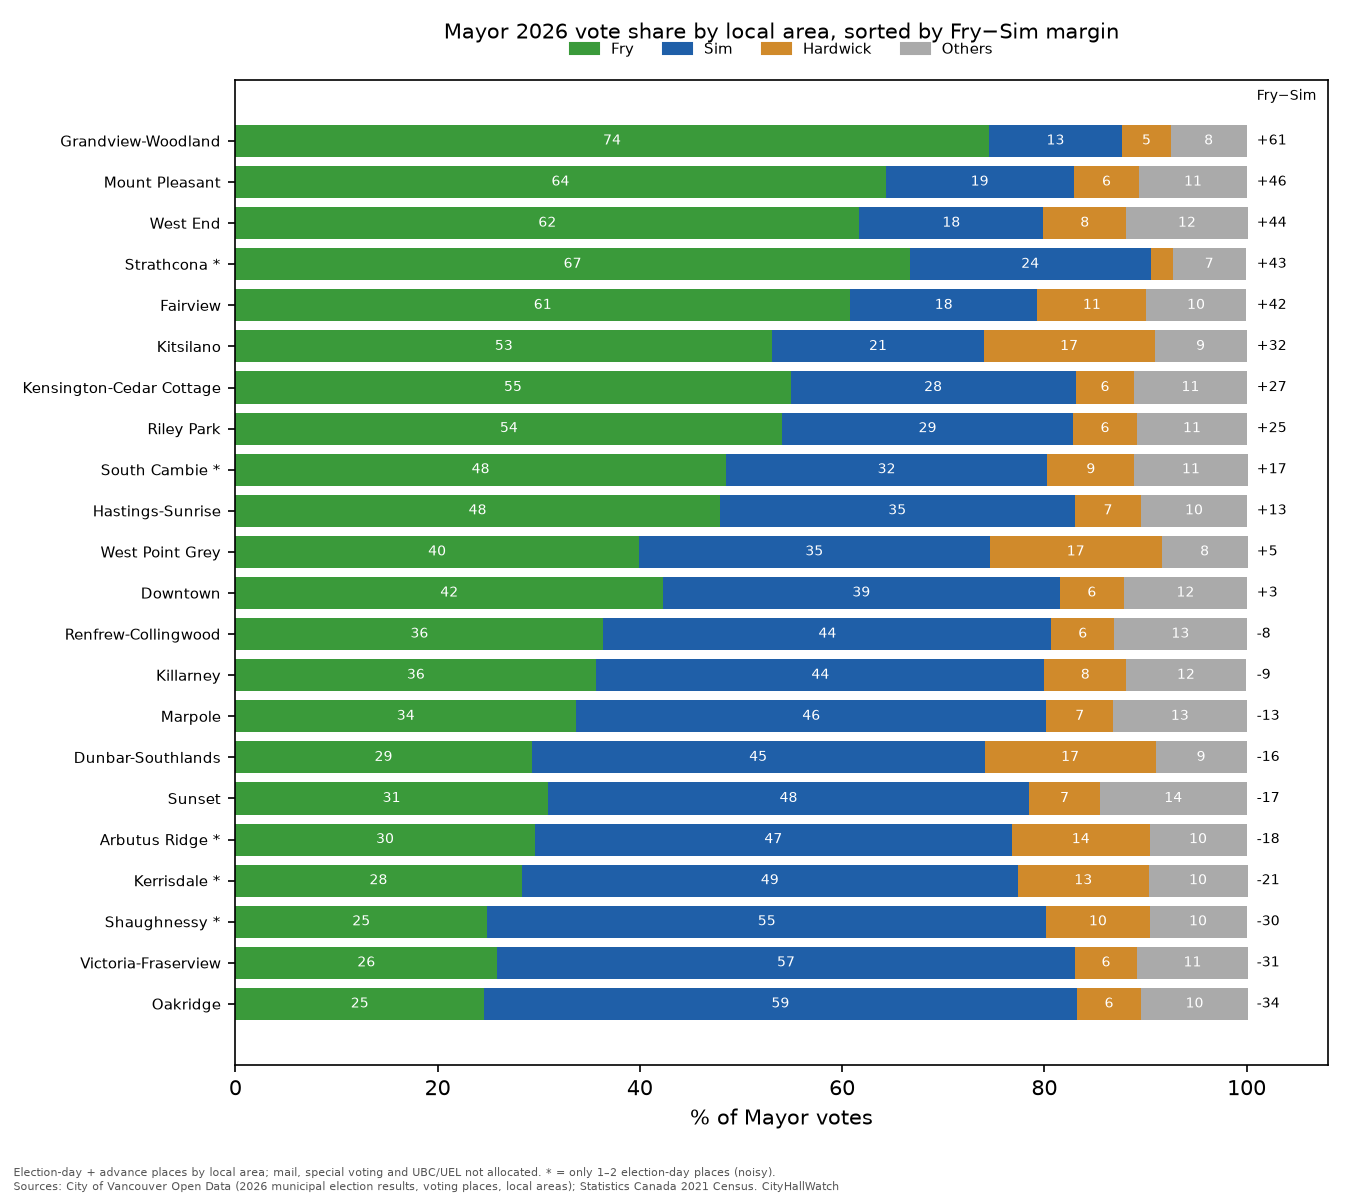
Local areaFrySimMargin (Fry−Sim)Ballots per 100 residentsGrandview-Woodland74.5%13.2%+61.439.2Strathcona*66.7%23.8%+42.920.5Mount Pleasant64.3%18.6%+45.745.1West End61.7%18.2%+43.525.2Fairview60.8%18.5%+42.326.8Kitsilano53.1%20.9%+32.236.5Kensington-Cedar Cottage54.9%28.2%+26.728.9Riley Park54.1%28.7%+25.430.4South Cambie*48.5%31.8%+16.738.4Hastings-Sunrise47.9%35.1%+12.826.0West Point Grey39.9%34.7%+5.235.3Downtown42.3%39.2%+3.123.5Renfrew-Collingwood36.4%44.3%−7.921.7Killarney35.7%44.3%−8.627.6Marpole33.7%46.5%−12.719.6Dunbar-Southlands29.3%44.8%−15.531.7Sunset30.9%47.6%−16.722.6Arbutus Ridge*29.6%47.2%−17.626.9Kerrisdale*28.3%49.1%−20.742.4Shaughnessy*24.9%55.3%−30.424.5Victoria-Fraserview25.9%57.1%−31.223.0Oakridge24.6%58.6%−34.037.4
* Only one or two election-day places. South Cambie has 1, and Arbutus Ridge, Kerrisdale, Shaughnessy and Strathcona have 2 each, so treat these results as noisy.
Ballots per 100 residents
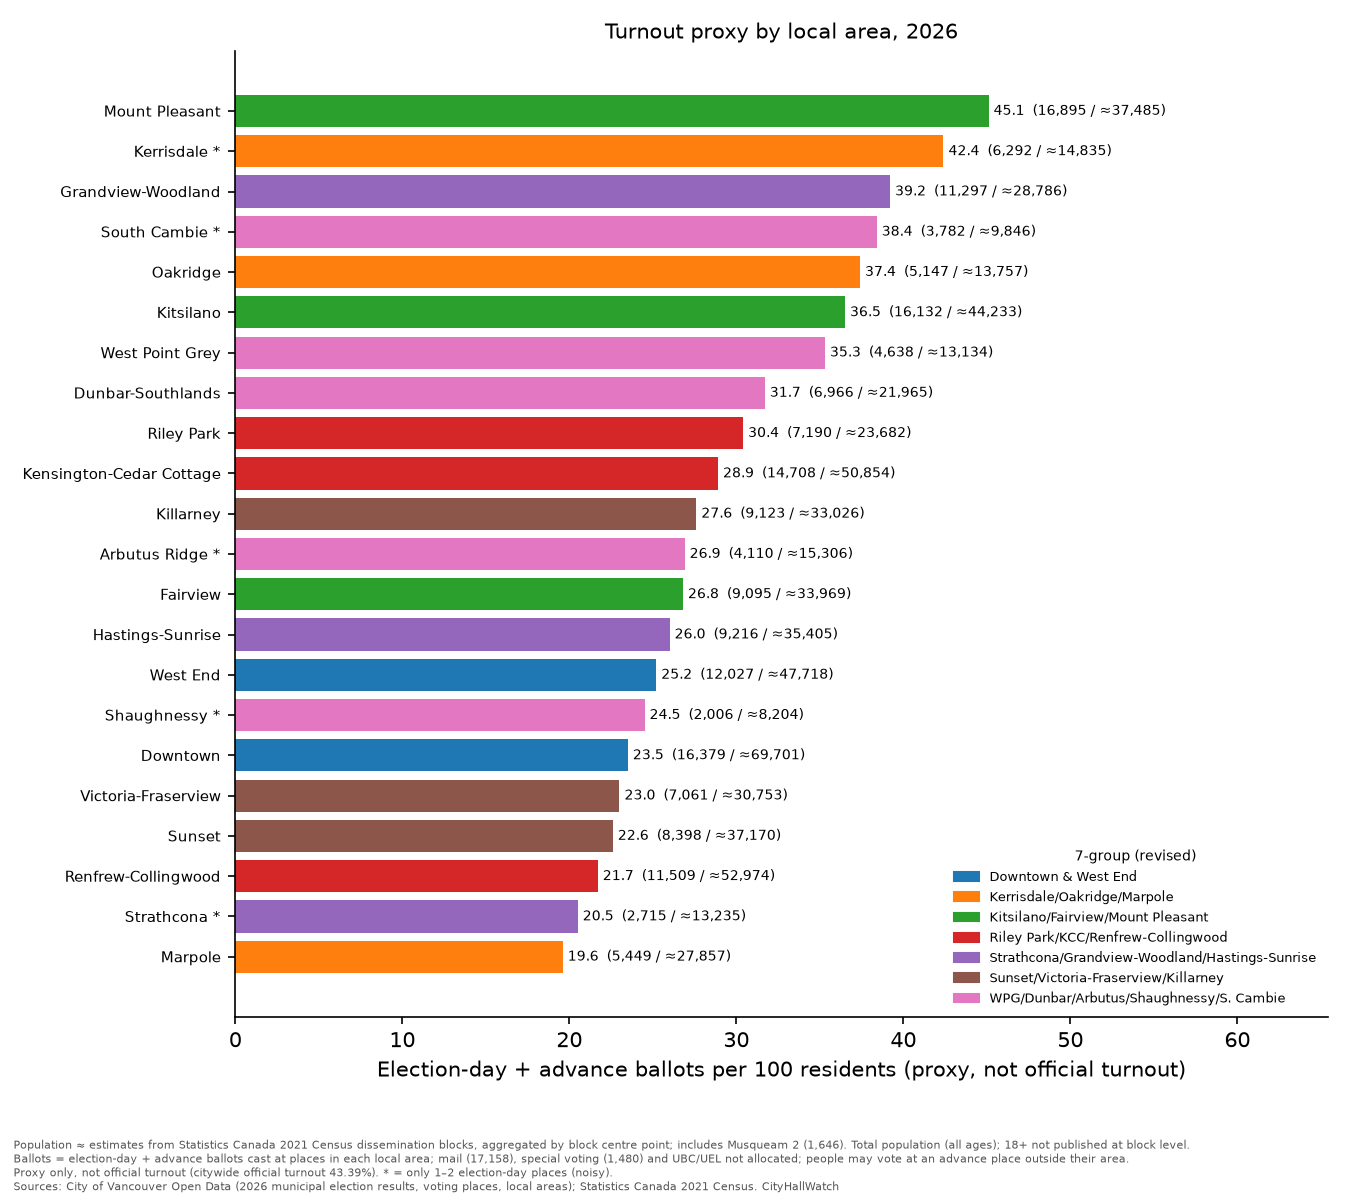
Ballots per 100 residents were highest in Mount Pleasant (45.1), Kerrisdale (42.4) and Grandview-Woodland (39.2), and lowest in Marpole (19.6) and Strathcona (20.5). This is a proxy, not official turnout. See the caveats below.
Council slate strength by local area
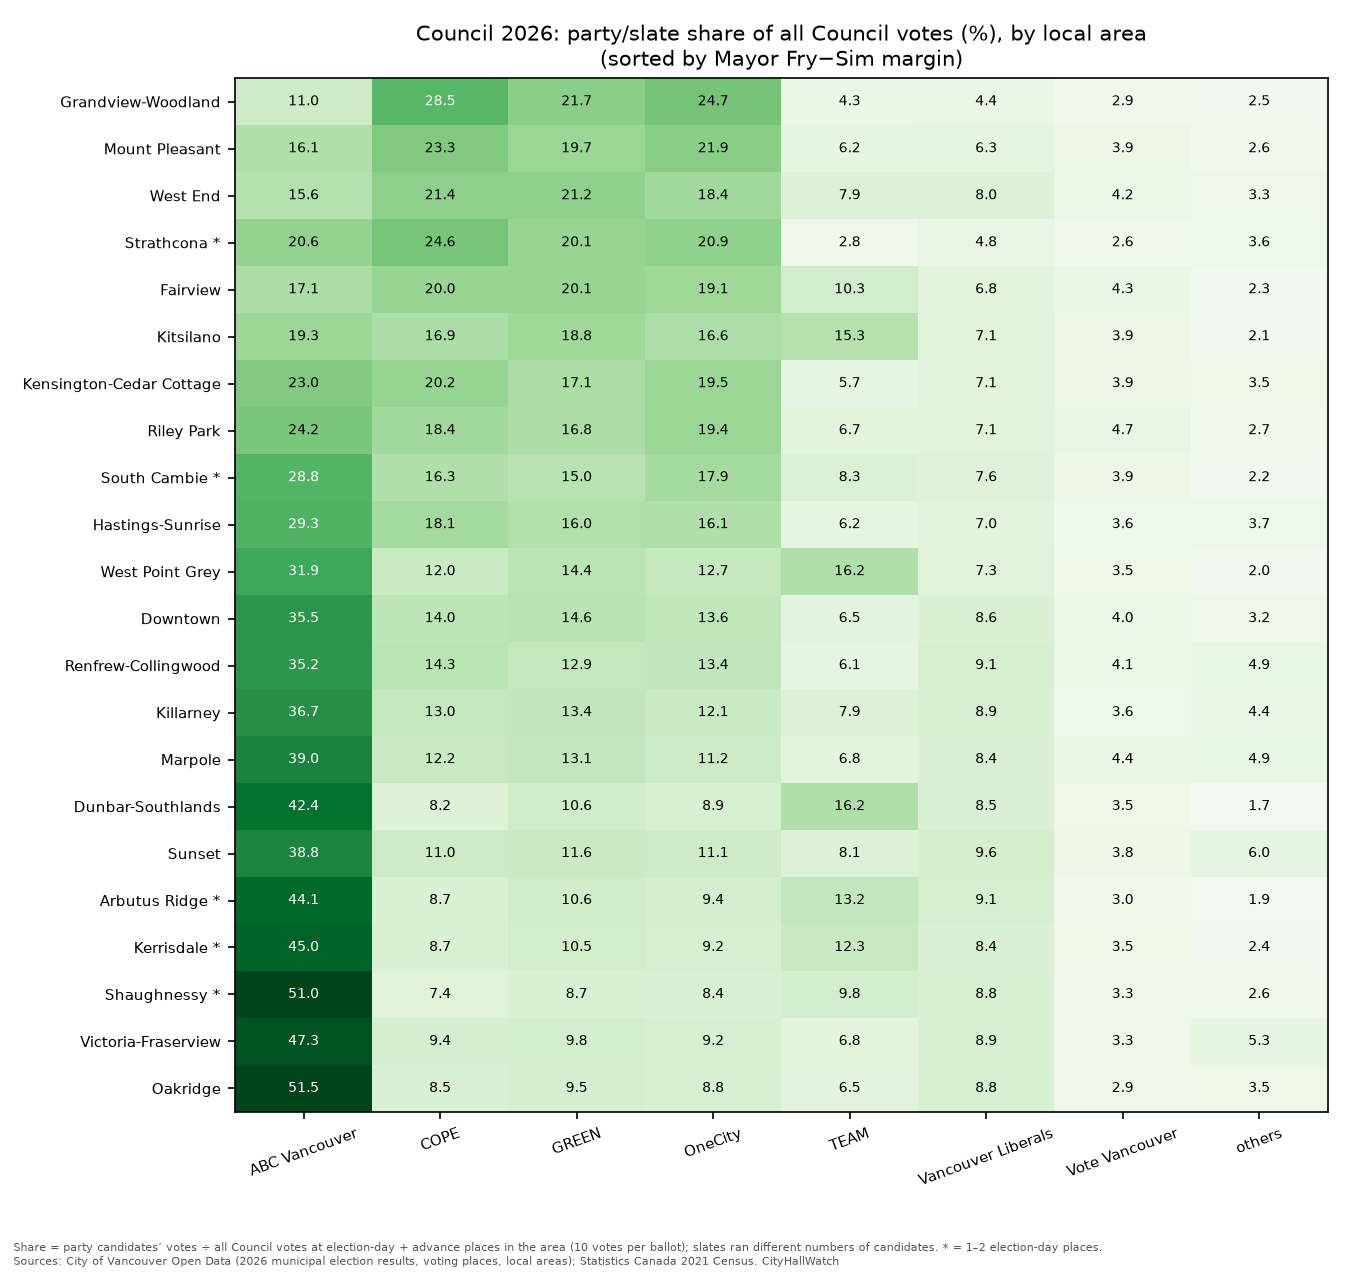
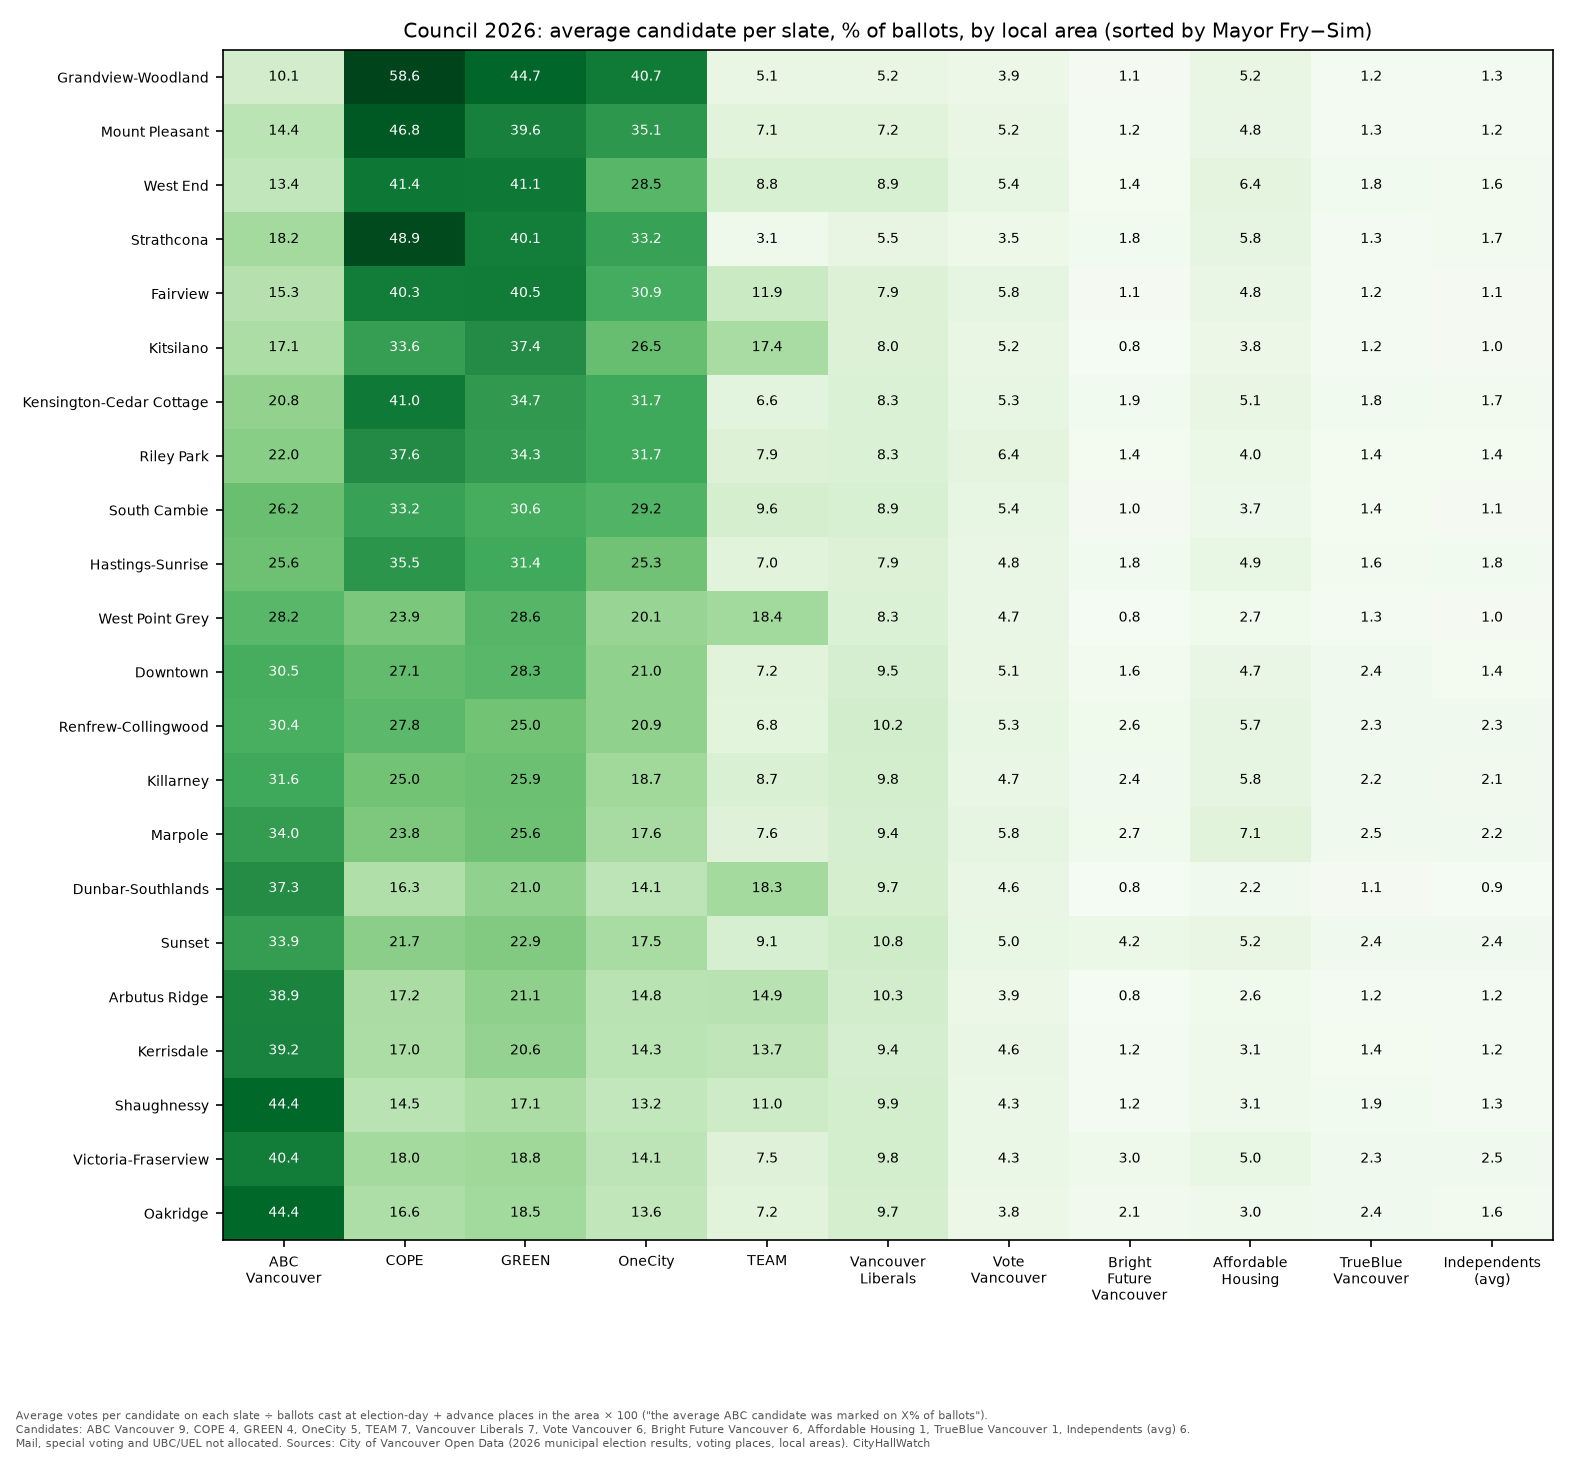
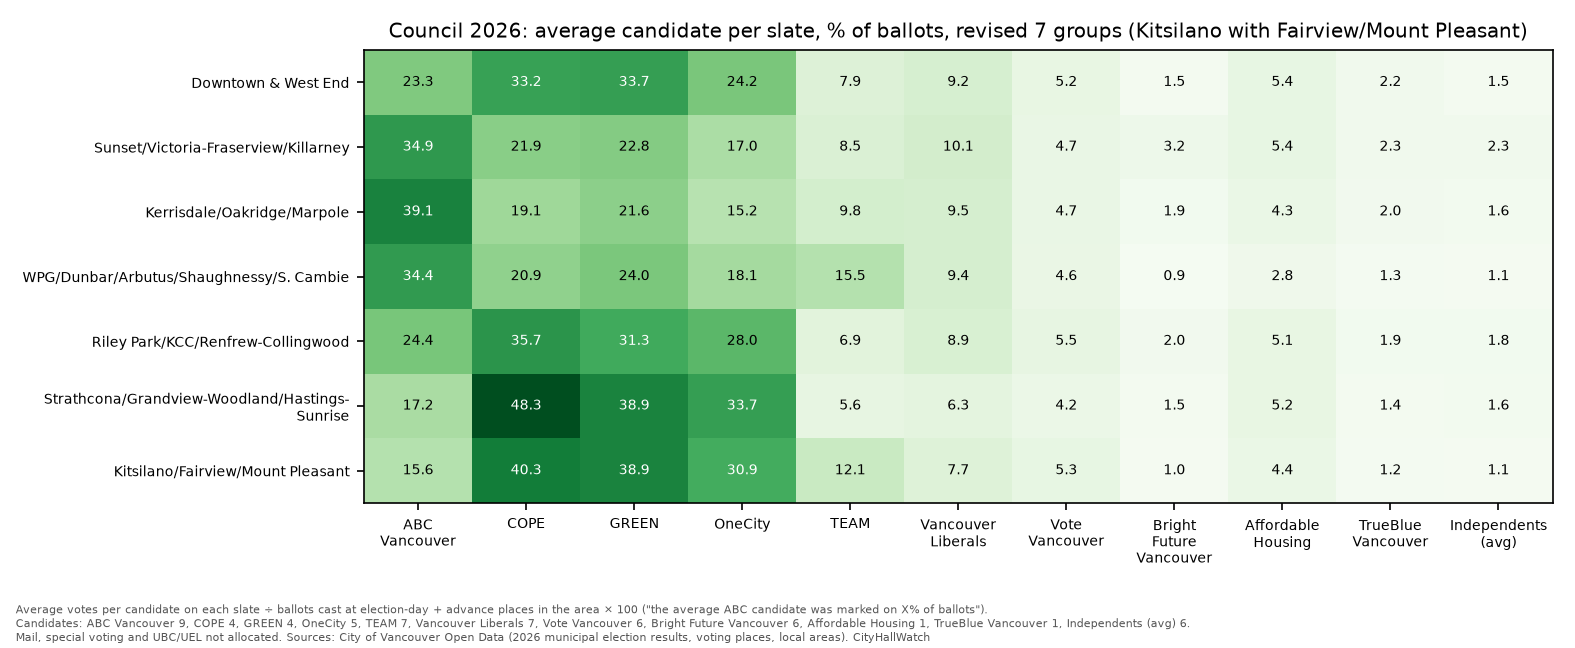
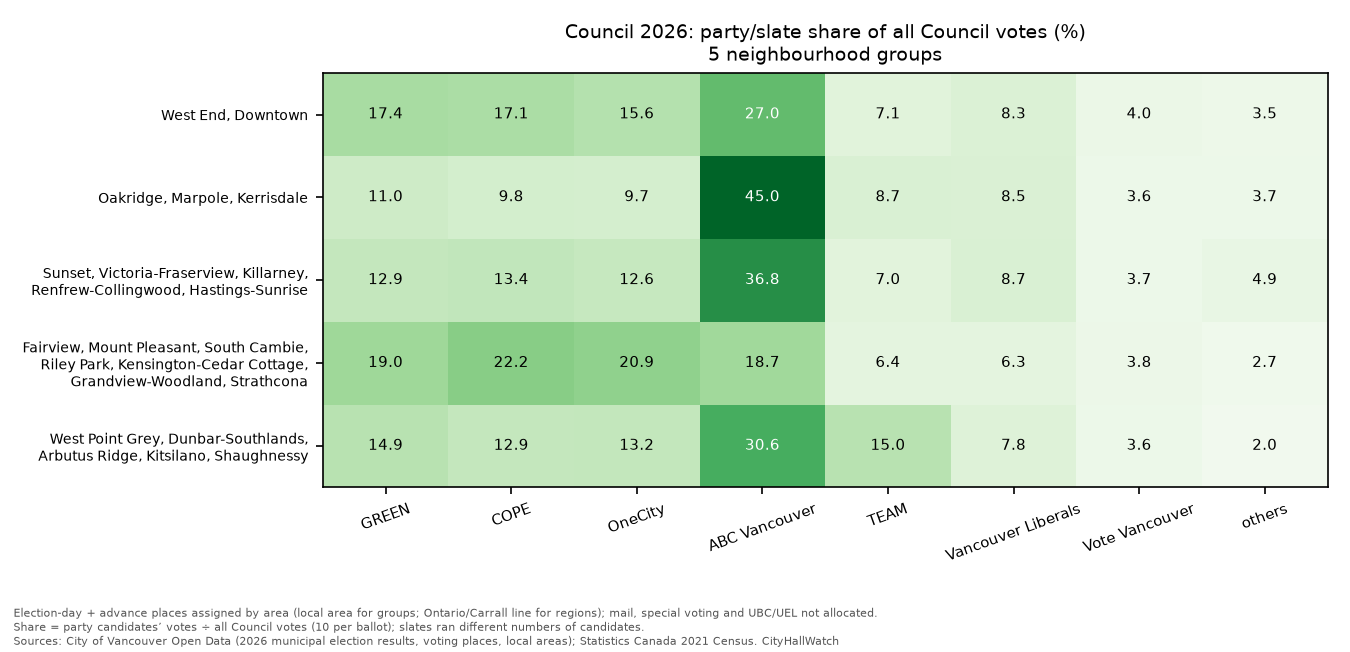
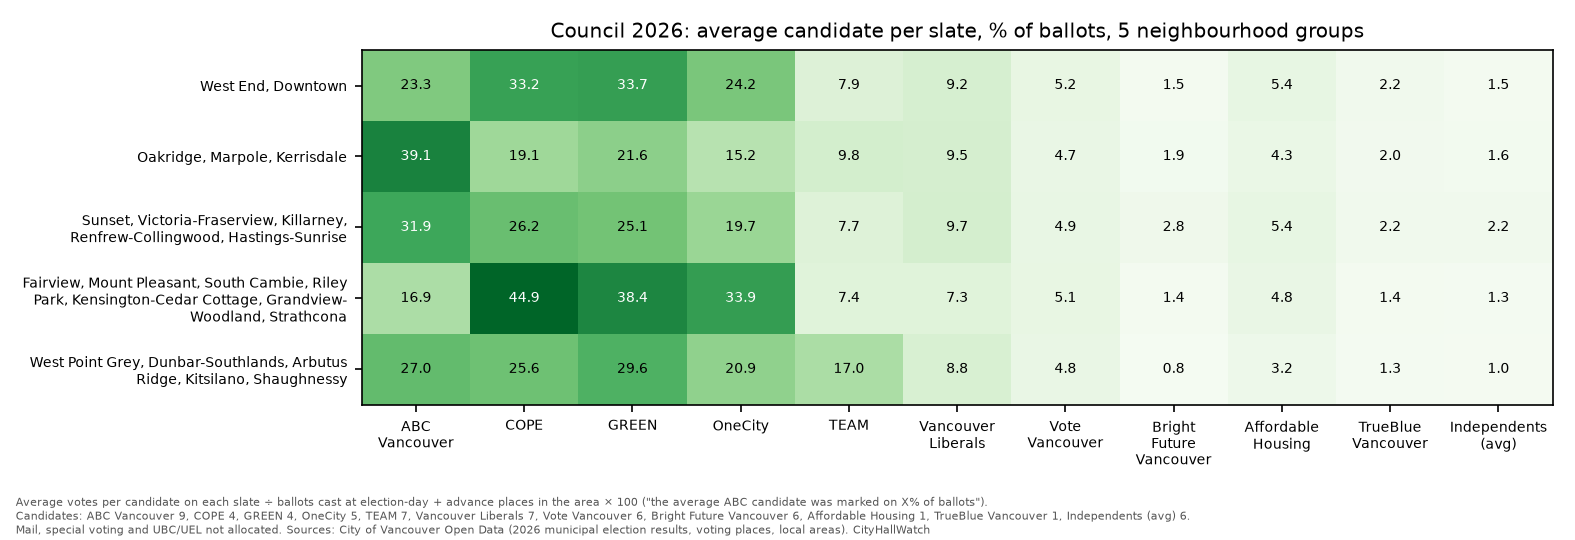
Before diving into the Council results, it is helpful to understand how municipal parties structure their campaigns. In Vancouver, voters can select up to 10 different Council candidates on a single ballot. To maximize their chances, parties run a “slate”—a coordinated group of candidates under a shared banner. Because different slates ran different numbers of candidates in 2026 (ranging from a single candidate for Affordable Housing to nine candidates for ABC Vancouver), simply looking at raw party vote totals is misleading. To provide a fair comparison, the following data adjusts for this by showing the percentage of ballots that marked the average candidate on each slate.
The first chart shows each party’s raw share of all Council votes. Raw shares favour parties that ran more candidates, because each candidate collects votes. The second chart adjusts for that. It takes a slate’s Council votes, divides by the number of candidates it ran, divides by ballots cast in the area, and multiplies by 100. The result is the share of ballots that marked the average candidate on that slate. Candidates per slate: ABC Vancouver 9, COPE 4, GREEN 4, OneCity 5, TEAM 7, Vancouver Liberals 7, Vote Vancouver 6, Bright Future Vancouver 6, Affordable Housing 1, TrueBlue Vancouver 1, and 6 independents, averaged together.
The average COPE candidate was marked on 58.6% of ballots in Grandview-Woodland, compared with 14.5% in Shaughnessy.
The average ABC Vancouver candidate ranged from 10.1% in Grandview-Woodland to 44.4% in Oakridge and Shaughnessy.
GREEN and OneCity follow roughly the same geographic pattern as COPE.
TEAM’s support was concentrated on the Westside: 17.4% in Kitsilano, 18.4% in West Point Grey and 18.3% in Dunbar-Southlands, compared with 3.1% (Strathcona) to 9.1% (Sunset) in the east and south-east.
Bright Future Vancouver’s best area was Sunset (4.2%).
Top Council candidate in each area:
Mike Klassen in most of the south and southwest.
Joyce Gillespie in Renfrew-Collingwood.
Sean Orr in the east and centre.
Annette Reilly in Kitsilano, West Point Grey and Downtown.
Turnout and party strength maps
The maps below go beyond local areas to a finer level. Each block of residents is assigned to its nearest election-day voting place, which gives 85 “catchments”. The results are then smoothed so that patterns show across the city. These maps use election-day ballots only, from places 1–85. Advance, mail, special and UBC/UEL ballots are left out.
Where election-day turnout was highest

The map shows election-day ballots per 100 residents in each catchment. A technical note on method (skip ahead if you only want the results): Each 2021 Census dissemination block is assigned, by its centre point, to the nearest of the 85 election-day voting places, and the result is smoothed with a 700 m Gaussian kernel (smoothed ballots ÷ smoothed population). The lowest values show as a pale tint. The city average is 13.0 (86,469 election-day ballots ÷ ≈663,895 residents). Low-density areas (under about 1,500 residents/km²) and industrial land are faded.
The darkest areas are around Grandview, Hastings-Sunrise, Riley Park, Dunbar and Champlain Heights. The palest are the downtown peninsula, Sunset and Marpole.
Highest catchmentsPer 100Lowest catchmentsPer 100Champlain Heights Community Centre (Killarney)32.4Carnegie Community Centre (Downtown)5.2Mount Pleasant Community Centre26.2Morris J. Wosk Centre for Dialogue (Downtown)5.7Hillcrest Centre (Riley Park)25.4Best Western Premier Chateau Granville Hotel & Suites (Downtown)5.8Dunbar Community Centre23.7École des Colibris (Marpole)5.8
Caveats: this is a proxy, not official turnout (official citywide turnout was 43.39%). Vancouver votes at large and anyone can vote at any place, so catchments are not official voting divisions. The rate uses total population, not eligible voters. Advance, mail, special and UBC/UEL ballots are excluded. The low downtown values may partly reflect heavier advance voting there, but this has not been tested. This applies especially to the hotel and conference-centre polls downtown. The pale edge in the southwest (Musqueam/Southlands) rests on few residents and a distant voting place, so treat it with care.
Where each party was strongest
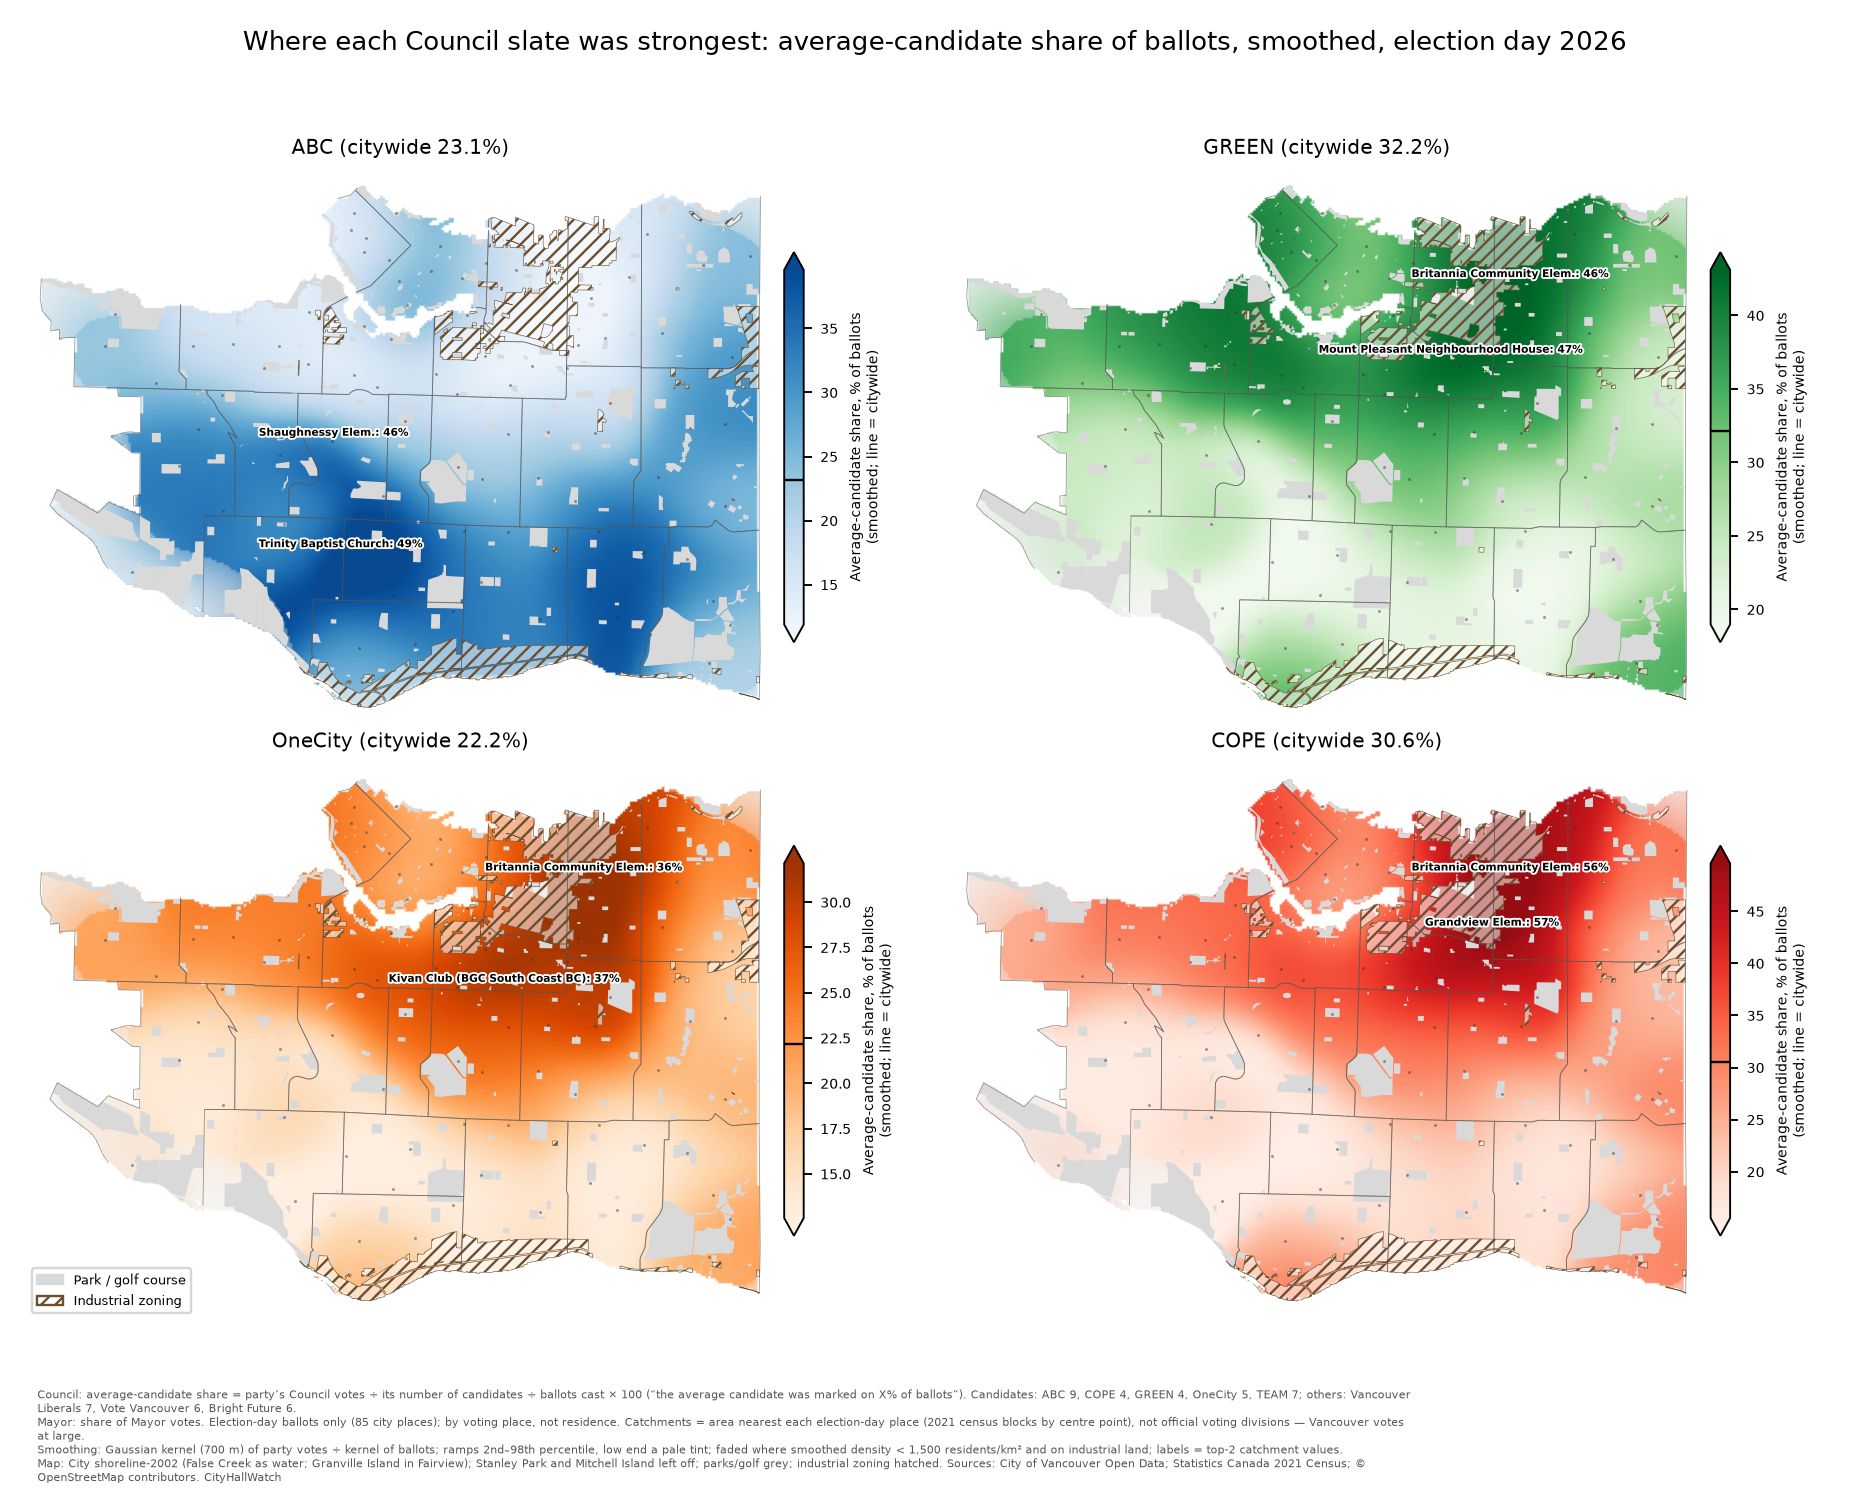
These Council maps use the same average-candidate share as above, on election day only. Each map is coloured on its own scale, from that party’s 2nd to 98th percentile, so a shade on one map can’t be compared with the same shade on another. The legends give the values, and a line on each colour bar marks the citywide value. Citywide on election day, the average candidate on each slate was marked on these shares of ballots: ABC Vancouver 23.1%, COPE 30.6%, GREEN 32.2%, OneCity 22.2%, TEAM 9.3%.
ABC Vancouver: highest at Trinity Baptist Church (Oakridge, 48.6%) and Shaughnessy Elementary School (45.6%), lowest at Britannia Community Elementary School (7.4%).
COPE: highest at Grandview Elementary School (57.2%) and Britannia (56.1%), lowest at Shaughnessy Elementary (8.9%).
GREEN: the widest band of strength across the north of the city, reaching further west than COPE. It peaked at Mount Pleasant Neighbourhood House (46.6%) and Britannia (46.4%).
OneCity: highest at Kivan Club (BGC South Coast BC) (37.4%) and Britannia (35.8%).
Slates that won no Council seats
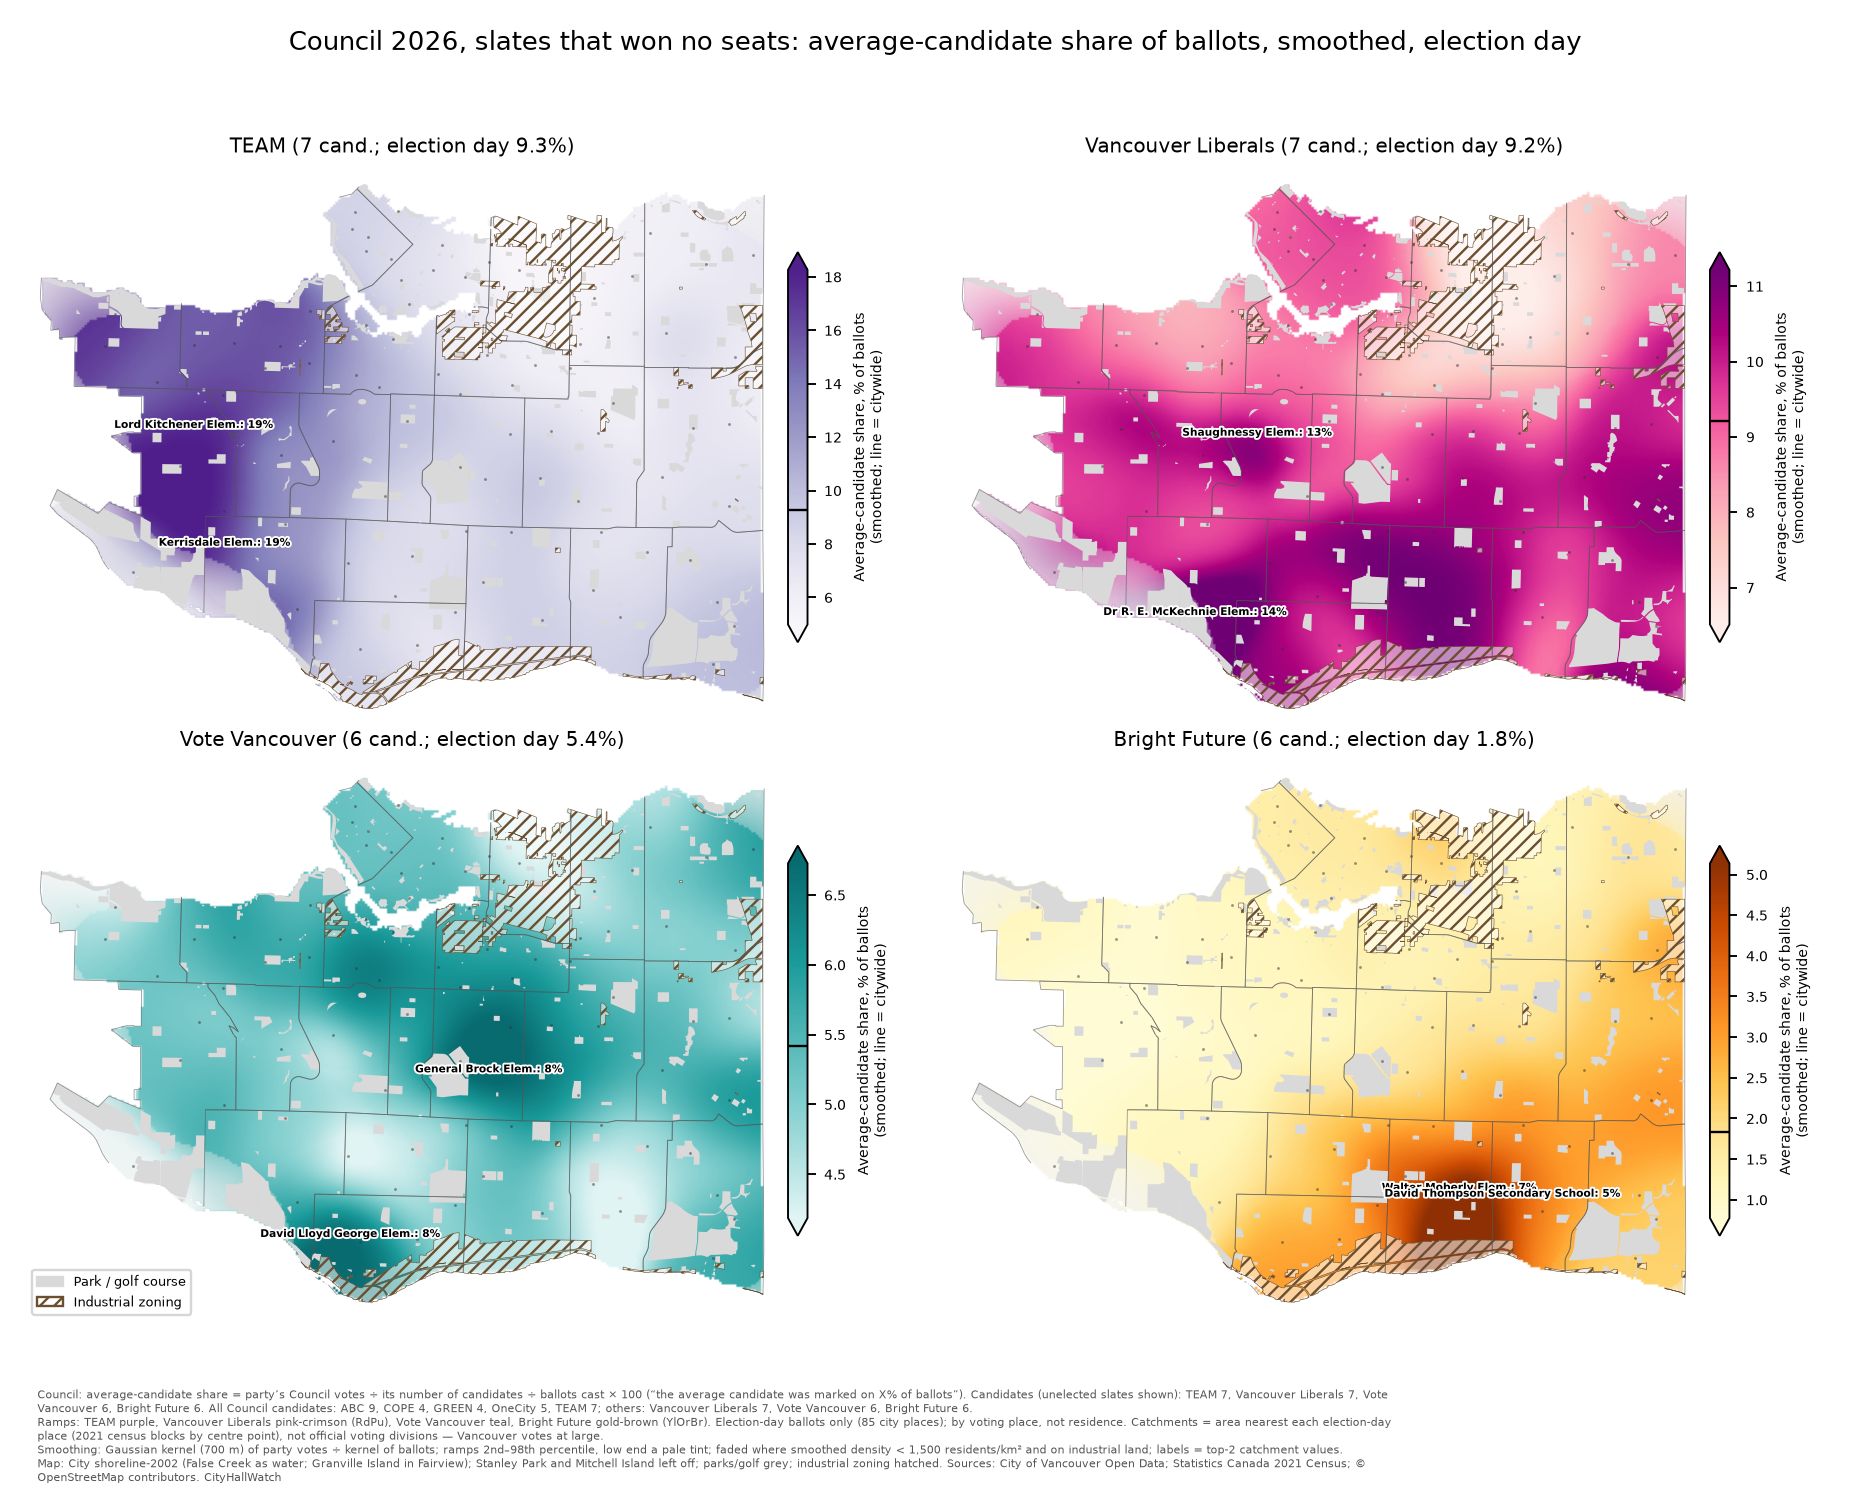
These maps use the same measure for the four slates that won no Council seats. Citywide on election day, the average candidate on each slate was marked on these shares of ballots:
TEAM: 9.3%. Highest at Kerrisdale Elementary School (19.2%), Dunbar Community Centre (18.7%) and Lord Kitchener Elementary School (18.7%).
Vancouver Liberals: 9.2%. Highest around Kerrisdale, Shaughnessy and Oakridge: at Dr R. E. McKechnie Elementary School (13.5%), Shaughnessy Elementary School (13.1%) and Dr Annie B. Jamieson Elementary School (11.7%).
Vote Vancouver: 5.4%. Highest in Riley Park, Marpole and Mount Pleasant: at General Brock Elementary School (8.1%), David Lloyd George Elementary School (7.6%) and Kivan Club (BGC South Coast BC) (7.5%).
Bright Future Vancouver: 1.8%. Highest in Sunset and Victoria-Fraserview: at Walter Moberly Elementary School (6.7%), David Thompson Secondary School (4.7%) and Sunset Community Centre (4.6%).
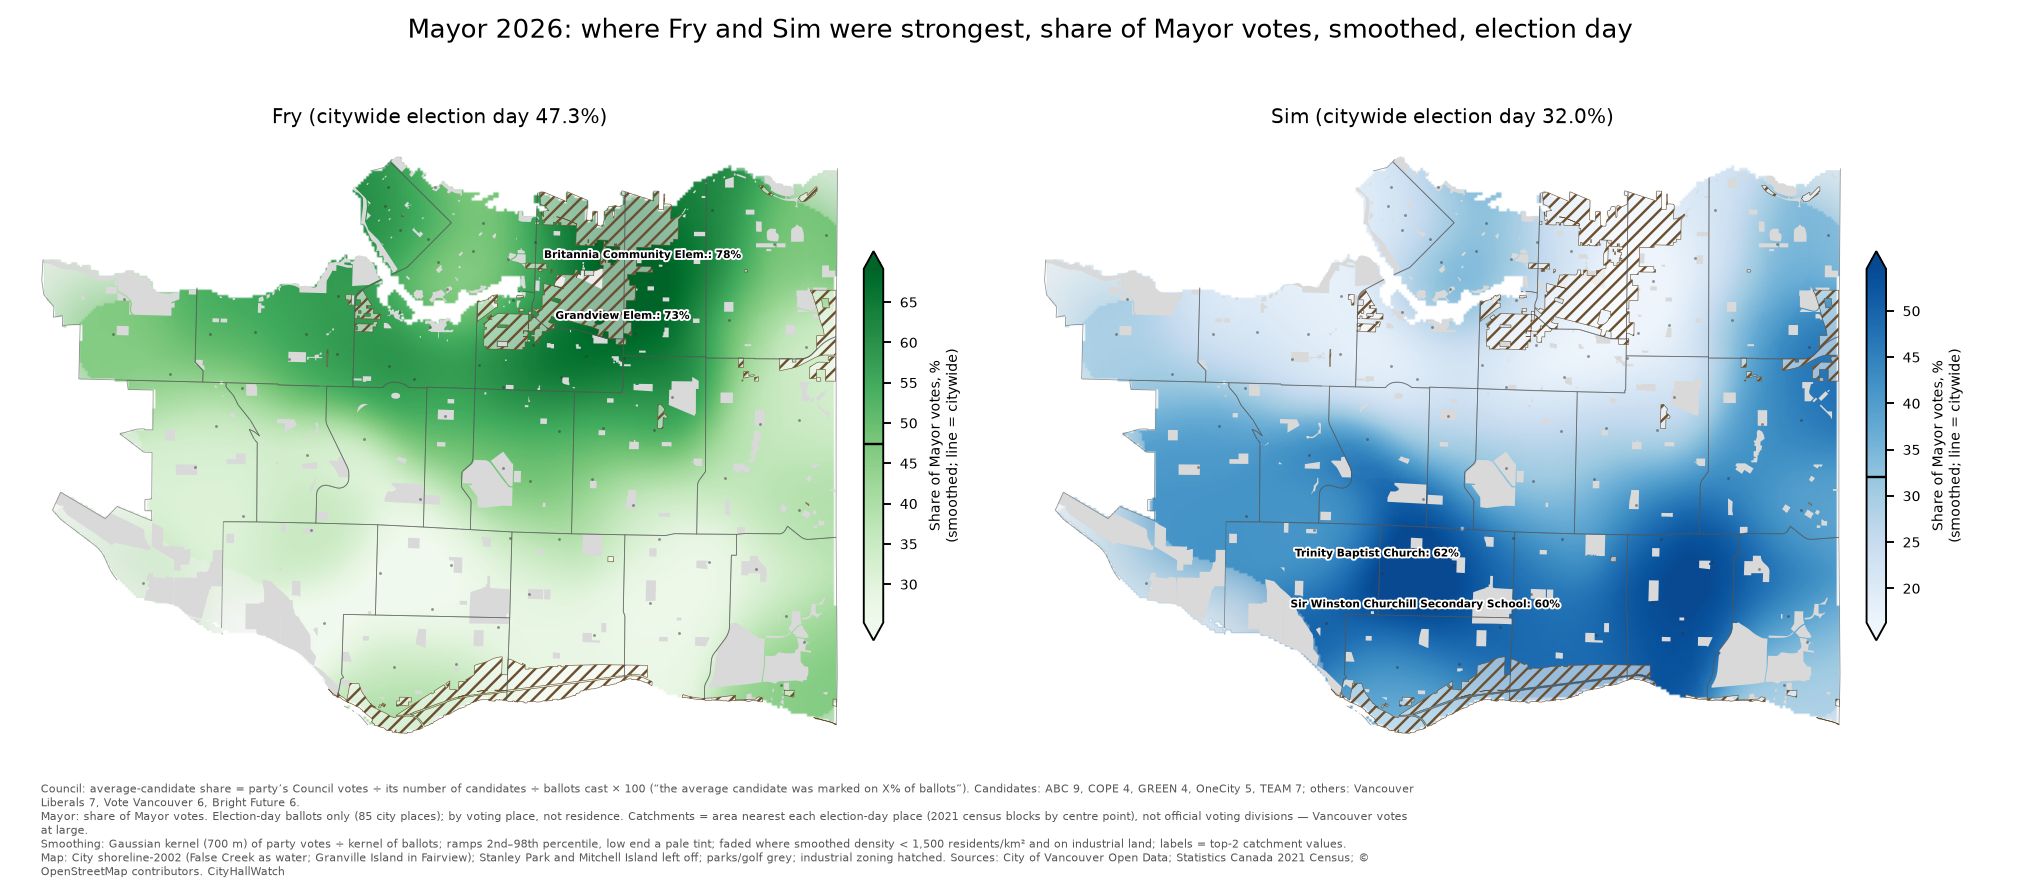
For Mayor, the maps show each candidate’s share of election-day Mayor votes. Citywide on election day, Fry had 47.3% and Sim 32.0%, a little different from their shares of all ballots (47.8% and 32.7%). Pete Fry was strongest at Britannia (77.5%) and Grandview Elementary (73.1%). Ken Sim was strongest at Trinity Baptist Church (61.5%), Sir Winston Churchill Secondary School (60.1%) and Waverley Elementary School (58.6%).
Park Board and School Trustee slate strength comparison
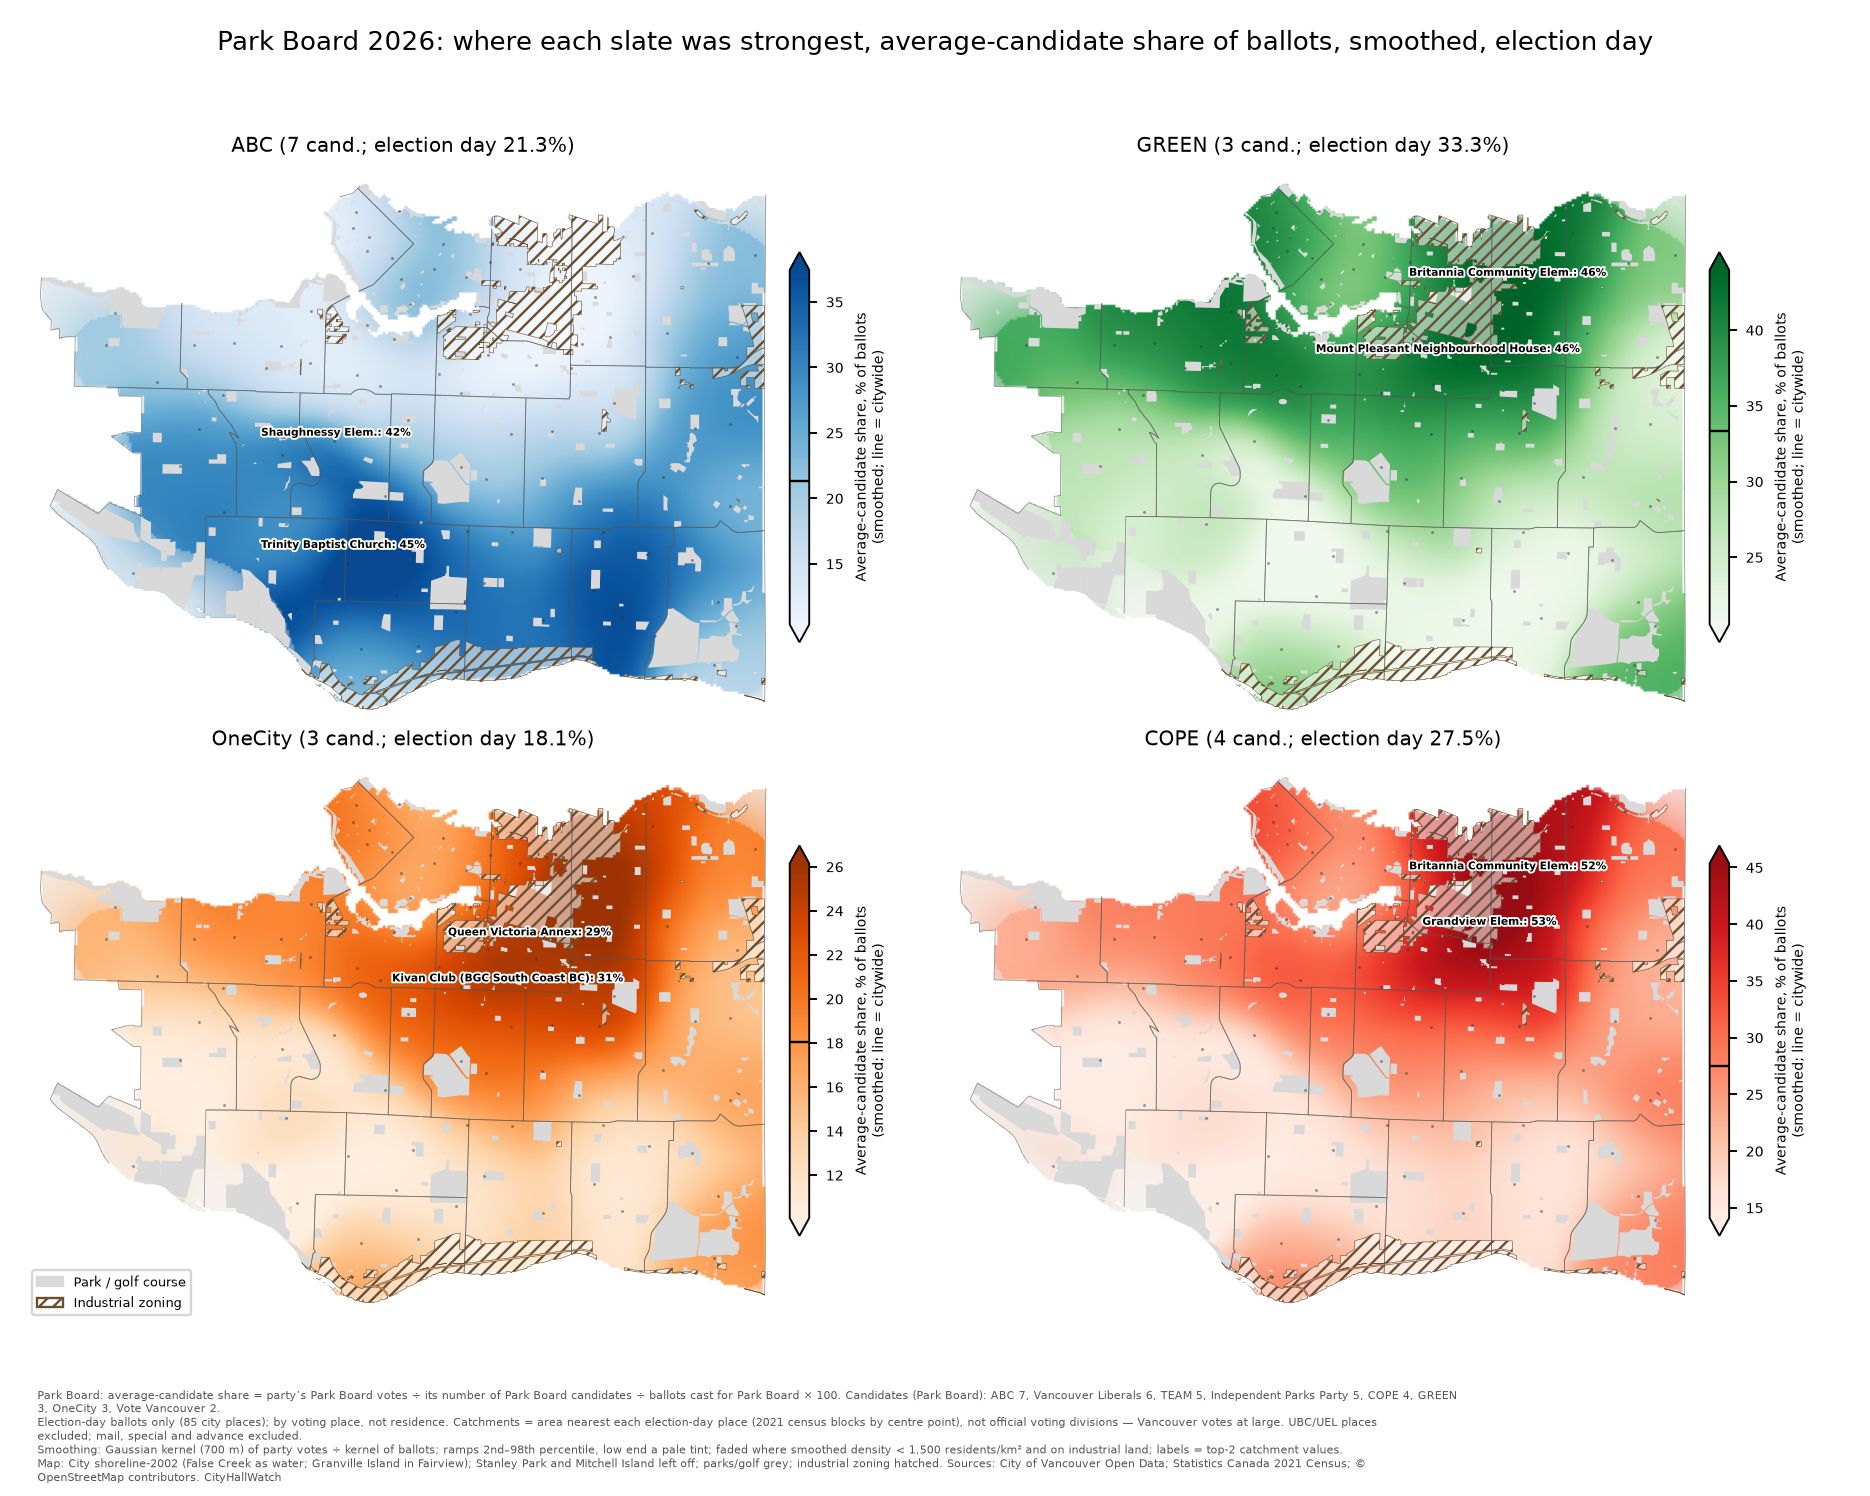
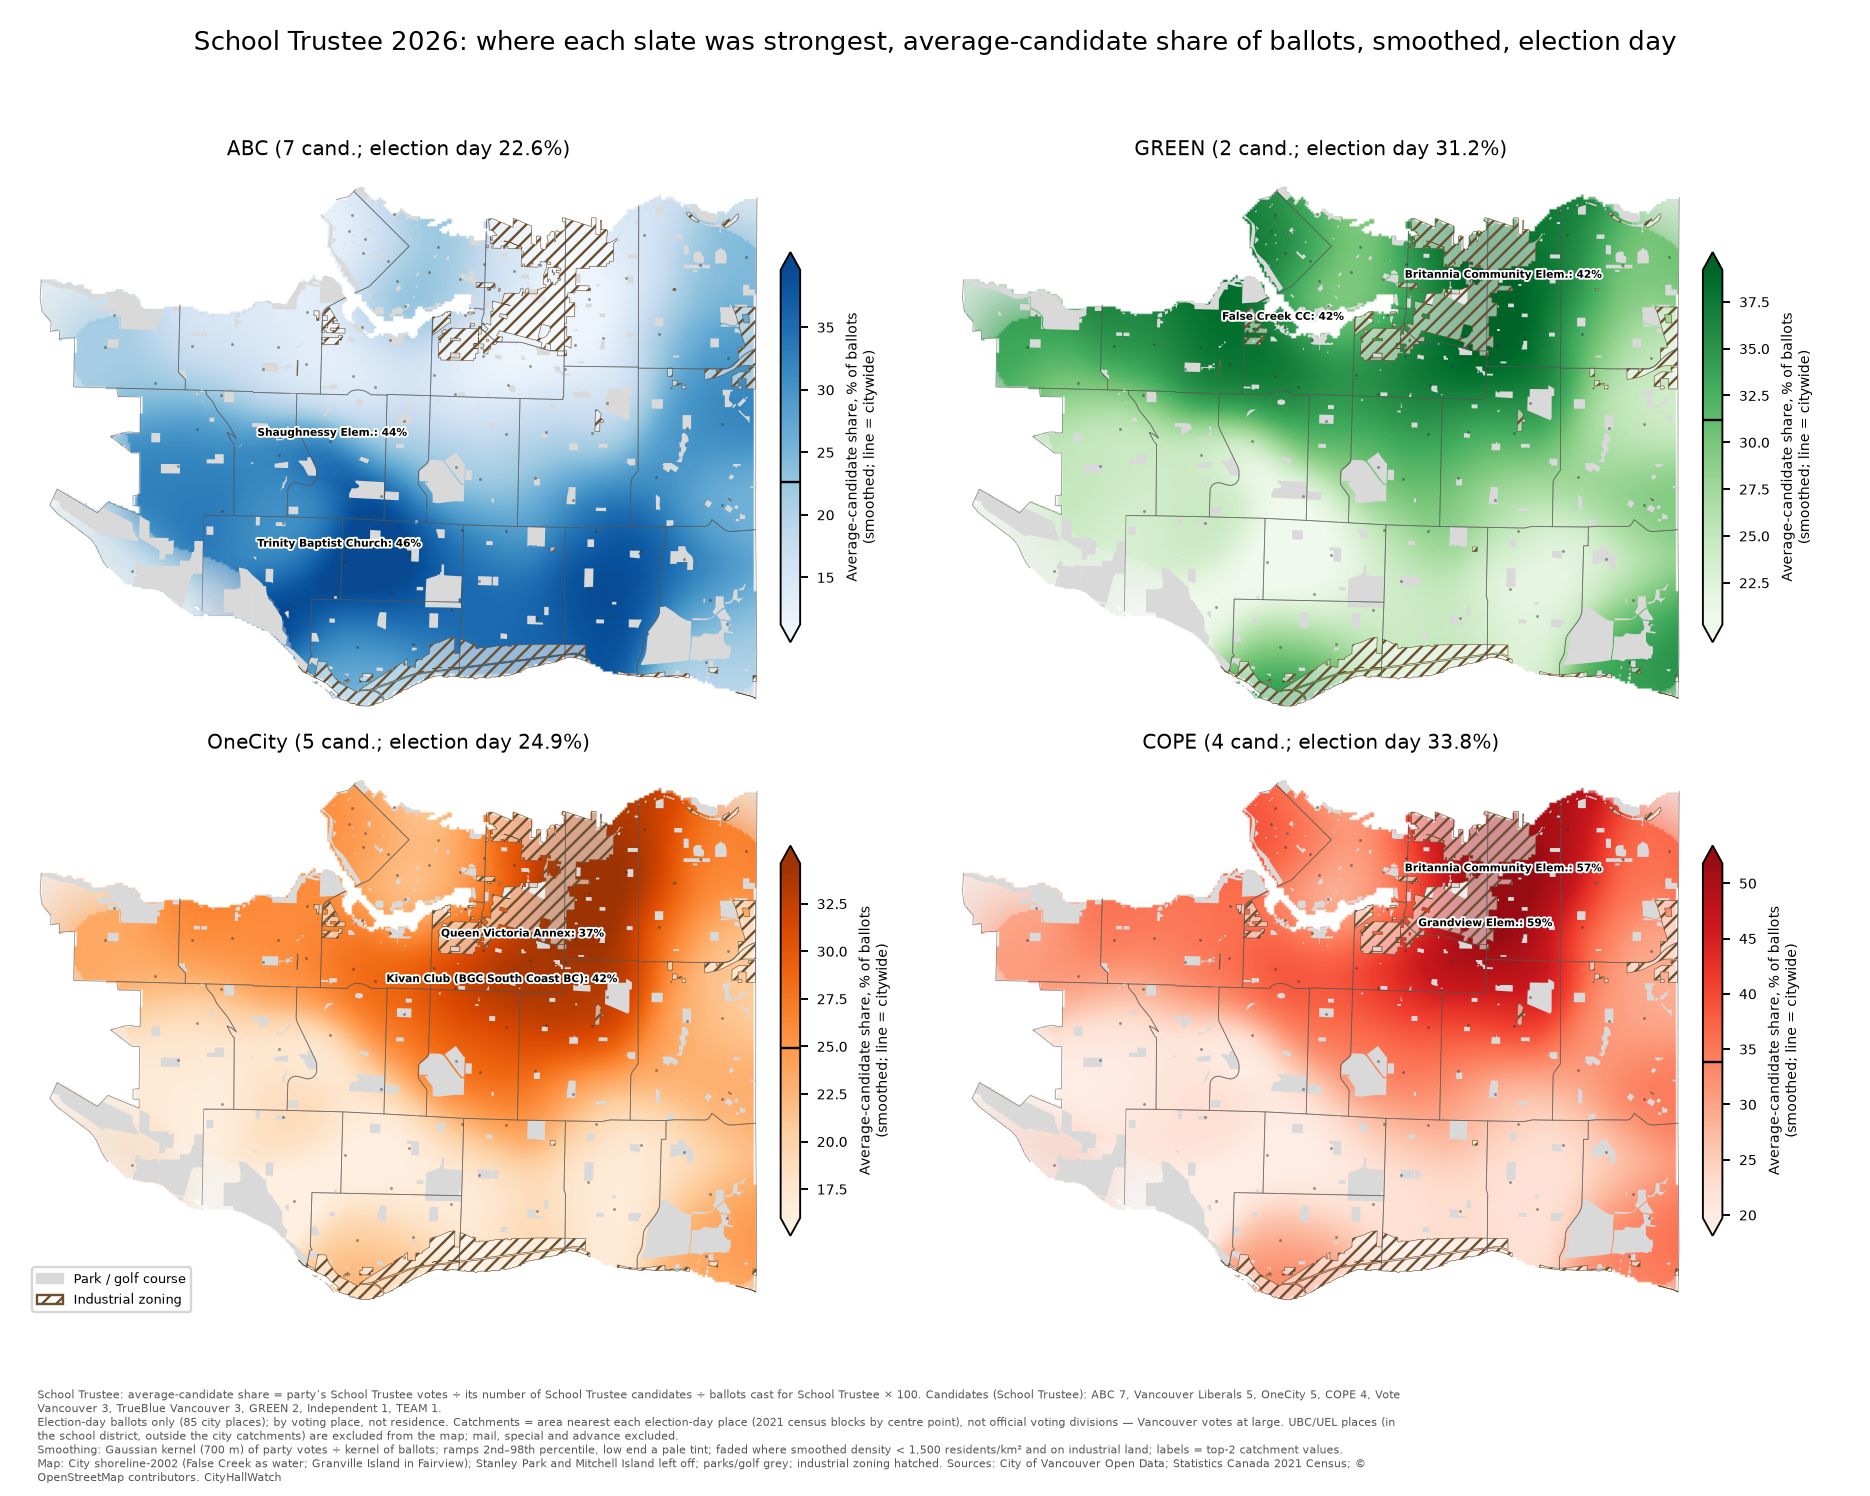
These maps use the same measure as the Council maps: average-candidate share, election-day ballots only, smoothed. Each map again has its own colour scale. Candidates run (Park Board / School Trustee): ABC Vancouver 7/7, COPE 4/4, GREEN 3/2, OneCity 3/5.
Citywide, election dayPark BoardSchool TrusteeABC Vancouver21.3%22.6%GREEN33.3%31.2%OneCity18.1%24.9%COPE27.5%33.8%
Each party was strong in the same places as in the Council race. For each party, the correlation between its Council and its Park Board or School Trustee share across the 85 catchments ranges from 0.975 to 0.997. What changes between races is the level of support, not where it is. Compared with Council, averaged across catchments:
School Trustee: COPE was about 3 points higher and OneCity about 3 points higher.
Park Board: OneCity was about 4 points lower, COPE about 3 points lower, and GREEN about 1 point higher.
ABC Vancouver: highest at Trinity Baptist Church (Oakridge): Park Board 45.1%, Trustee 46.4%. Shaughnessy Elementary School was next in both races (42.4% / 44.3%).
COPE: highest at Grandview Elementary School (53.2% / 59.4%), then Britannia Community Elementary School (51.7% / 56.9%).
OneCity: highest at Kivan Club (BGC South Coast BC) (31.0% / 41.7%).
GREEN: for Park Board, highest at Mount Pleasant Neighbourhood House (46.4%) and Britannia (46.0%). For Trustee, Britannia (41.6%) and False Creek Community Centre (41.5%) were essentially tied.
The UBC/UEL School Trustee ballots are not on the maps. There were 938 (UBC AMS Student Nest and University Hill Secondary on election day, plus advance voting at the Nest), and they leaned left: the average candidate’s share was COPE 51.3%, OneCity 41.7%, GREEN 36.5% and ABC Vancouver 18.0%. UBC/UEL voters vote only for School Trustee.
Note on UBC/UEL ballots: UBC/UEL voters receive a ballot for School Trustee only. In total, 1,197 UBC/UEL ballots were cast (City overview, “Ballots Cast (UBC Lands and UEL)”), out of 9,199 registered voters, a turnout of about 13.0%. Of these, 938 were cast at UBC voting places (Nest on election day 238, Nest advance voting 211, University Hill Secondary 489), 147 at advance voting places in the city, 79 by mail and 33 by special voting. The party shares above use only the 938 ballots cast at the UBC places. We worked out the split by subtracting the Mayor ballot count from the School Trustee ballot count at each place. The Mayor count totals 208,514, which matches the City’s figure for ballots cast in Vancouver proper.
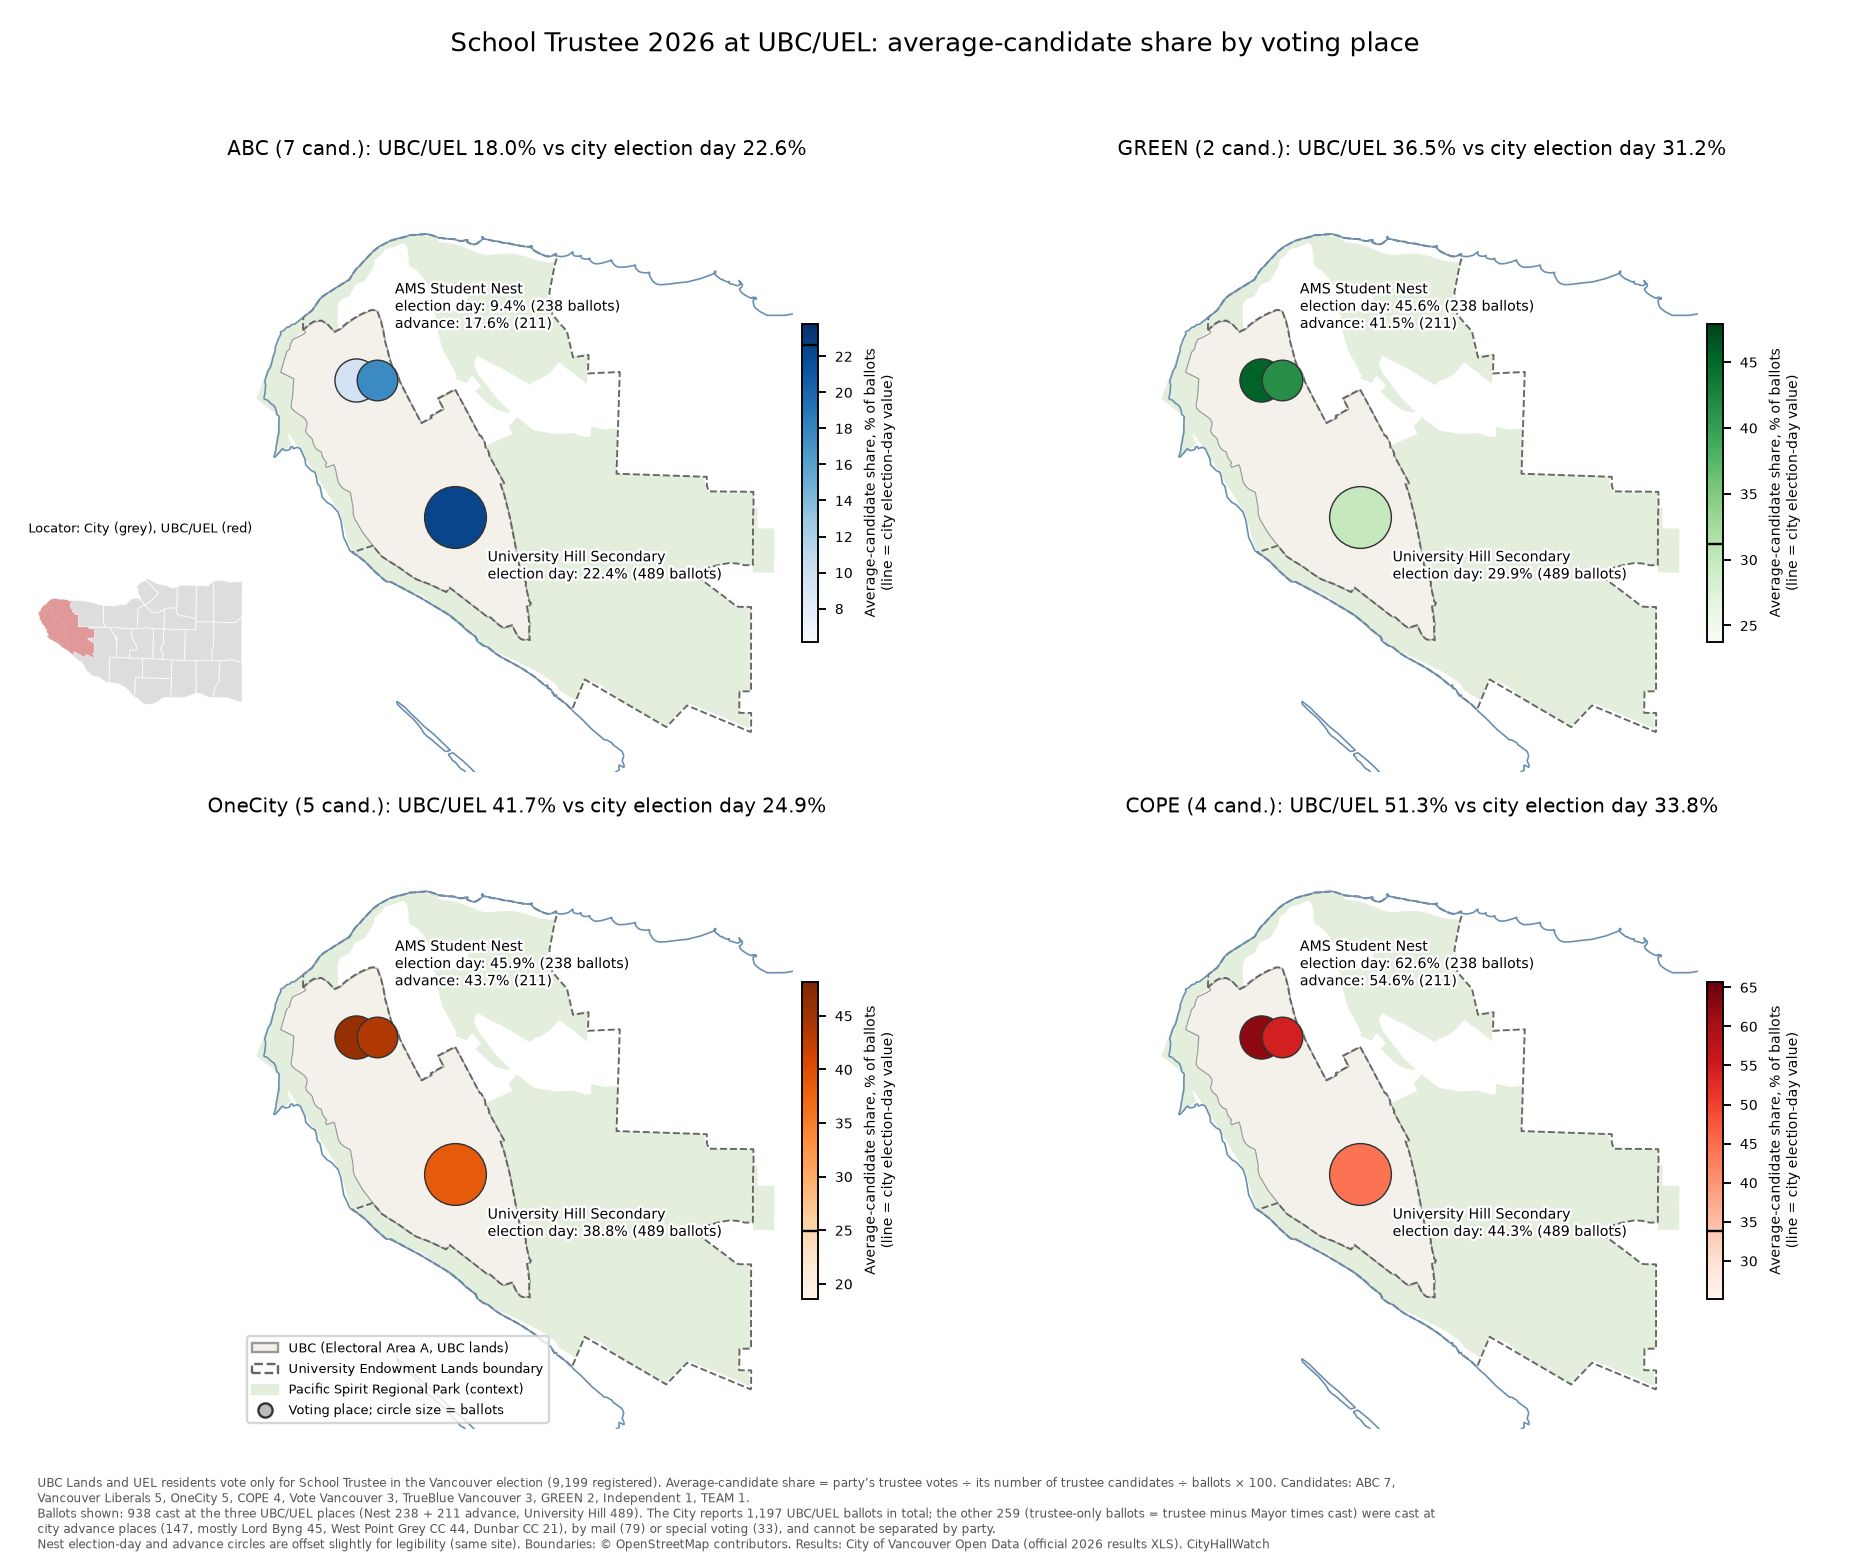
At the UBC voting places (938 ballots; circles on the map are sized by ballots), the average candidate’s share was as follows, with the citywide election-day share in brackets: COPE 51.3% (33.8%), OneCity 41.7% (24.9%), GREEN 36.5% (31.2%), ABC Vancouver 18.0% (22.6%). The UBC AMS Student Nest on election day was the most left-leaning of the three UBC places: ABC Vancouver 9.4%, COPE 62.6%.
Map notes: Council maps show average-candidate share. Election-day ballots only. Results are by voting place, not voter residence. Catchments are areas nearest each voting place, not official divisions. Election-day places 1–85 only; advance, mail, special and UBC/UEL ballots are excluded. Low-population (under about 1,500 residents/km²) and industrial areas are faded. Each colour scale runs from its own 2nd to 98th percentile, so compare shades within a map, not across maps. UBC/UEL boundaries © OpenStreetMap contributors.
Grouping the neighbourhoods
The 22 local areas can be grouped in several ways. The next three sections group them into seven areas, five blocs and three regions, moving from the finest grouping to the broadest.
Looking at the city as seven areas (“main grouping”)
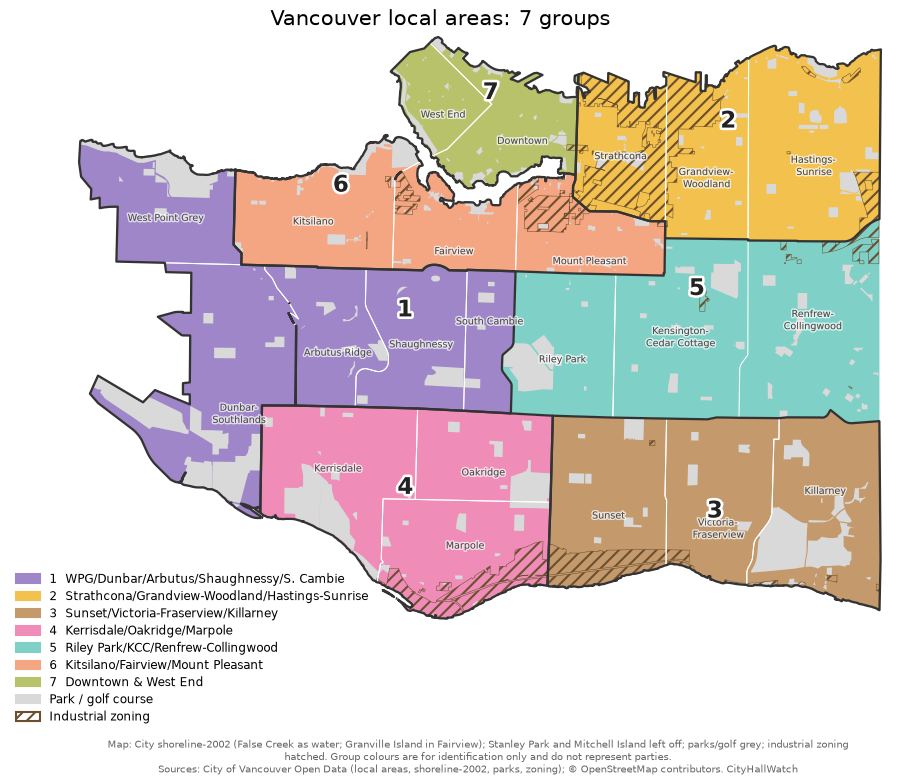
To clarify the citywide voting patterns without getting bogged down in the noise of 85 individual polling stations, this analysis clusters adjacent neighbourhoods into larger geographic blocs. The “main grouping” is the grouping that best fits the mayoral results of the groupings we tried. By dividing the city into seven specifically combined regions, this framework highlights the underlying geographic trends that drove the election results much more clearly than the raw poll-by-poll data.
For the main grouping, we used seven groups of neighbourhoods, with Kitsilano placed with Fairview and Mount Pleasant. These seven groups account for about 58% of the variation in the Fry–Sim margin between election-day voting places. The five groups account for about 47%, and the three regions about 1%. These fits are descriptive only: they come from one election and 85 places, and more groups always explain more of the variation.

Kitsilano, Fairview, Mount Pleasant (pop. ≈115,687): Fry 59.3%, Sim 19.5%. This group had the highest rate of 36.4 ballots per 100 residents. Sean Orr got the most Council votes here.
West Point Grey, Dunbar-Southlands, Arbutus Ridge, Shaughnessy, South Cambie (pop. ≈68,455): Sim 41.8%, Fry 34.6%, Colleen Hardwick (TEAM) 14.2%. The rate was 31.4 ballots per 100 residents.
Kerrisdale, Oakridge, Marpole: Sim 51.1%, and ABC Vancouver took 45.0% of Council votes, its best of any group.
Sunset, Victoria-Fraserview, Killarney: Sim 49.1%, and ABC Vancouver took 40.5% of Council votes.
Strathcona, Grandview-Woodland, Hastings-Sunrise: Fry 63.1%, and Sean Orr topped the Council list (55.9%).
The city in five groups
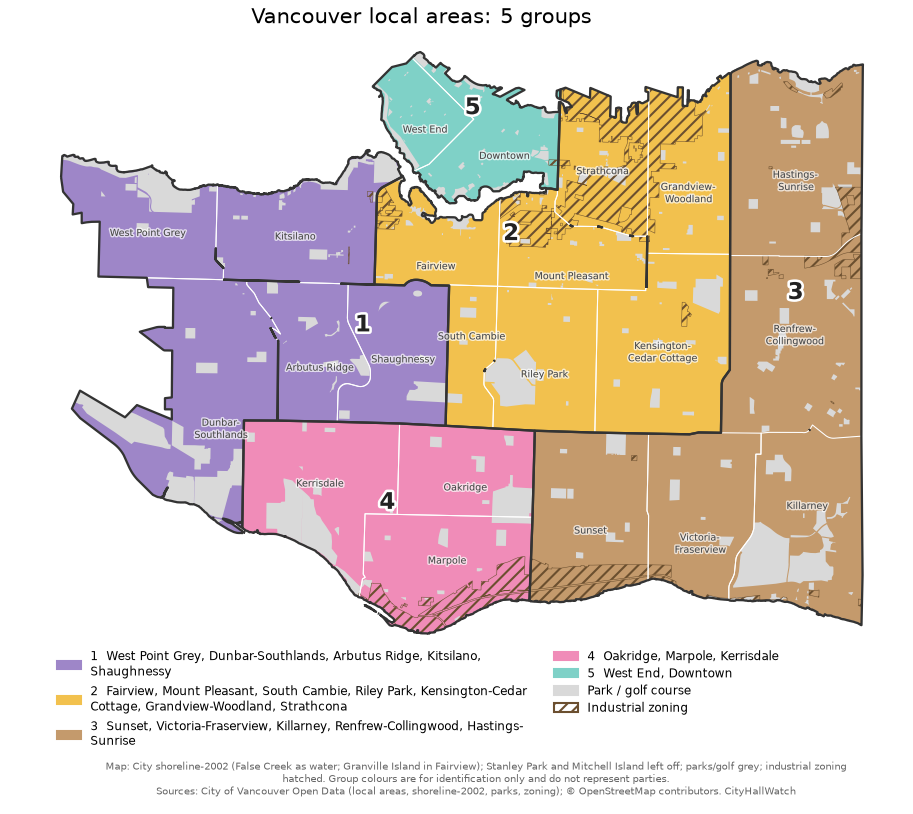
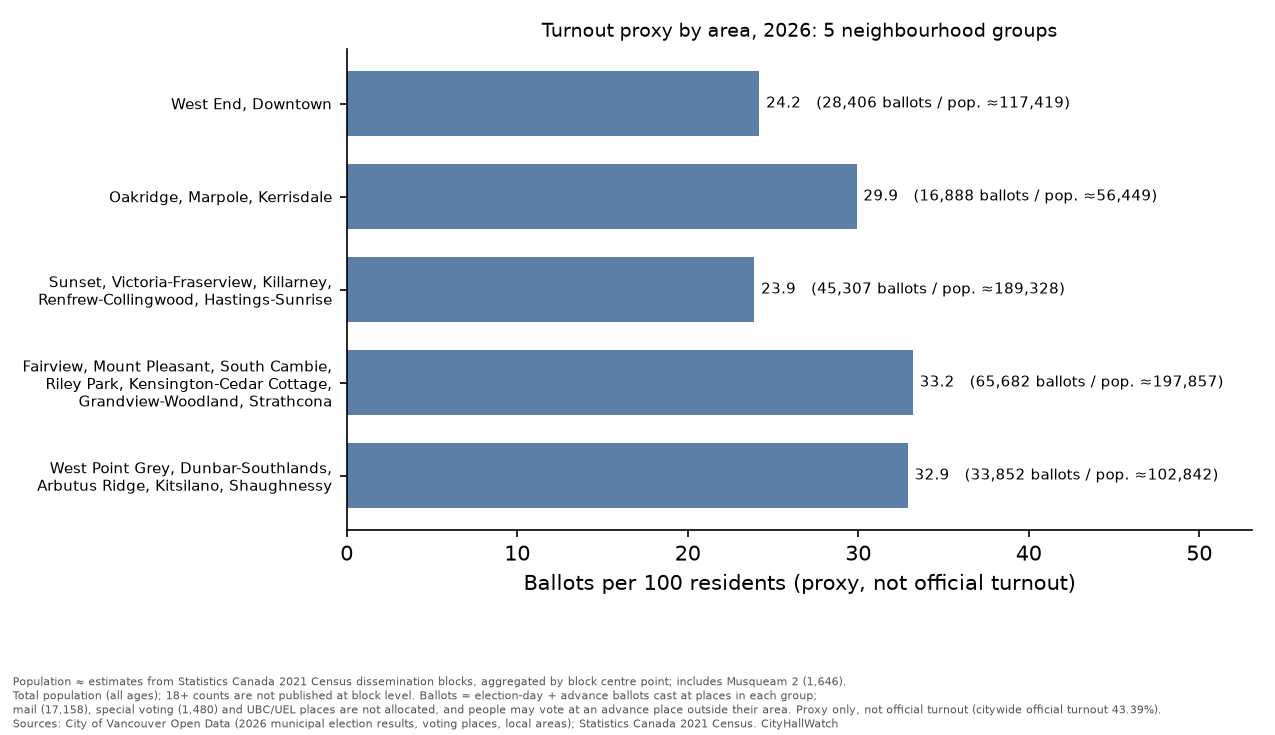
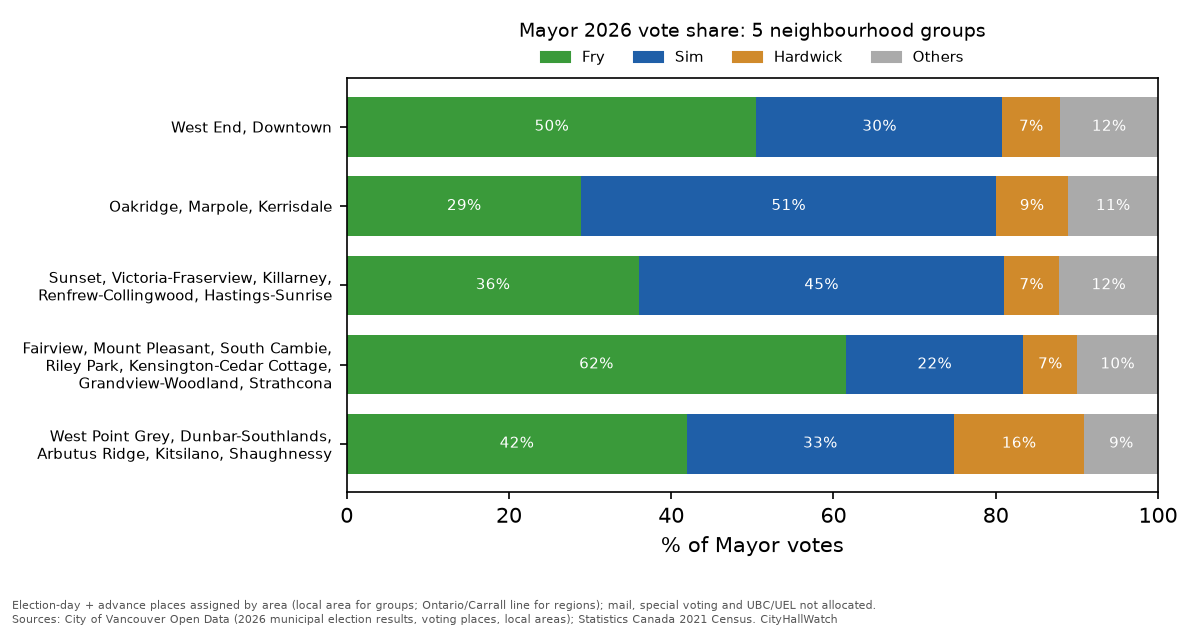
If dividing the city into seven regions feels too granular, grouping the neighbourhoods into five larger groups paints the same political picture with broader strokes. This five-group model confirms the core narrative: a progressive core dominated by Fry and a southern base firmly backing Sim. The pattern is still visible at this level, but it largely disappears when the city is cut into just three regions, as shown below.
Using five larger groups gives the same picture. Fry won 61.5% in the Fairview / Mount Pleasant / South Cambie / Riley Park / Kensington-Cedar Cottage / Grandview-Woodland / Strathcona group, where the average COPE candidate was marked on 44.9% of ballots. Sim won 51.1% in Oakridge / Marpole / Kerrisdale, where the average ABC Vancouver candidate was marked on 39.1%. In the West Point Grey / Dunbar / Arbutus / Kitsilano / Shaughnessy group, Fry had 41.9%, Sim 32.9% and Colleen Hardwick 16.1%. TEAM’s average candidate reached 17.0% there, its best of the five groups.
East, West and Downtown + West End: a three-region view
RegionBallots per 100 residentsFrySimDowntown + West End24.750.1%30.6%Westside34.143.7%34.1%East Vancouver26.349.8%33.2%

Finally, pulling back to the highest level, the analysis divides the city into its traditional three-way split: East Vancouver, the Westside, and the Downtown/West End core. While this macro view is geographically familiar, the data reveals that this historical East-West divide is actually less relevant to the 2026 election outcome than the sharper North-South split seen in the more granular models.
Fry led Sim in all three regions, by about 10 to 20 points. In this election, the regions differ in turnout and geography more than in how they voted. The sharper divide is between the northeast and the south and southwest.
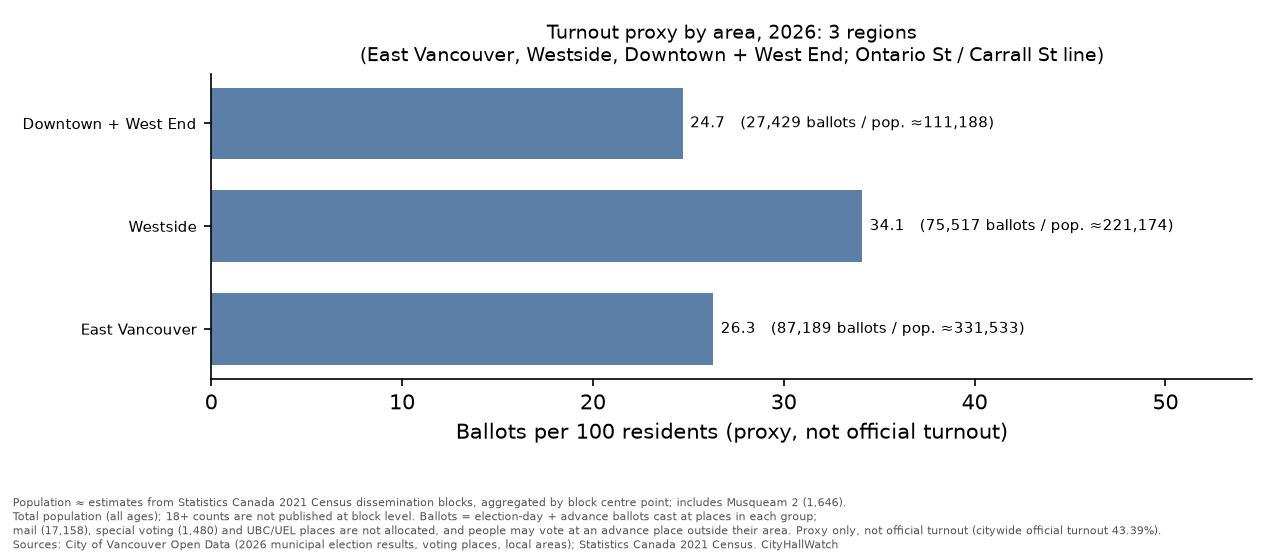
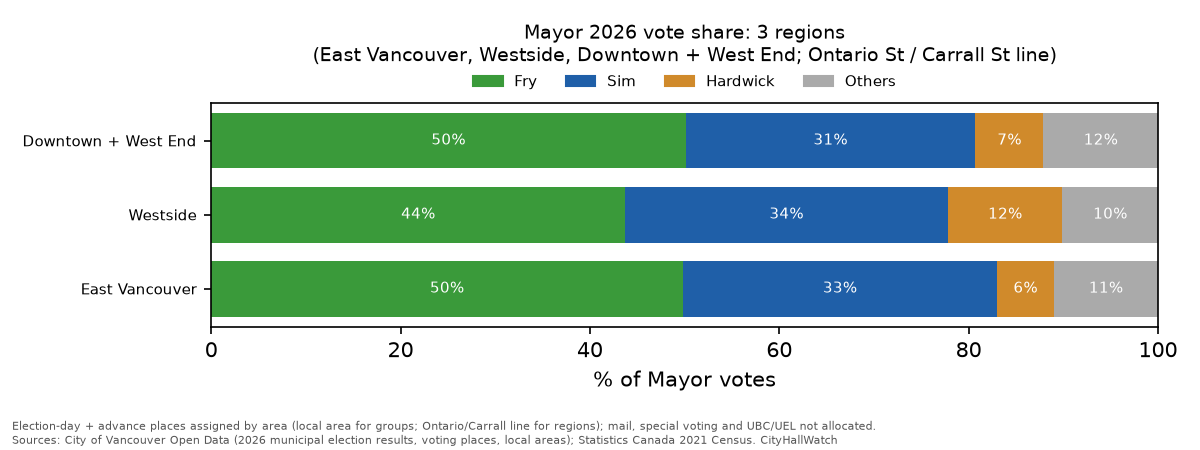
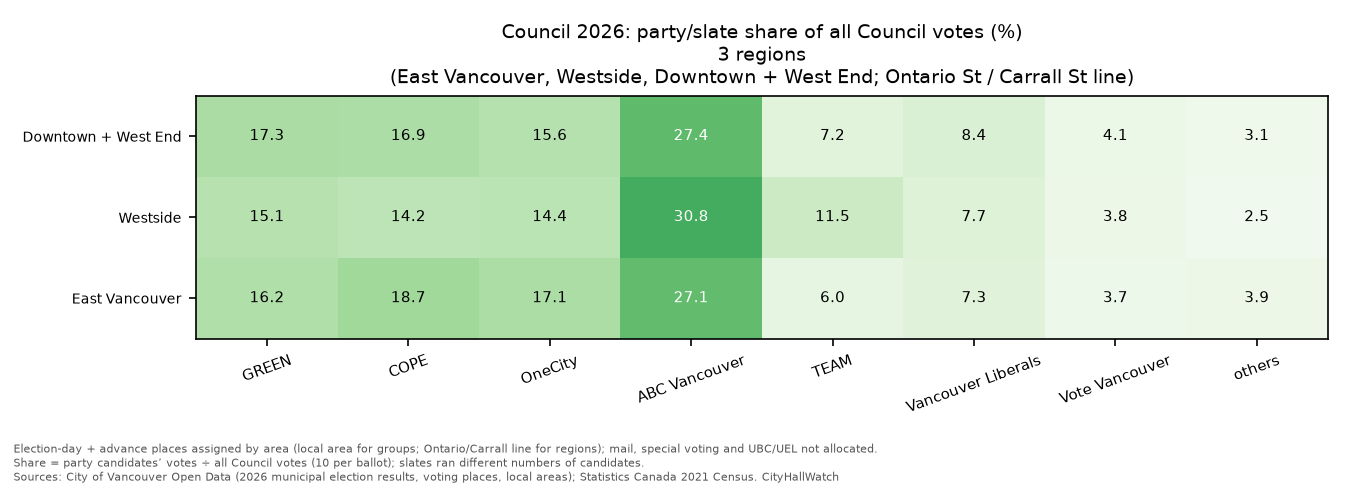
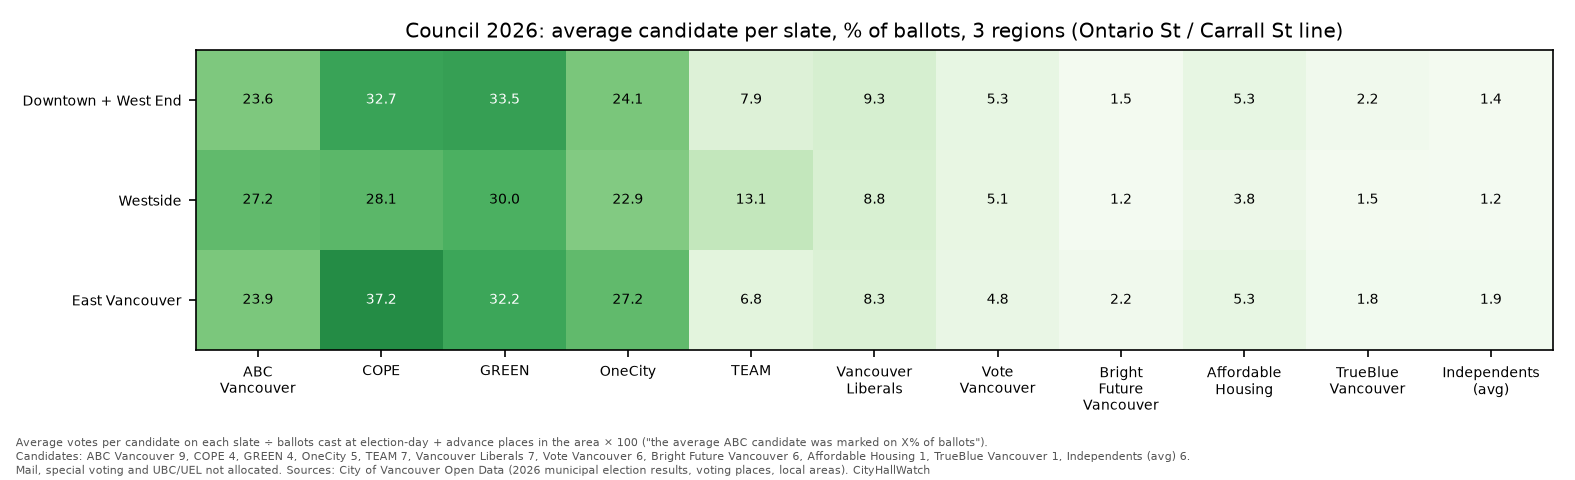
On the per-candidate measure, the three regions also look alike: the average ABC Vancouver candidate drew 23.6% to 27.2%, COPE 28.1% to 37.2%, and GREEN 30.0% to 33.5%.
Which Council slate won each neighbourhood (local area)
The map shows which Council slate came first in each of the 22 neighbourhoods (local areas). It uses the average-candidate share described above: a slate’s Council votes, divided by the number of candidates it ran, divided by ballots cast. Darker shading means a bigger lead (capped at 20 points). It counts election-day and advance places, each placed in an area by its official address.
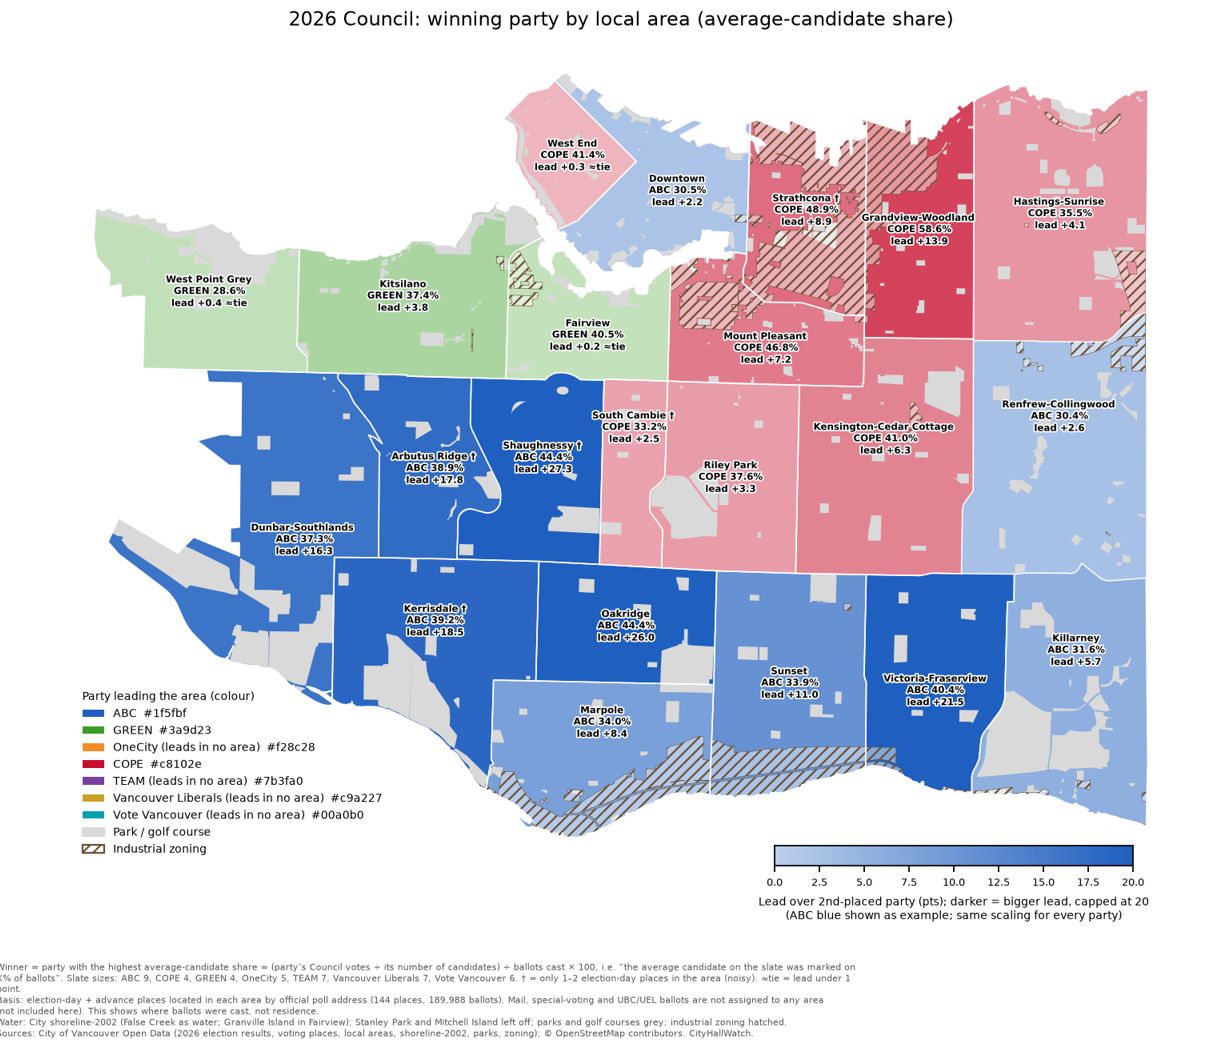
ABC Vancouver led in 11 areas: Oakridge, Shaughnessy, Victoria-Fraserview, Kerrisdale, Arbutus Ridge, Dunbar-Southlands, Sunset, Marpole, Killarney, Renfrew-Collingwood and Downtown.
COPE led in 8: Grandview-Woodland, Mount Pleasant, West End, Strathcona, Kensington-Cedar Cottage, Riley Park, South Cambie and Hastings-Sunrise.
GREEN led in 3: Fairview, Kitsilano and West Point Grey.
No other slate led anywhere.
ABC’s biggest leads were in Shaughnessy (44.4% to GREEN’s 17.1%, +27.3 points) and Oakridge (+26.0). The biggest lead for any other slate was COPE’s in Grandview-Woodland, 58.6% to GREEN’s 44.7% (+13.9). Three areas were effectively ties, with leads under one point: West End (COPE 41.4%, GREEN 41.1%), Fairview (GREEN 40.5%, COPE 40.3%) and West Point Grey (GREEN 28.6%, ABC 28.2%).
The Council map lines up closely with the Mayor result. Sim won 10 areas, and ABC led Council in all 10. Fry won 12: COPE led Council in 8 of them and GREEN in 3. Downtown is the one area where the two races went different ways. Fry won Mayor there by 3.1 points, while ABC led Council, 30.5% to GREEN’s 28.3%.
The measure matters here. Raw shares of all Council votes favour slates that ran more candidates. On the plain share, ABC would lead 17 areas, COPE 4 (Grandview-Woodland, Mount Pleasant, West End and Strathcona) and GREEN 1 (Fairview).
Where each slate was strongest
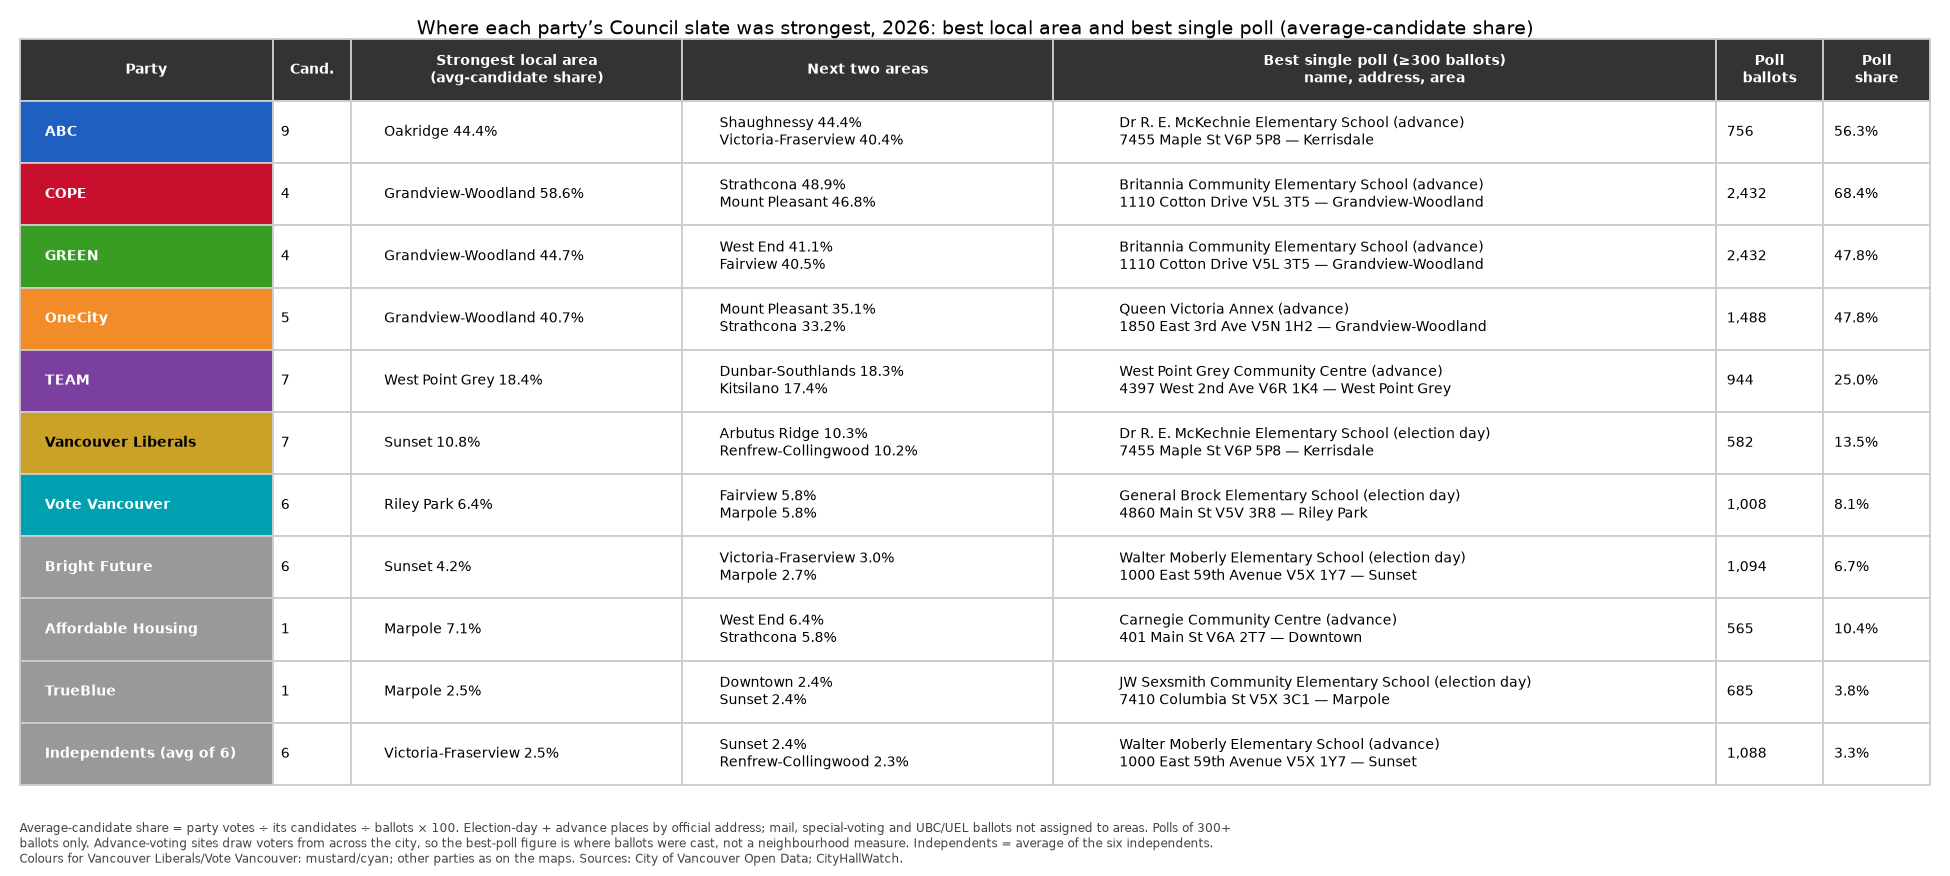
By average-candidate share, ABC was strongest in Oakridge (44.43%, with Shaughnessy a close second at 44.40%). COPE, GREEN and OneCity were all strongest in Grandview-Woodland (58.6%, 44.7% and 40.7%). TEAM was strongest in West Point Grey (18.4%), the Vancouver Liberals in Sunset (10.8%) and Vote Vancouver in Riley Park (6.4%).
Among polls with 300 or more ballots, the best single results came mostly at advance sites: COPE 68.4% and GREEN 47.8% at Britannia Community Elementary, ABC 56.3% at Dr R. E. McKechnie Elementary, OneCity 47.8% at Queen Victoria Annex and TEAM 25.0% at West Point Grey Community Centre. The Vancouver Liberals (13.5%, McKechnie Elementary) and Vote Vancouver (8.1%, General Brock Elementary) did best at election-day places.
Some cautions: Strathcona, South Cambie, Arbutus Ridge, Kerrisdale and Shaughnessy (marked † on the map) have only one or two election-day places, so their margins lean on advance sites. Advance sites draw voters from across the city, so best-poll figures show where ballots were cast, not how a neighbourhood voted. Mail, special-voting and UBC/UEL ballots are not assigned to any area, and the map shows where ballots were cast, not where voters live.
Notes and caveats
“Ballots per 100 residents” is a rough measure, not official turnout. The data has no registered-voter counts by voting place. The measure uses total population, not just those 18 and over who are eligible to vote (Canadian citizens). It also leaves out mail ballots, special voting, and advance votes cast outside a voter’s own area.
Poll-by-poll tidbits: the Mayor and Council races at 85 election-day and 59 advance places. UBC, mail and special ballots are excluded.
Results are reported by voting place, not by where voters live. Area figures count only election-day and advance ballots. Mail, special voting and UBC/UEL ballots are not assigned to any area, and some people voted at advance places outside their own area.
Local areas with only one or two election-day places (South Cambie; Arbutus Ridge, Kerrisdale, Shaughnessy, Strathcona) give noisy results.
These results come from one election and 85 election-day places, so they describe 2026 only.
Population ≈ estimates from Statistics Canada 2021 Census dissemination blocks, aggregated by block centre point; includes Musqueam 2 (1,646). Census figure for City of Vancouver CSD: 662,248.
Population is total population (all ages), because 18+ counts are not published at block level.
All population figures in this post come from the same ≈663,895 block total: 662,248 for the City of Vancouver plus Musqueam 2 (1,646), give or take one person from rounding. The area groups, the 22 local areas and the catchments each add up to that total.
Part 2 of this analysis looks at the public safety plebiscite and Capital Plan borrowing questions, how many Council votes people left blank, which Council slates moved together from poll to poll, and how many Park Board and School Trustee votes were left blank. It also compares blank ballot slots in 2018, 2022 and 2026.
Sources