
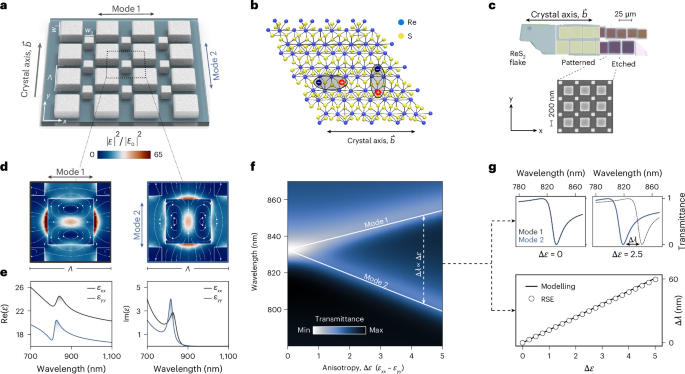
Anisotropy lifts mode degeneracy
We first study a dielectric metasurface composed of square nanoresonators with side length w0, arranged in a C4-symmetric square array on a silicon dioxide (SiO2) substrate. Given this symmetry, the structure supports a non-radiative, doubly degenerate mode at the Γ point, provided that the constituent medium is isotropic.
To introduce asymmetry, thereby accessing radiative channels of the modes while preserving the overall C4-symmetric shape, we define a perturbation parameter α, and express the side lengths of the new prisms as (Fig. 1a):
$${w}_{1}={w}_{0}{\left(\dfrac{2}{1+{\alpha }^{2}}\right)}^{1/2},\quad {w}_{2}={w}_{0}{\left(\dfrac{2}{1+{\alpha }^{2}}\right)}^{1/2}\alpha ,$$
where the in-plane footprint remains constant, whereas the unit cell increases in size by a factor of \(\sqrt{2}\), leading to Brillouin-zone folding. As a result, the dark degenerate modes at the original Γ point are transformed into two radiative qBICs (Brillouin-zone-folding qBICs43), which we denote as mode 1 and mode 2. Note that C4-symmetry here refers to the shape of the resonator lattice: once the resonators are fabricated from ReS2, the anisotropic permittivity tensor reduces the overall symmetry of the full system to C2. Spectral tunability of the qBICs is enabled by applying an in-plane scaling factor S to the structure. The electric field profiles of both modes are shown in Fig. 1d. Both field distributions exhibit the same spatial shape, rotated by 90°, as expected from the orthogonal polarizations of the excitation.
Fig. 1: Material-anisotropy-induced qBIC degeneracy lifting.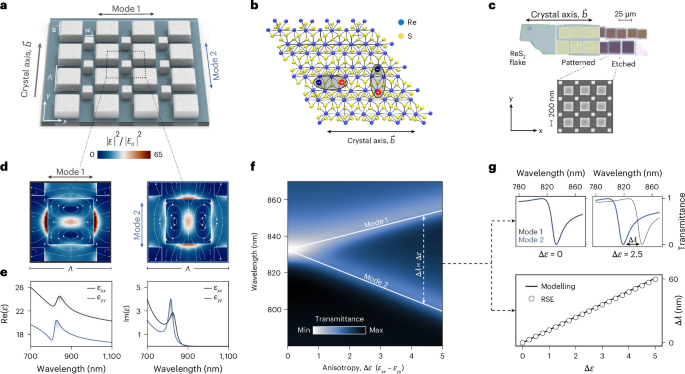
a, ReS2 metasurface unit-cell design with periodicity Λ = 465 nm, base side length w0 = 220 nm, α = 0.6 and resonator height h = 90 nm. b, Schematic of the crystal structure of ReS2; each monolayer consists of a central plane of rhenium atoms positioned between two layers of sulfur atoms. The rhenium atoms are coordinated in a distorted trigonal antiprismatic geometry, forming strong covalent bonds with the surrounding sulfur atoms9. c, Optical microscopy image of an exfoliated ReS2 flake. The orientation of the crystal axes is identified from the flake geometry, providing guidance for the alignment of the metasurfaces (shown in the scanning electron microscopy image) with respect to the in-plane anisotropy. d, Simulated electric field enhancement for mode 1 (left) and mode 2 (right), evaluated at the middle cut of the resonators. E0 is the excitation wave amplitude. e, In-plane components of the real and imaginary parts of permittivity ε adapted to experiments (Supplementary Note 1). f, Simulated transmittance for both mode 1 and mode 2, showing the splitting of the qBICs as a function of dielectric anisotropy Δε = εxx − εyy. g, Simulated transmittance spectra for selected values of Δε, illustrating the increasing spectral separation of the modes with anisotropy. Comparison between modelling and RSE of the spectral splitting Δλ ∝ Δε.
The controlled alignment of the metasurface coordinate system (x, y) with the ReS2 crystal axis b, which defines the principal crystallographic direction (Fig. 1b and Methods), establishes a direct correspondence between the metasurface geometry and the intrinsic optical axes of the material (Fig. 1c). As a result, polarization-selective excitation along these orthogonal directions probes the distinct spectral responses of the anisotropic permittivity tensor components εxx and εyy (Fig. 1e), thereby enabling anisotropy-induced splitting of the degenerate modes. We account for the in-plane optical anisotropy of ReS2 by first using a simplified non-dispersive material model that captures this splitting and neglecting (for now) excitonic contributions:
$${\varepsilon }_{xx}=\varepsilon +\dfrac{\Delta \varepsilon }{2},\,\,{\varepsilon }_{yy}=\varepsilon -\dfrac{\Delta \varepsilon }{2}.$$
(1)
This simple model isolates the purely photonic behaviour of the metasurface before exciton coupling is included through Lorentzian poles (Supplementary Note 1). We assume ε = 18, Δε = εxx − εyy ≈ 1.7 (equivalent to Δn ≈ 0.2) and constant out-of-plane component εzz = 7.25. For Δε = 0, the structure supports a doubly degenerate qBIC; as Δε becomes non-zero, the degeneracy of the modes lifts, with mode 1 redshifting and mode 2 blueshifting (Fig. 1f).
To further study this splitting mechanism, we apply RSE, treating the in-plane anisotropy Δε as a perturbation, which yields a pair of hybrid eigenfrequencies:
$${\omega}_{\pm}\approx {\omega}_{0}[1\pm {\varkappa} \Delta \varepsilon ]$$
(2)
where ϰ is a constant factor calculated through overlap integrals between the modes and ω0 is the eigenfrequency of the initial degenerate eigenstates (Supplementary Note 2). The perturbative result obtained via RSE closely matches the full numerical simulations (Fig. 1g). Therefore, the anisotropy-induced spectral mode splitting \(\Delta \lambda =2\uppi c({\omega}_{-}^{-1}-{\omega }_{+}^{-1})\approx 4\uppi c{\omega}_{0}^{-1}{\varkappa} \Delta \varepsilon\) scales linearly with Δε (Fig. 1g).
Fractional topological charges in momentum space
Starting in the isotropic case (Δn = 0), we trace the evolution of mode 1 and mode 2 in k space with k0 defined as a free-space wavenumber (Fig. 2a). Although mode 1 exhibits an isotropic parabolic dispersion centred at the Γ point (that is kx = ky = 0), mode 2 remains nearly flat along the high-symmetry directions (kx = 0 and ky = 0), bending slightly along the diagonals. In the isotropic case, the metasurface supports a mode degeneracy at the Γ point, which is lifted when moving to non-zero kx and ky values (Fig. 2b). The far-field polarization vector fields (Fig. 2c) reveal integer winding numbers of −1 centred at the Γ point for both modes, indicating the presence of polarization vortices with an integer topological charge. Unlike true BICs, which exhibit vanishing far-field polarization at the Γ point, the degenerate qBICs retain undetermined far-field polarizations at the Γ point.
Fig. 2: Anisotropy-induced modal topological transformation.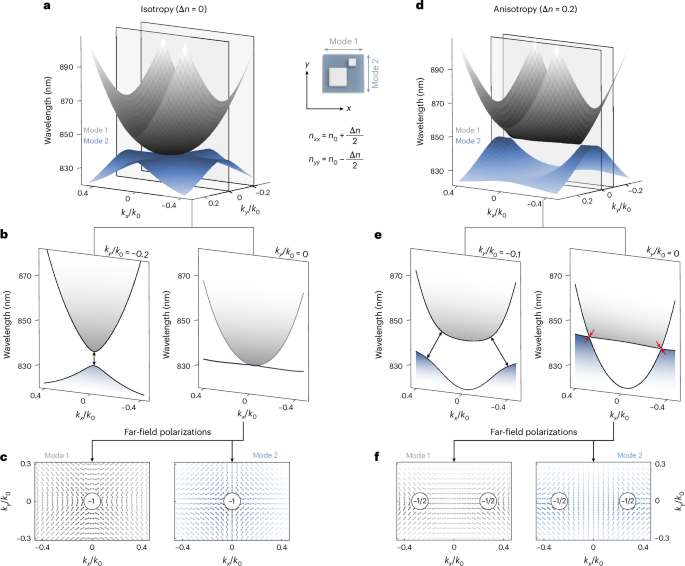
a, Simulated band structure of mode 1 (grey) and mode 2 (blue) in k space for the isotropic case (Δn = 0). b, Band-structure cuts at constant ky. c, Far-field polarization maps, showing topological charges of −1 at the Γ point. d, Simulated band structure for the anisotropic case (Δn = 0.2). e, Corresponding ky cuts, showing the location of the Dirac points by red arrows (points at which the modes touch). f, Far-field polarization maps show the splitting of the topological charge into two half-charges (−1/2), symmetrically displaced along the kx axis. The metasurface with a period of Λ = 535 nm, base side length w0 = 250 nm, α = 0.6 and resonator height h = 70 nm was placed in a vacuum to eliminate any parasitic diffraction associated with the substrate and to facilitate the qBIC tracking in momentum space. Its parameters were slightly adjusted so that the qBIC wavelength of 835 nm at Δn = 0 lies near the two exciton resonances of ReS2. All simulations were performed using the non-dispersive, non-excitonic material model with refractive indices \({n}_{0}=\sqrt{18}\), nxx = n0 + Δn/2 and nyy = n0 − Δn/2.
A small in-plane anisotropy (Δn = 0.2, matching the value for ReS2) already substantially modifies the dispersions of both modes in k space (Fig. 2d). In the ky = 0 (kx = 0) plane, the x-polarized mode 1 (y-polarized mode 2) exhibits a flatband, whereas the other mode develops a pronounced curvature. Moreover, the ky = 0 cut (Fig. 2e) reveals a band crossing between mode 1 and mode 2, forming a photonic Dirac cone at non-zero kx (Fig. 2d) that mirrors the graphene-like dispersion of two conical bands meeting at a single point44. A cut through the ky = −0.1k0 plane shows the evolution of the mode dispersions under anisotropy, with the flatband character gradually lost and the modes becoming clearly separated in energy (Fig. 2e).
These observations of anisotropy-induced directional flatbands are accompanied by a characteristic splitting of the topological charges of the underlying modes. The initial Γ-point integer topological charges (Fig. 2c) split into a pair of displaced fractional charges at non-zero Δn (Fig. 2f). The fractional charges coincide with mode crossings, forming Dirac points (Fig. 2d). This topological rearrangement modifies the photonic band curvatures, giving rise to directional flatbands.
We capture the above modal topological transformations with remarkable accuracy by an analytical model that approximates the simulated dispersion at Δn = 0 (Fig. 2a,b), with mode 1 following a parabolic dispersion \({\omega }_{1}={\omega }_{0}(1-\chi {k}^{2}/{k}_{0}^{2})\), where \(k=\sqrt{{k}_{x}^{2}+{k}_{y}^{2}}\), and mode 2 being dispersionless, that is, ω2 = ω0. Their far-field polarizations are approximated by a pair of mutually orthogonal unit vectors, that is, \({{\bf{e}}}_{1}^{k}=\hat{{\bf{x}}}\,{k}_{y}/k+\hat{{\bf{y}}}\,{k}_{x}/k\) and \({{\bf{e}}}_{2}^{k}=\hat{{\bf{x}}}\,{k}_{x}/k-\hat{{\bf{y}}}\,{k}_{y}/k\).
These assumptions enable us to apply the RSE formalism to track the mode evolution under the perturbation Δε from equation (1) across the k space (Supplementary Note 3), yielding the following hybrid eigenfrequencies:
$${\omega }_{\pm }({\bf{k}})\approx {\omega }_{0}\left[1-\dfrac{\chi {k}^{2}}{2{k}_{0}^{2}}\pm \sqrt{{\left(\dfrac{\chi {k}^{2}}{2{k}_{0}^{2}}-\beta \dfrac{{k}_{x}^{2}-{k}_{y}^{2}}{2{k}^{2}}\right)}^{2}+{\beta }^{2}\dfrac{{k}_{x}^{2}{k}_{y}^{2}}{{k}^{4}}}\,\right],$$
(3)
where β = β0Δε and β0 is the modes’ self-action (field self-overlap) integral.
Equation (3) directly explains the origin of the anisotropy-induced topological features. A Dirac point occurs when ω+ = ω−, that is, when both terms under the square root vanish simultaneously: the second term vanishes along kx = 0 or ky = 0, and for β > 0 (Δε > 0), the first term also vanishes at ky = 0 and \({k}_{x}/{k}_{0}=\pm \sqrt{\beta /\chi }\), fixing the Dirac point’s location in k space. As for the flatbands, one of the modes stays dispersionless at ω0[1 + β/2] along kx = 0 or ω0[1 − β/2] along ky = 0.
Experimental photonic flatbands
To verify the theoretically predicted anisotropy-induced topological features, we fabricate the C4-symmetric ReS2 metasurface and perform Fourier-space transmittance spectroscopy (Methods and Supplementary Note 8). The measured dispersions (Fig. 3a,b) confirm the numerical predictions: for excitation polarization \({\vec{E}}_{{\rm{exc}}}\parallel \vec{b}\) (mode 1, Fig. 3a), where \(\vec{b}\) denotes the crystal axis (Methods and Fig. 1c), the dispersion is pronouncedly anisotropic—parabolic along one in-plane direction and strongly flattened along the orthogonal direction—whereas for \({\vec{E}}_{{\rm{exc}}}\perp \vec{b}\) (mode 2, Fig. 3b), the flat and parabolic directions are interchanged, confirming the predicted directional photonic flatbands.
Fig. 3: Experimental photonic flatbands.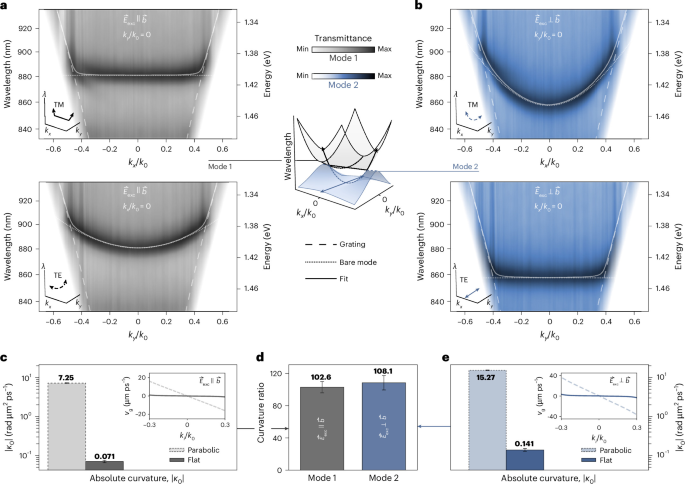
a,b, Angle-resolved Fourier-space transmittance for excitation polarization \({\vec{E}}_{{\rm{exc}}}\parallel \vec{b}\) (mode 1, grey; a) and \({\vec{E}}_{{\rm{exc}}}\perp \vec{b}\) (mode 2, blue; b), where \(\vec{b}\) denotes the crystal axis (Methods and Fig. 1c). For each excitation configuration, transverse-magnetic (TM; top panels, kx/k0) and transverse-electric (TE; bottom panels, ky/k0) dispersions are shown. The metasurface parameters are Λ = S × 465 nm, w0 = S × 220 nm, h = 90 nm, asymmetry α = 0.6 and S = 1. The dashed lines indicate the grating mode associated with the substrate. The dotted lines represent the intrinsic (bare) qBIC in the absence of substrate-induced radiative coupling. The solid lines correspond to a coupled-mode fit including hybridization between the intrinsic qBIC and the grating mode. Depending on the propagation direction in k space, the intrinsic qBIC exhibits either parabolic or strongly reduced curvature. c, Absolute curvature ∣κ0∣ at the Γ point for the two dispersions under \({\vec{E}}_{{\rm{exc}}}\parallel \vec{b}\), with the inset showing the corresponding calculated group velocity vg = ∂ω/∂k as a function of kx/k0 for flat branches and ky/k0 for parabolic branches (the fitted values are 7.25 ± 0.12 (parabolic) and 0.071 ± 0.005 (flat)). d, Curvature ratio between parabolic and flat dispersions (mode 1, 102.6 ± 7.0; mode 2, 108.1 ± 8.9). e, Corresponding curvature and group-velocity analysis for \({\vec{E}}_{{\rm{exc}}}\perp \vec{b}\) (the fitted values are 15.27 ± 0.28 (parabolic) and 0.141 ± 0.012 (flat)). Absolute curvature ∣κ0∣ and curvature ratio are presented as the mean fit values ± the standard deviation of the fit.
Note that these directional flatbands are not two-dimensional flatbands, as the dispersion is quenched along a single momentum direction only. To quantify the degree of band flatness, we analyse the curvature of the fitted dispersions extracted from Fig. 3a,b. The fits account for hybridization between the intrinsic qBICs and a substrate-induced grating mode via a minimal two-mode coupled-oscillator model (Supplementary Note 6). From the fitted dispersions, we compute the group velocity vg = ∂ω/∂k and curvature κ = ∂2ω/∂k2, which provide a direct quantitative measure of band flatness. The resulting curvature analysis is summarized in Fig. 3c–e. Figure 3c shows the absolute curvature ∣κ0∣ at the Γ point for the parabolic and flat mode 1 dispersions observed for \({\vec{E}}_{{\rm{exc}}}\parallel \vec{b}\). The flat branch exhibits a curvature more than two orders of magnitude lower than the parabolic branch, highlighting the strongly reduced group velocity near the Γ point (inset). The same analysis for \({\vec{E}}_{{\rm{exc}}}\perp \vec{b}\) is shown in Fig. 3e, confirming that the flattened dispersion persists under rotation of the excitation polarization. Figure 3d compares the curvature ratios between the parabolic and flat dispersions, revealing suppression factors exceeding two orders of magnitude for both modes. Note that even for an intrinsically flat qBIC dispersion (χ = 0), hybridization with the grating channel introduces a residual curvature at the Γ point; therefore, the experimentally extracted flatband branches show a finite, strongly suppressed curvature rather than vanishing exactly. We also find that the flatbands extend across 93.7% of the accessible k-space region for mode 1 and 91.5% for mode 2, limited only by the onset of diffraction (Supplementary Note 6).
Experimental Dirac points
We further experimentally probe the momentum-space region in which the anisotropy-induced transformation of qBIC dispersion gives rise to a Dirac point, manifesting as a linear crossing of orthogonally polarized modes at kx/k0 ≈ ±0.35 (Fig. 4a). To experimentally resolve the polarization structure of this crossing, we measure the hyperspectral Stokes parameters S = (S0, S1, S2) in momentum space (Methods and Supplementary Note 8), where S0 is the total measured intensity, whereas \({S}_{1}={T}_{{0}^{\circ }}-{T}_{9{0}^{\circ }}\) and \({S}_{2}={T}_{4{5}^{\circ }}-{T}_{-4{5}^{\circ }}\) are the transmittance differences between linearly polarized light at the respective angles. S3 is neglected, since only linearly polarized components are measured.
Fig. 4: Experimental Dirac points and far-field polarization topology.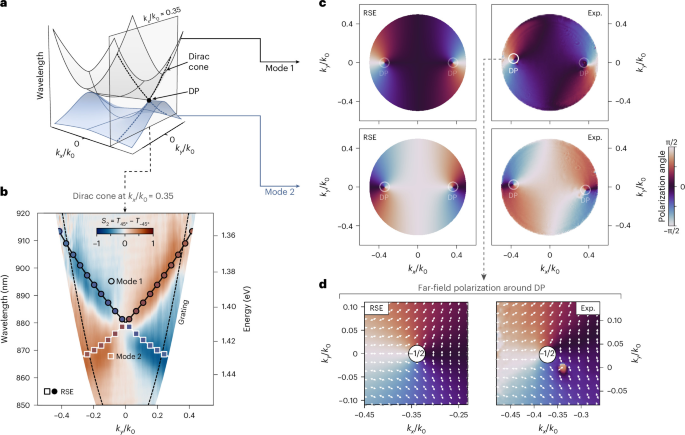
a, Simulated band structure in k space, showing mode 1 (grey) and mode 2 (blue), with the dashed plane indicating the k-space cut through the Dirac point. b, Measured Stokes parameter \({S}_{2}={T}_{4{5}^{\circ }}-{T}_{-4{5}^{\circ }}\) spectra along the kx/k0 ≈ 0.35 cut under TE excitation (\({\vec{E}}_{{\rm{exc}}}\perp \vec{b}\)). The wavelength–momentum dispersion reveals two modes forming a Dirac-like crossing. Markers indicate the RSE-fitted modal dispersion; their outline distinguishes mode 1 and mode 2, whereas their colour encodes the S2 parameter predicted by the RSE. Dashed lines denote the grating mode. c, Polarization angle along the two dispersion branches obtained from the analytical RSE model (left) and experiment (Exp., right), shown for mode 1 (top) and mode 2 (bottom). Both theory and experiment reveal continuous polarization evolution and characteristic Dirac points (DPs), in quantitative agreement. The slight global rotation of the experimental maps can be attributed to a small misalignment of the excitation polarization with respect to the crystal b axis (Supplementary Note 4). d, Far-field polarization field in the vicinity of a selected Dirac point. Vector plots show the local polarization orientation extracted from the analytical RSE model (left) and from experiment (right). The polarization vectors exhibit a half-integer winding around the singularity, corresponding to a topological charge of −1/2, in agreement with the theoretical predictions shown in Fig. 2f. The measurements are performed on the same metasurface as that shown in Fig. 3.
Experimental S2 spectra reveal two branches intersecting in a Dirac-like crossing at the kx/k0 = 0.35 cut, in excellent agreement with the theoretical prediction shown in Fig. 4b. As demonstrated in Fig. 2f, a Dirac point is a singularity in the far-field polarization, carrying a half-integer topological charge and marked by an orthogonal polarization flip along kx. To experimentally demonstrate this, we extract the polarization angle \(\phi =\arctan ({S}_{2}/{S}_{1})/2\), which, because the two modes are orthogonal, relates directly to the mixing angle between mode 1 and mode 2 predicted by the RSE model (Supplementary Note 3). We evaluate this angle for each mode by fitting the analytical RSE band structure from equation (3) to the hyperspectral Stokes (S) data (Supplementary Note 4). The resulting momentum-resolved polarization-angle maps from both RSE and experiment are shown in Fig. 4c. In both cases, the polarization angle evolves continuously along the dispersion branches and exhibits singular points coinciding with the Dirac points.
Finally, we analyse the far-field polarization vectors around a selected Dirac point, comparing the local polarization orientation from the RSE and experiment (Fig. 4d and Supplementary Note 4). In both cases, the vectors exhibit a half-integer winding around the singularity, corresponding to a topological charge of −1/2, which provides direct experimental evidence of the polarization vortex predicted by the RSE and full-wave simulations. Our platform also enables an additional degree of control without requiring further geometrical perturbations, since the orientation of the in-plane anisotropy axis provides a tuning parameter that revolves the Dirac points through momentum space, whereas the underlying qBICs remain orthogonally polarized throughout (Supplementary Note 9). Note that at these Dirac points, only the eigenfrequencies coalesce, unlike exceptional points45, where both eigenvectors and eigenfrequencies coalesce.
Formation of anisotropic polaritonic flatbands
Tuning the eigenfrequencies of the two orthogonally polarized qBICs into the range of the excitonic transition energies of ReS2 transfers the topologically engineered dispersion landscape (including the directional flatbands) into the polaritonic regime. In bulk ReS2 crystals, the energetically separated excitonic transitions (exciton 1 and exciton 2) are linearly polarized along nearly orthogonal in-plane directions, based on ellipsometric measurements46, though other studies report slightly different polarization angles10. This distinction is not critical here: we align the metasurface’s two orthogonal polarization axes with the exciton axes and excite each mode accordingly, yielding good agreement between simulation, analytical theory and experiment. Importantly, our C4-symmetric metasurface provides an ideal platform to isolate the optical consequences of this birefringence: varying the incident polarization selectively addresses each qBIC and the corresponding exciton (mode 1/exciton 1 and mode 2/exciton 2).
To treat exciton–polariton formation within the same RSE framework used above, we extend the formalism by introducing excitonic contributions to equation (1) as permittivity poles, so that close to the positive-frequency half-axis, the permittivity reads:
$${\varepsilon }_{xx}(\omega )=\varepsilon +\dfrac{\Delta \varepsilon }{2}+\dfrac{{f}_{x}}{{\omega }_{x}-\omega },\quad {\varepsilon }_{yy}(\omega )=\varepsilon -\dfrac{\Delta \varepsilon }{2}+\dfrac{{f}_{y}}{{\omega }_{y}-\omega },$$
(4)
where, to comply with previous observations46, we assume that exciton 1 (ωx) is redshifted relative to exciton 2 (ωy), \(({\rm{Re}}\,{\omega }_{x} < {\rm{Re}}\,{\omega }_{y})\), with similar oscillator strengths (fx ≈ fy). The anisotropic background term (Δε > 0) and the excitonic terms are all treated as a perturbation.
Using the nonlinear RSE formalism47, we obtain a sixth-order polynomial dispersion equation with a pair of dispersionless solutions (ωx, ωy), corresponding to uncoupled excitons, and four exciton–polariton branches (Fig. 5a,c). The resulting polaritons retain the momentum-space dispersion of the underlying photonic modes, as shown by the separate cross-sections along kx = 0 and ky = 0, and the RSE further predicts the far-field polarization of all solutions (Supplementary Note 3).
Fig. 5: Experimental anisotropic strong coupling and directional polaritonic flatbands.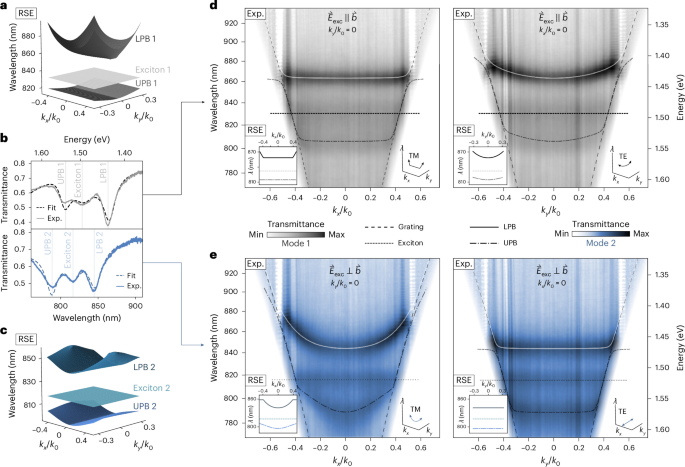
a,c, Upper polariton band (UPB) and lower polariton band (LPB) structures resulting from the coupling of mode 1 and exciton 1 (a) and mode 2 and exciton 2 (c), obtained from the nonlinear RSE (Supplementary Note 3). b, Experimental transmittance spectra at normal incidence of orthogonally polarized exciton–polaritons. Coupled-mode fit yields Rabi splittings of ℏΩR1 = 110 meV and ℏΩR2 = 108 meV (Supplementary Note 5). The LPBs comprise 43% exciton 1/57% mode 1 and 51% exciton 2/49% mode 2, as determined from the Hopfield coefficients (Supplementary Note 7); for the UPBs, these ratios are reversed. d,e, Experimental angle-resolved Fourier-space transmittance for excitation polarization \({\vec{E}}_{{\rm{exc}}}\parallel \vec{b}\) (d; mode 1, grey) and \({\vec{E}}_{{\rm{exc}}}\perp \vec{b}\) (e; mode 2, blue), where \(\vec{b}\) denotes the crystal axis. The left and right panels correspond to TM (kx/k0) and TE (ky/k0) excitation configurations, respectively. The insets show the corresponding RSE solutions. The dotted lines represent the excitonic resonance, and the dashed lines correspond to a grating mode. The solid and dot–dashed lines denote coupled-mode fit results for LPB and UPB, respectively (Supplementary Note 6). Depending on the propagation direction in k space, the polaritonic branches exhibit either parabolic or flatband dispersion. Along the flatband direction, the Hopfield coefficients remain nearly constant over the accessible momentum range, consistent with their values at the Γ point (Supplementary Note 7). The metasurface parameters are Λ = S × 465 nm, w0 = S × 220 nm, h = 90 nm, α = 0.6 and S = 0.95.
We begin the experimental verification of strong coupling between the photonic qBICs and the excitons at normal incidence. Figure 5b shows the transmittance spectra for the two excitation polarizations, revealing clear splitting from hybridization between the photonic modes and excitons, with coupled-mode fits yielding Rabi splittings exceeding 100 meV. A quantitative analysis of the coupling strengths and linewidths confirms that the system operates in the strong-coupling regime (Supplementary Note 5).
We next investigate the exciton–polariton dispersion in momentum space. Experimental Fourier-space transmittance measurements for \({\vec{E}}_{{\rm{exc}}}\parallel \vec{b}\) and \({\vec{E}}_{{\rm{exc}}}\perp \vec{b}\) are shown in Fig. 5d,e. As predicted by the analytical RSE model, the polaritonic branches inherit the anisotropic dispersion of the underlying photonic modes, exhibiting either a conventional parabolic dispersion or a strongly suppressed curvature corresponding to a polaritonic flatband, depending on the propagation direction in k space.
To quantify these dispersions, we analyse the polaritonic branches’ curvature (Supplementary Note 6), confirming that they retain the pronounced anisotropy of the underlying photonic dispersion. The corresponding Hopfield coefficients (Fig. 5 caption and Supplementary Note 7) confirm a genuinely mixed, nearly momentum-independent light–matter composition along the flatband direction.
Taken together, these findings constitute an experimental demonstration of topologically engineered polaritonic flatbands arising from the interplay of C4-symmetry-imposed mode degeneracy and material anisotropy. They validate the theoretical framework developed above, confirming that in-plane anisotropy can be harnessed to control the dispersion of qBICs.