
Video-rate MIP-ODT system
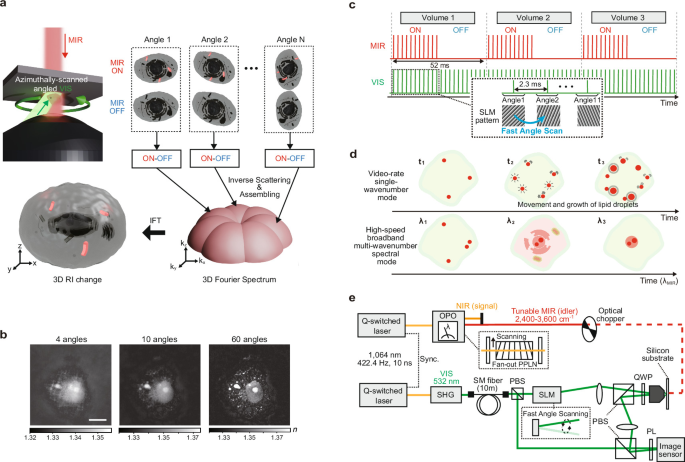
We first outline the principle of MIP-ODT. In this method, wide-field MIR irradiation induces localized heating across the field of view through MIR absorption, generating transient RI changes via the thermo-optic effect. These induced RI changes are quantitatively measured by ODT, where 2D optical wavefronts are interferometrically captured under multiple visible illumination angles with and without MIR excitation (Fig. 1a). To reconstruct the 3D distribution of the MIP-induced RI change from the measured wavefront images, the wavefront modulation is extracted for each illumination angle from the difference between MIR-ON and MIR-OFF measurements. Under the weak-scattering approximation, this differential wavefront is mapped to the corresponding spatial-frequency components of the RI change in the sample’s 3D Fourier space. By assembling the spatial-frequency information across all illumination angles, we reconstruct the 3D distribution of MIP-induced RI changes (see “Methods”, Procedure of RI reconstruction).
Fig. 1: Video-rate MIP-ODT system.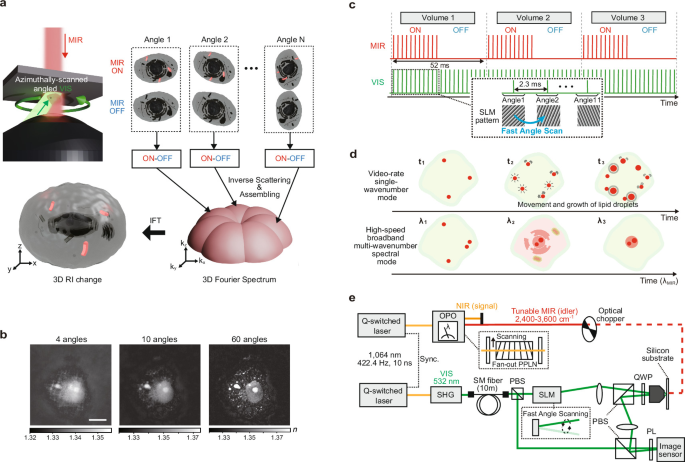
a A schematic of the MIP-ODT principle. IFT, Inverse Fourier transformation. b Reconstructed refractive index (RI) images obtained using different numbers of illumination angles. Scale bar, 10 μm. c Timing diagram of video-rate volumetric image acquisition. d Operating modes of the system: video-rate single-wavenumber mode and high-speed broadband multi-wavenumber spectral mode. e The optical layout of the video-rate MIP-ODT system. The MIR beam is modulated on and off using an optical chopper. MIR mid-infrared; MIP mid-infrared photothermal; VIS visible; NIR near-infrared; SM single-mode; SHG second-harmonic generation; OPO optical parametric oscillator; SLM spatial light modulator; PBS polarizing beam splitter; QWP quarter-wave plate; PL polarizer; PPLN periodically poled lithium niobate; ODT optical diffraction tomography.
We then designed an MIP-ODT system for video-rate volumetric imaging. To determine an appropriate balance between imaging speed and reconstruction fidelity, we evaluated reconstructed RI images obtained with different numbers of visible illumination angles (Fig. 1b, see “Methods”, ODT measurement with a variable number of illuminations). Based on this analysis, the number of illumination angles was set to eleven to maximize volumetric acquisition speed while maintaining sufficient image quality to capture global cellular morphology. Figure 1c provides a timing diagram of the video-rate MIP-ODT system. High-speed angular scanning of visible illumination is achieved through fast wavefront control using a high-speed SLM operating at 422.4 Hz, corresponding to an angular update period of 2.3 ms. Under these conditions, the volumetric MIP acquisition rate is given by \({v}_{{{{\rm{ps}}}}}=422.4/(2\cdot 11)\) = 19.2 vps, which corresponds to an effective volumetric acquisition time of 52 ms. Here, the factor of two accounts for the alternating acquisition of MIR-ON and MIR-OFF frames. The system supports two distinct operational modes (Fig. 1d). In the video-rate single-wavenumber mode, volumetric imaging is performed at the full video-rate acquisition speed. In the high-speed broadband multi-wavenumber spectral mode, rapid MIR wavenumber sweeping enables the acquisition of 19.2 spectral points per second. Given that the intrinsic spectral linewidth of the MIR excitation is approximately 10 cm−121, this configuration enables scanning of a spectral window of several hundred cm−1 within one second.
Figure 1e shows the optical layout of the video-rate MIP-ODT system. The MIR and visible pulses are derived from two electronically synchronized Q-switched Nd:YAG lasers (wavelength 1064 nm; pulse width, 10 ns; repetition rate, 422.4 Hz; NL202, Ekspla). The visible probe beam is generated via second-harmonic generation (SHG) using a 15-mm-long LBO crystal. The MIR pump beam is provided by the idler output of an OPO incorporating a fan-out periodically poled lithium niobate (PPLN) crystal as the nonlinear medium (HC Photonics Corporation). The MIR output wavenumber is continuously tunable over the range 2400–3600 cm−1 by laterally translating the fan-out PPLN crystal using a motorized translation stage (LNR25ZFS/M, Thorlabs), which selectively accesses different poling periods along the crystal. The OPO delivers pulse energies of ~3 μJ at the sample plane, more than one order of magnitude higher than those of quantum cascade laser (QCL) sources used in previous MIP tomography implementations17,19. This substantially enhances the single-frame MIP detection sensitivity. The short 10-ns MIR pulses effectively suppress spatial blurring caused by thermal diffusion, limiting heat-induced resolution degradation to ~10 nm22. In addition, the sub-kHz repetition rate ensures sufficient thermal relaxation between successive excitation pulses, thereby minimizing thermal pile-up. This reduces the risk of heat-induced damage during prolonged live-cell imaging and preserves the quantitative accuracy of the measured RI change signals.
The visible probe beam is directed into a single-objective ODT system based on off-axis digital holography (DH) implemented in a Mach-Zehnder interferometer22. A 10-m optical fiber is incorporated into the probe-beam path to suppress temporally varying coherent artifacts. In the sample arm, the illumination angle of the visible probe is rapidly modulated using a high-speed SLM (1920 × 1152 XY Phase Series Spatial Light Modulator, Meadowlark Optics) (see “Methods”, Tilted illumination using an SLM). After transmission through the specimen, the probe beam is reflected by a silicon substrate and recollected by the same objective lens (UPlanSApo60x, Olympus), forming a reflective configuration. This geometry allows MIR excitation to be introduced from the opposite side through the substrate. The NAs for visible illumination and detection are 0.85 and 1.2, respectively. The reflected visible beam is subsequently interfered with the reference beam at an off-axis angle, and the resulting holograms are recorded at 422.4 fps using a high-speed image sensor (VLXT-17M.I, Baumer). Camera acquisition is synchronized with the SLM modulation to ensure precise angular sampling. Details of the timing synchronization scheme are provided in Supplementary Note 1.
Validation of the spatial resolution and signal-to-noise ratio (SNR)
To validate the spatial resolution and SNR of video-rate MIP-ODT, we performed volumetric imaging of a living COS-7 cell (see “Methods”, Preparation of biological samples). Figure 2a shows representative depth-resolved slices of the RI tomograms (top) and the corresponding MIP images (bottom), acquired at a volumetric imaging rate of 19.2 vps. For MIP-ODT, a MIR pump wavenumber of 2920 cm−1 was used to excite the CH2 asymmetric stretching vibration, which is abundant in lipid-rich cellular structures. In both ODT and MIP-ODT, depth-resolved slices reveal plane-specific 3D cellular features that vary with axial position, confirming successful volumetric reconstruction under video-rate acquisition conditions.
Fig. 2: Video-rate volumetric MIP-ODT imaging and spatial resolution characterization in a living cell.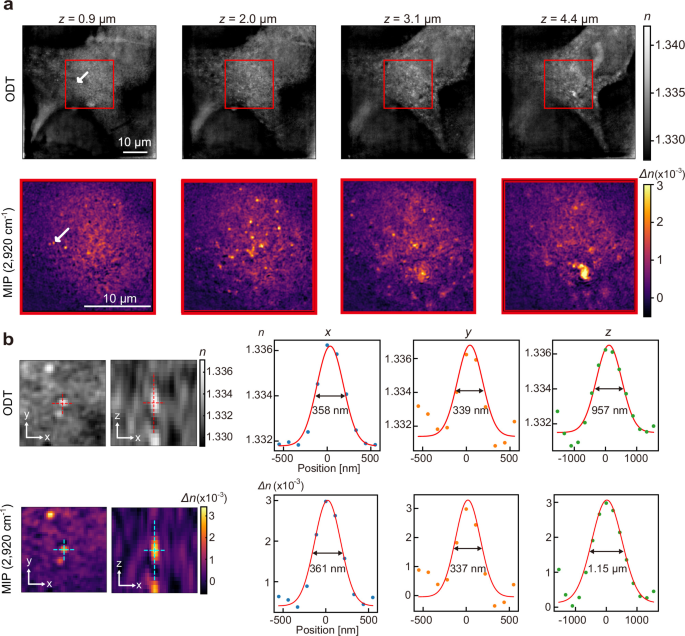
a Depth-resolved slices extracted from the reconstructed refractive index (RI) tomogram of a living COS-7 cell (top). Corresponding MIP-induced RI change images acquired from the red-boxed regions, obtained at a volumetric imaging rate of 19.2 vps using a MIR pump tuned to 2920 cm−1 (bottom). White arrows indicate a small intracellular particle selected for spatial resolution analysis. The z-axis is aligned with the optical axis, and the origin is defined as the surface of the silicon substrate. The field of view (FOV) of ODT and MIP-ODT is 55 × 55 and 20 × 20 μm2, respectively. The sample extent of MIP-ODT was estimated to be 10.1 μm along the axial direction. ODT and MIP-ODT imaging, as shown in (a), was performed on more than 30 cells from more than 10 independent cultures with similar results. b Left, zoom-in views of the selected particle in the reconstructed RI (top) and MIP-induced RI change (bottom). Right, corresponding lateral (x, y) and axial (z) cross-sectional profiles extracted along the dashed lines in the left panels. Red solid lines represent Gaussian fits used to determine the full width at half maximum (FWHM). MIR mid-infrared; MIP mid-infrared photothermal; ODT optical diffraction tomography.
We first quantified the measurement noise to determine the SNR. The temporal RI fluctuations were measured from ODT data acquired in the MIR-OFF state. Averaging the voxel-wise standard deviations across the field of view yielded an effective noise level of 4.2 × 10⁻⁵ (Supplementary Note 2). Using a representative peak MIP-induced RI change of 3.0 × 10⁻³ from Fig. 2a as the signal amplitude, we obtain a signal-to-noise ratio of 71.4. This value indicates that a high signal-to-noise ratio is maintained under video-rate volumetric acquisition.
Next, spatial resolution was evaluated by analyzing the full width at half maximum (FWHM) of cross-sectional profiles extracted from a small intracellular particle, as indicated by white arrows in Fig. 2a, in both the reconstructed RI and the MIP-induced RI change. Cross-sectional profiles along the lateral (x and y) and axial (z) directions are presented in Fig. 2b. Each profile was fitted with a Gaussian function to extract the corresponding FWHM values. For ODT, the measured FWHMs were 358, 339, and 957 nm along the x, y, and z axes, respectively. For MIP-ODT, the corresponding values were 361, 337 nm, and 1.15 μm. These values are taken as representative lateral and axial spatial resolutions of the present system. Numerical simulations predict a theoretical FWHM of 230 nm laterally and 870 nm axially for the point spread function. The slightly larger experimental values likely arise from the finite size of the intracellular particle used for evaluation, suggesting that the intrinsic resolution of the optical system may be modestly better than the measured estimates.
High-speed broadband multi-wavenumber spectral volumetric imaging
We next demonstrate high-speed broadband multi-wavenumber spectral volumetric imaging by integrating the video-rate MIP-ODT platform with rapid wavenumber sweeping of the MIR excitation. This implementation enables the acquisition of up to 19.2 spectral sampling points per second within a selected spectral window. In this experiment, we focus on the 2800–3100 cm−1 region, which includes the CH2 and CH3 stretching vibrations that are characteristic of lipids and proteins. At each volume, the instantaneous MIR excitation wavenumber, corresponding to the idler output of the OPO, is determined by measuring the wavelength of the counterpart near-infrared (NIR) signal beam using a spectrometer (C11482GA, Hamamatsu). This approach allows volume-by-volume spectral assignment under fully synchronized system control (see “Methods”, Spectral volumetric analysis). Supplementary Note 3 summarizes the MIR wavenumber trajectories inferred from the measured NIR spectra for both unidirectional fast-sweeping and continuous-sweeping modes. These measurements confirm that spectral windows of approximately 300 and 200 cm−1 can be covered within one second under unidirectional and continuous sweeping modes, respectively.
To validate 3D, location-dependent spectral readout in cells, we performed broadband multi-wavenumber spectral volumetric imaging of a fixed COS-7 cell immersed in D2O-based phosphate-buffered saline (PBS). Figure 3a and b present representative depth-resolved slices of the RI tomograms and the corresponding MIP images, respectively. The MIP images shown in Fig. 3b were acquired at excitation wavenumbers of 2920, 2950 and 3094 cm−1. The signal at 2920 cm−1 mainly reflects CH₂ contributions that are prominent in lipid-enriched regions, whereas the 2950 cm−1 signal mainly reflects CH3 contributions that are relatively enhanced in protein-rich regions. Because protein-associated C–H stretching absorption forms a broad spectral band that contributes to both wavenumbers, the 2920 and 2950 cm−1 images should not be interpreted as simple lipid- and protein-specific contrasts, respectively. Nevertheless, comparison of these two resonant images reveals location-dependent spectral contrast: the cytoplasmic particle marked by the blue arrow shows a stronger signal at 2920 cm−1, whereas the nucleolus marked by the green arrow shows comparable contrast at both wavenumbers. The off-resonant image at 3094 cm−1 further shows that the background signal is sufficiently weak. Using the signal intensity of the blue-arrow-marked particle relative to the spatially averaged background signal in the off-resonant 3094 cm−1 image, we estimated a signal-to-background ratio of 56.
Fig. 3: High-speed broadband multi-wavenumber spectral MIP-ODT imaging of subcellular chemical heterogeneity.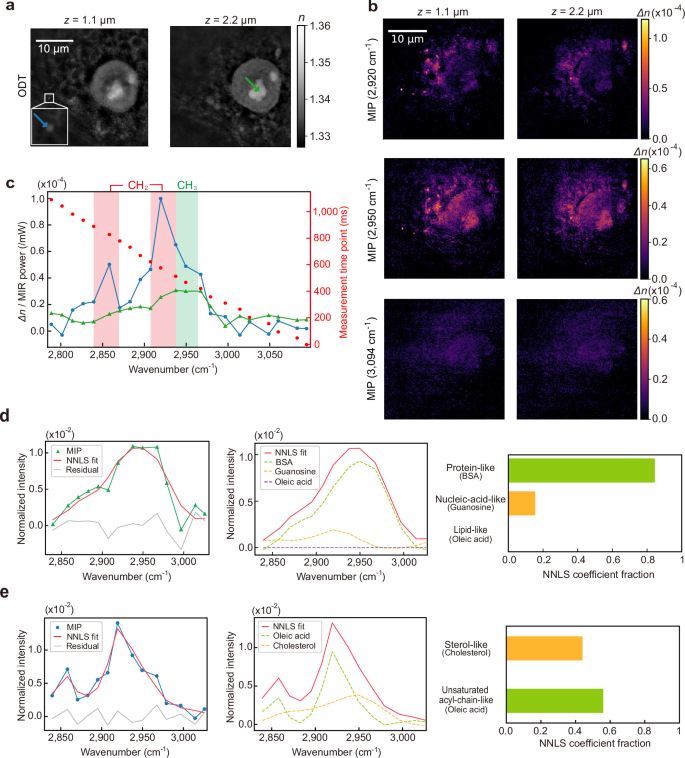
a Representative depth-resolved slices from RI tomograms of a fixed COS-7 cell at two axial positions. The blue and green arrows indicate a small cytoplasmic particle and the nucleolus, respectively. b Corresponding MIP images acquired at 2920 cm−1 (top), 2950 cm−1 (middle) and 3094 cm−1 (bottom). The FOV of ODT and MIP-ODT was 44 × 44 μm2. The sample extent of MIP-ODT was estimated to be 2.4 μm along the axial direction. The experiments in (a, b) were independently repeated three times using three independent cell cultures (8 cells in total) with similar results. c Local vibrational spectra extracted from two representative subcellular regions indicated in a: the small cytoplasmic particle (blue) and the nucleolus (green). The particle and nucleolar spectra were averaged over regions of interest containing 18 and 2205 voxels, respectively. Red- and green-shaded bands indicate the CH2- and CH3-stretching regions, respectively. Red dots represent the instantaneous MIR excitation wavenumber at each measurement time point during the wavenumber sweep; the time axis denotes the elapsed time from the start of the measurement. d, e non-negative least-squares (NNLS) analysis of the nucleolar spectrum (d) and the cytoplasmic-particle spectrum (e). The nucleolar spectrum was fitted using bovine serum albumin (BSA), guanosine, and oleic acid, whereas the cytoplasmic-particle spectrum was fitted using oleic acid and cholesterol. The left panels show the measured spectra, NNLS fits, and residuals; the middle panels show the coefficient-weighted reference spectra; and the right panels show the NNLS coefficients normalized to sum to unity. MIR mid-infrared; MIP mid-infrared photothermal; ODT optical diffraction tomography.
Based on the volumetric reconstructions, we selected two representative subcellular regions of interest: the nucleolus and a small cytoplasmic particle. Local vibrational spectra were extracted from these regions, as shown in Fig. 3c. The nucleolar spectrum showed a broad C–H stretching band centered near 2950 cm−1. To obtain a coarse molecular decomposition of this spectrum, we performed non-negative least-squares (NNLS) fitting using bovine serum albumin (BSA), guanosine, and oleic acid as representative references for protein-like, nucleic-acid-like, and lipid-like spectral contributions, respectively (Fig. 3d) (see “Methods”, Reference-based NNLS analysis of local C–H stretching spectra). The fitted spectrum closely reproduced the measured MIP spectrum with a small residual (Fig. 3d, left), and the fitted contributions of the three reference components are shown in Fig. 3d, middle. The normalized NNLS coefficients showed a dominant protein-like contribution, a secondary nucleic-acid-like contribution, and only a minor lipid-like contribution (Fig. 3d, right). This decomposition is consistent with the expected protein- and RNA-dominant molecular composition of the nucleolus.
The spectrum extracted from the small cytoplasmic particle exhibited pronounced CH₂-associated peaks around 2860 and 2920 cm−1, consistent with a lipid-rich compartment and supporting its assignment as a lipid droplet. We then examined its lipid-related spectral composition by two-component NNLS fitting using oleic acid and cholesterol as representative references for unsaturated acyl-chain-like and sterol-like spectral contributions, respectively (Fig. 3e). The fitted spectrum closely reproduced the measured MIP spectrum with a small residual (Fig. 3e, left), and the fitted contributions of the two reference components are shown in Fig. 3e, middle. The normalized NNLS coefficients indicated that the unsaturated acyl-chain-like component accounted for approximately 56% of the fitted spectral contribution, whereas the sterol-like component accounted for approximately 44% (Fig. 3e, right).
The larger unsaturated-acyl-chain-like contribution is qualitatively consistent with the neutral-lipid-rich composition of lipid droplets, whose cores commonly contain triacylglycerols and sterol esters with fatty acyl chains23. These fractions represent relative spectral weights within the present reference-based model and should not be interpreted as quantitative molar fractions of the underlying lipid species. The ability to perform local lipid-composition analysis in three dimensions with approximately second-scale temporal resolution could support future live-cell studies that link lipid-droplet composition to droplet transport, organelle interactions, and longer-term metabolic remodeling. These results show that broadband multi-wavenumber spectral MIP-ODT resolves compartment-specific vibrational signatures in 3D and enables rapid chemical phenotyping of intracellular architecture.
Video-rate 3D tracking of lipid droplets in living cells
To demonstrate a biologically relevant use case of video-rate MIP-ODT, we performed 3D tracking of lipid droplets in living cells. Lipid droplets are key targets in label-free vibrational imaging because their spatial distribution, intracellular transport, and structural remodeling reflect cellular metabolism and interactions with organelles, the cytoskeleton, and local intracellular environments. Video-rate MIP-ODT enables these lipid-rich structures to be visualized and tracked in three dimensions without labeling.
We performed volumetric MIP-ODT imaging of living COS-7 cells treated with oleic acid, a condition known to robustly induce lipid droplet formation24. Volumetric datasets were acquired continuously for approximately 3.6 s at 19.2 vps, with the MIR excitation tuned to 2920 cm−1 to selectively probe lipid-rich structures. Representative depth-resolved slices are shown in Fig. 4a. Using this dataset, we analyzed the motion of an individual lipid droplet exhibiting pronounced displacement during the acquisition period, as indicated by the orange arrow (see “Methods”, Motion analysis in video-rate MIP-ODT imaging). The centroid position was tracked over time to reconstruct its full 3D trajectory (Fig. 4b). The tracking results overlaid on the MIP-ODT data are shown in Supplementary Movie 1. The displacement spans approximately 200–300 nm along each of the x, y, and z axes. Such axial motion cannot be captured by conventional 2D imaging and would therefore lead to systematic underestimation of intracellular transport dynamics. In contrast, our volumetric imaging enables direct quantification of complete 3D motion within the cellular environment. 3D tracking of lipid droplets has previously been reported using ODT25, in which droplets were identified from high-RI puncta. However, this contrast mechanism lacks intrinsic chemical specificity and may therefore require orthogonal validation. By contrast, MIP-ODT directly tracks lipid-rich structures via vibrational contrast, enabling chemically specific and volumetrically resolved characterization of droplet dynamics.
Fig. 4: Video-rate 3D tracking and anomalous-diffusion analysis of lipid droplets in living cells.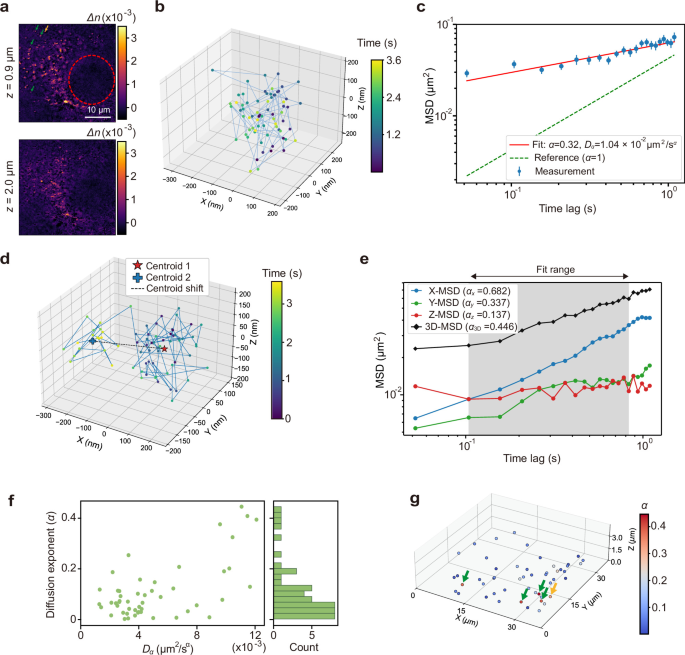
a Representative depth-resolved MIP-ODT slice of an oleic-acid-treated COS-7 cell acquired at 19.2 volumes per second with MIR excitation tuned to 2920 cm−1. The red dashed circle indicates the nuclear region. The orange arrow indicates the lipid droplet analyzed in (b, c), the red arrow indicates the lipid droplet analyzed in (d, e), and the green arrows indicate additional lipid droplets highlighted in (g). The FOV of MIP-ODT is 37.4 × 37.4 μm2. The sample extent of MIP-ODT was estimated to be 6.4 μm along the axial direction. The video-rate measurement in (a) was performed on three cells in different fields of view from a single dish, with similar results. b Reconstructed 3D trajectory of a lipid droplet indicated by the orange arrow in (a), tracked over a 3.6 s acquisition window. c Mean square displacement (MSD) calculated from the 3D trajectory as a function of time lag τ. d The reconstructed 3D trajectory of the lipid droplet indicated by the red arrow in (a), exhibiting a step-like displacement between two spatially separated regions. The red star and blue cross indicate the trajectory centroids calculated before and after the displacement, respectively, and the dashed line indicates the centroid-to-centroid displacement. e Direction-resolved MSDs along the x, y, z axes, together with the full 3D MSD, calculated from the trajectory shown in (d). The gray shaded region and the arrow indicate the range of time lags used for power-law fitting. f Scatter plot of the generalized diffusion coefficient \({D}_{\alpha }\) versus the anomalous diffusion exponent \(\alpha\) obtained from MSD analysis of individual lipid-droplet trajectories in the field of view. The histogram on the right shows the distribution of \(\alpha\) across trajectories (counts per bin). g Spatial map of anomalous diffusion exponents \(\alpha\). The orange, red and green arrows identify the lipid droplets marked by the corresponding arrows in a.
To quantify the biological information provided by 3D tracking, we analyzed the centroid trajectory within the framework of anomalous diffusion. This analysis is valuable because anomalous diffusion reflects constrained intracellular transport arising from molecular crowding, viscoelasticity, and interactions with local intracellular environments. The mean squared displacement (MSD), calculated from the 3D trajectory over the 3.6 s observation window and evaluated for time lags \(\tau\) up to 1.1 s, exhibits a power-law dependence on τ (Fig. 4c). Fitting the MSD yields an anomalous diffusion exponent of α = 0.32 (95% bootstrap confidence interval (CI): 0.23–0.42, 500 bootstrap resamples), which is substantially lower than the value expected for free diffusion (α = 1) and indicates pronounced subdiffusive behavior. Such subdiffusion is commonly observed for endogenous cargos in living cells and is generally attributed to molecular crowding and viscoelastic constraints that impede long-range transport26.
To illustrate the information uniquely provided by volumetric tracking, we next analyzed a distinct lipid droplet, indicated by the red arrow in Fig. 4a, whose trajectory exhibited a step-like change in its local mean position during the observation window. Segmenting the trajectory before and after the transition revealed two spatially separated centroid positions, with a three-dimensional centroid shift of approximately 0.28 µm (Fig. 4d). The trajectory therefore contained both local fluctuations around transient centroid positions and a larger relocation between them, a behavior that can be fully quantified only when the particle position is measured in x, y, and z at each time point. We further decomposed the MSD of this trajectory into Cartesian components (Fig. 4e). The fitted anomalous exponents differed substantially among axes, with \({\alpha }_{X}\) = 0.68, \({\alpha }_{Y}\) = 0.34, \({\alpha }_{Z}\) = 0.14, and \({\alpha }_{3{{{\rm{D}}}}}\) = 0.45 for the total 3D MSD over the same fit range. This axis-resolved analysis reveals direction-dependent intracellular constraints that would be concealed in a 2D projection, in which axial confinement and its contribution to the overall transport mode cannot be evaluated. These results underscore that video-rate MIP-ODT enables not only chemically specific tracking of lipid droplets but also quantitative decomposition of their 3D transport dynamics.
We next estimated the generalized diffusion coefficient \({D}_{\alpha }\) and the diffusion exponent \(\alpha\) for 50 tracked particles within the same field of view. Figure 4f summarizes the resulting distributions of \({D}_{\alpha }\) and \(\alpha\). The particle-wise estimation uncertainty was moderate (median 95% bootstrap CI width for \(\alpha\): 0.17, median relative 95% bootstrap CI width for \({D}_{\alpha }\): 0.17, 500 bootstrap resamples). The diffusion coefficients span approximately 10−3–10−2 µm2 s−α, revealing marked heterogeneity in intracellular lipid droplet mobility. A previous study has reported anomalous diffusion exponents for intracellular lipid droplets spanning a broad range from approximately 0 to 225. In contrast, the α values observed here are confined to a narrower range of 0.0–0.4. This restricted distribution may reflect the relatively low metabolic activity of the cells under our experimental conditions, which would suppress ATP-dependent active processes, thereby biasing subcellular motion toward more locally constrained dynamics27.
Finally, to probe the spatial organization of intracellular mobility, we mapped the spatial distribution of diffusion exponents \(\alpha\) across the field of view (Fig. 4g). A subset of lipid droplets marked by orange, red, and green arrows in Fig. 4a, g exhibited locally elevated \(\alpha\) values, revealing pronounced spatial heterogeneity in diffusion behavior within the cell. These particles are located distal to the nucleus (dashed red circle in Fig. 4a), where intracellular crowding is reduced relative to perinuclear regions enriched in endoplasmic reticulum and other organelles. These observations suggest that lipid droplets experience less constrained motion in these areas. Collectively, these results demonstrate that video-rate MIP-ODT enables real-time, 3D tracking of chemically resolved intracellular structures, providing quantitative access to heterogeneous and potentially anisotropic particle dynamics in living cells.