
Ethics approval and consent to participate
All methods were performed in accordance with the relevant guidelines and regulations. For human experiments, ethical approval was obtained from the Human Subject Ethics Sub-committee (approval number: HSEARS20221111001). The clinical trial was registered at https://www.clinicaltrials.gov with the unique identifier NCT06736067. Written informed consent was obtained from all participants. For animal experiments, all experimental procedures were reviewed and approved by the institutional research ethics committee, and the researchers conducting the experiments were appropriately licensed. The study adhered to the ethical guidelines for animal research established by the Animal Subjects Ethics Sub-committee.
Participants recruitment
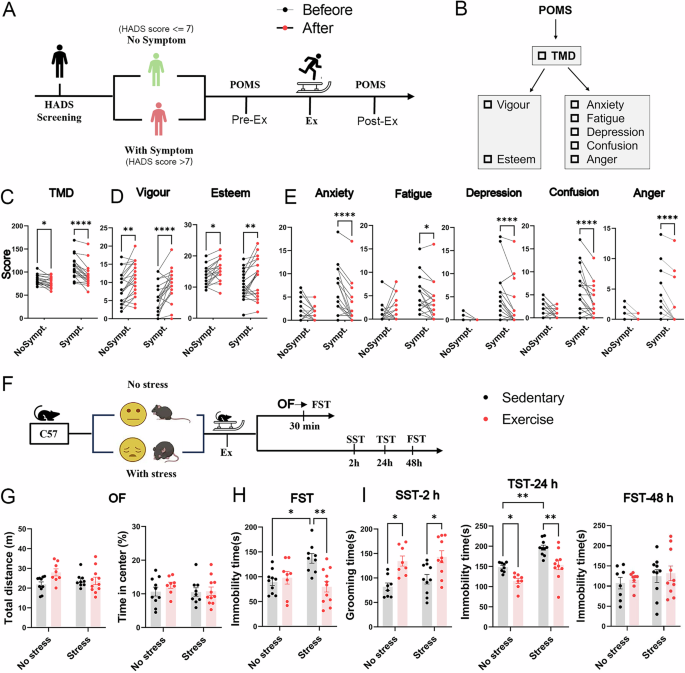
The trial was designed as a single-arm pre-posttest study to evaluate the effects of 30 min of aerobic treadmill running on mood states. The primary outcome measured was depressed mood, assessed using the Profile of Mood States (POMS), while other affective domains evaluated by this scale were analyzed as secondary outcomes. Healthy participants were recruited via emails and posters displayed on campus. Written informed consent was obtained from all participants. Potential participants completed an online questionnaire based on the inclusion and exclusion criteria. Inclusion criteria included university students or staff aged 18 to 40 years and self-reportedly healthy. Exclusion criteria were: 1) individuals with injuries impairing safe exercise, 2) individuals with metabolic, neurologic, or psychiatric disorders, or those with comorbid disorders, and 3) individuals currently taking antidepressant medication.
Eligible participants completed an online version of the Hospital Anxiety and Depression Scale (HADS) screen for depression and/or anxiety symptoms. Participants were classified as symptomatic (HADS > 7) or asymptomatic (HADS < = 7) based on their HADS scores for depression and/or anxiety and were allocated into two groups accordingly [32]. Based on previous studies and power analyses considering an error probability of 5% and a study power of 0.80, we recruited 40 participants (16 males and 24 females) and divided them into two groups: symptom (anxiety and/or depression) and non-symptom groups (n = 20/group) [33, 34]. Participant characteristics are detailed in Table S1. Experiments, including the mood evaluation questionnaire and treadmill exercise intervention, were conducted on the same day at The Hong Kong Polytechnic University in Hong Kong.
Measurement of mood state in participants
We utilized the Profile of Mood States (POMS) to assess mood changes in participants before and after exercise. POMS is a 30-item questionnaire scored on a 5-point Likert scale, ranging from “Not at all” to “Extremely.” It provides seven subscales: 1) anger (e.g., grouchy, furious); 2) confusion (e.g., muddled, forgetful); 3) depression (e.g., sad, unworthy); 4) fatigue (e.g., tired, sluggish); 5) tension (e.g., nervous, anxious); 6) vigor (e.g., lively, active); and 7) esteem [35]. The summary index, “Total Mood Disturbance (TMD),” was calculated by subtracting the total score of the two positive subscales (vigor and esteem) from the total score of the five negative subscales (anger, confusion, depression, fatigue, and tension) and then adding 100 points. A lower TMD score indicates a better mood state [36].
Single-bout treadmill training for human participants
For the 30-minute single-bout treadmill exercise intervention, the running protocol included a 5-minute warm-up, followed by a gradual increase in speed to reach an optimal intensity of 70–80% of the age-predicted maximum heart rate (MHR) [37]. This intensity was maintained for 20 min, and the session concluded with a 5-minute cool-down. Participants wore a wireless heart rate monitor (Polar 10 series) throughout the exercise period, allowing the investigator to make speed adjustments as needed to ensure the session met the intensity criteria of the age-predicted MHR. The age-predicted MHR was calculated as 220 beats per minute (BPM) minus the participant’s age in years.
Timeline for human study
All assessments and interventions were conducted individually with each participant on the same day, between 9:00 AM and 12:30 PM. Participants were advised to abstain from consuming alcoholic beverages the day before and to maintain their usual sleep and morning routines. Upon arrival for the testing session, participants received instructions on the exercise protocol from a physical educator, wore the heart rate monitor, and completed the Profile of Mood States (POMS) questionnaire immediately before the exercise session. For re-assessment of mood state using POMS after the exercise session, participants were allowed to rest in a seated position for five minutes before completing the POMS questionnaire a second time.
Animal models and single-bout treadmill training
For the animal study, adult C57BL/6 J male mice (8–9 weeks old) were used for experiments and housed in the Centralized Animal Facility (CAF) at the Hong Kong Polytechnic University. Adult C57 mice were used for behavioral assays, whole c-Fos mapping, in vivo calcium imaging, ELISA, immunofluorescence staining, and western blotting experiments. The CAF also maintained CaMKII-cre mice, APPL1 knockout (KO) mice, and Thy1-YFP mice. CaMKII-cre mice were used for chemogenetic manipulation, APPL1 mice were used for behavioral assays, and Thy1-YFP mice were used for the in vivo dendritic spine imaging. Adiponectin KO mice were obtained from the Jackson Laboratory (Bar Harbor, ME) and housed at the Hong Kong Polytechnic University Shenzhen Research Institute, which were used for the immunofluorescence staining and behavioral assays. All animals were group-housed under a 12-hour light-dark cycle (lights on 8:00–20:00 h) with ad libitum access to food and water. The exact number for each experiment was specified in relevant result or figure legend sections. The detailed protocols for each experiment are shown below.
To replicate the human study groups (with and without symptoms), we established two groups in our animal model: a home cage group (no stress) and a chronic unpredictable stress group (with stress) to evaluate the antidepressant effects of single-bout physical exercise. Mice in the no-stress group were kept in their cages for three weeks without exposure to stressors, while the stressed group underwent a three-week regimen of chronic unpredictable stressors (Table S2) to induce depression-like behaviors.
The single-bout physical exercise protocol was implemented as previously described [38,39,40]. Before the exercise intervention, mice underwent a three-day treadmill adaptation to minimize stress. On day 1, mice were acclimated to the testing room, handling, and treadmill. On day 2, mice were introduced to the treadmill’s incline (25°) for 5 min of adaptation. On day 3, mice experienced a warm-up stage with 5 min of treadmill running at a speed of 5 m/min on a 25° incline. On day 4, the formal 30-minute treadmill training commenced. Following a warm-up at a slow walking speed (5 m/min), mice ran in 30-second intervals with 60-second walking rest periods (5 m/min) between intervals. The exercise session began with speeds increasing gradually from 15 m/min to 20 m/min, then 25 m/min, and finally reaching 30 m/min. The session included 20 running repeats, each consisting of 30 s of running at 30 m/min followed by 1 min at 5 m/min. Speed acceleration to 30 m/min was achieved within 5 s, and deceleration to 5 m/min within 2 s. Both the warm-up and exercise sessions were conducted on a treadmill at 25°. To maintain running speed, mice were gently prodded by hand when they approached the end of the track. As a control, sedentary mice were placed on a stationary treadmill for the same duration in the same environment.
Behavioral tests
Both treadmill adaptation and subsequent behavioral assessments were performed during the dark phase of the cycle to accommodate the nocturnal activity patterns of mice.
Open field test (OFT)
This test evaluates basic locomotor activity and anxiety-like behavior in mice. Each mouse was placed in the center of an open-field apparatus (dimensions: 44 × 44 × 30 cm) under dim lighting conditions (20–30 lux) in the testing room. The movements of the animals were tracked using an automatic monitoring system. The open field was cleaned with 70% ethanol between trials to ensure consistency. We use the first five minutes of recording data for analysis. Anxiety-like behavior was assessed by calculating the percentage of time spent in the center of the apparatus, while locomotor activity was measured by the total distance traveled. Data analysis was conducted using ANYMAZE software (Stoelting Co, Wood Dale, IL, USA).
Sucrose splash test (SST)
This test is commonly employed to assess anhedonia-like behavior, a core symptom of depression [41]. A reduction in grooming behavior in mice is interpreted as a loss of self-care and diminished interest in pleasurable activities. In this test, a 10% sucrose solution is sprayed onto the mice’s fur. Due to the stickiness and rewarding nature of the sucrose, the mice are prompted to initiate grooming behavior. The time spent grooming their body, face, and paws was recorded over 5 minutes. The testing cages were cleaned with 70% alcohol between trials.
Tail suspension test (TST)
This test is commonly employed to assess learned helplessness behavior as another valid indicator for depression. Briefly, the mouse was suspended at the center of a rectangular compartment using tape, with a climb-stopper (plastic tube) positioned around its tail [25]. The movements of the animals were recorded for 6 min using an automatic monitoring camera equipped with software. For data collection, immobility time—defined as the period during which all four limbs ceased struggling or only slight body movement occurred—was manually measured during the last 4 min by two experienced researchers. An increase in immobility time is indicative of heightened depression-like behavior.
Forced swim test (FST)
This test is commonly employed to assess learned helplessness behavior as another valid indicator for depression. Mice were placed in a Plexiglas cylinder (15 cm in diameter, 30 cm in height) filled with water maintained at 25–26 °C, with the water level reaching two-thirds of the cylinder’s height. The immobility of the mice was assessed during the last four minutes of a six-minute test. This evaluation was conducted in a sample-blinded manner by two independent observers using stopwatches. A mouse was considered immobile when it remained floating in the water, making only the minimal movements necessary to keep its head above the surface. An increase in immobility time is often interpreted as an indicator of heightened depression-like behavior.
Brain tissue preparation
The animals were deeply anesthetized with isoflurane (Zoetis, Parsippany-Troy Hills, NJ, USA) and perfused with saline, followed by paraformaldehyde (PFA). The brain tissues were post-fixed in PFA overnight at 4 °C and subsequently immersed in 30% sucrose until they sank. Coronal brain sections (40 µm) were prepared using a vibratome (Leica Biosystems, Wetzlar, Germany). Consecutive 40-µm-thick coronal sections were sliced between 2.34 mm and −3.40 mm from bregma along the rostral-caudal axis. Each brain slice of every 0.7–0.8 mm was selected for immunostaining with antibodies against c-Fos, resulting in a total of nine brain slices per mouse.
Immunofluorescence staining
Brain slices were washed with PBS and incubated with citric acid buffer (10 mM) for 10 min at 95 °C for antigen retrieval and then incubated with 2 N HCl for 10 min at 37 ◦C for denaturing double-strand DNA. After PBS washing, slices were incubated with primary antibodies (Table S3) at 4 °C overnight, followed by a 2-hour incubation with the second antibody (Table S3) at room temperature. In the final step, sections were coverslipped with fluorescent mounting medium with DAPI (Fluoroshield™ with DAPI, Sigma).
Brain-wide c-Fos mapping analysis
Z-stacks of brain slices stained with c-Fos were captured using a 10× objective on a Zeiss confocal microscope. Acquisition settings, including laser power, gain/offset, averaging, and dwell time, were kept constant across all samples. Before quantification, maximum intensity projections of each slice were generated. The intensity of c-Fos expression was calculated for all nine slices using a custom analysis software named “Brein,” developed and shared by Prof. Thomas Südhof’s group at Stanford University. We used “Brein” to quantify cFos-positive signals in anatomically defined brain regions, using the same region-based thresholding and quantification workflow as previously reported [42].
The Brein software locates the positions of nine brain sections within its built-in brain atlas, accurately matching confocal images with the most suitable atlas images and aligning anatomical features of the corresponding brain regions. The “Calculate Intensities” function was employed to analyze the data and export fluorescence intensity measurements to an Excel spreadsheet for further analysis. The statistical results include relative fluorescence intensity values for each region in the brain sections. This experiment specifically focuses on the fluorescence expression of the c-Fos protein, with the level of c-Fos expression directly proportional to its fluorescence intensity, presented as relative fluorescence intensity in the target brain subregions.
Stereotaxic injection of adeno-associated viruses
For adeno-associated virus (AAV) injection, mice were anesthetized with a mixture of ketamine (100 mg/kg) and xylazine (10 mg/kg) and positioned in a stereotaxic apparatus (RWD, Shenzhen, China). Following local sterilization and an incision in the scalp, a high-speed microdrill was used to create bilateral injection holes in the skull. A glass micropipette, connected to an ultra-micro injection pump (Nanoliter2010, WPI, USA) and controlled by an injection controller (Micro4, WPI, USA), was employed for AAV delivery targeting the ACC with coordinates: anteroposterior (AP) 0.8 mm, mediolateral (ML) 0.3 mm, and subpial (SP) 0.6 mm [43]. The micropipette was held in place for 5 min before retraction to ensure proper diffusion. Post-surgery, animals received Flunixin (2.5 mg/kg, subcutaneously) for three consecutive days and were allowed a 3-week recovery period. Detailed information on all viruses used is provided in Table S4.
Clozapine N-oxide treatment
Clozapine N-oxide (CNO, Brand: APExBIO) was dissolved in saline and administered intraperitoneally at a dose of 1 mg/kg. This dosage was utilized for both chemogenetic activation (hM3Dq) and inhibition (hM4Di) experiments, as previously described [44]. In the chemogenetic inhibition experiments, CNO was injected 30 min before treadmill running. For the chemogenetic activation experiments, CNO was administered 2 h before conducting the behavioral tests.
In vivo transcranial two-photon imaging
To image neuronal activity in the ACC region, surgical procedures were performed as previously described [43]. After a 3-week recovery period following AAV injection, which allowed for sufficient target gene expression in the infected neurons, the head skin was opened, and the skull over the ACC was carefully removed using a microdrill. The imaging window was then covered with a round glass coverslip. A customized metal scaffold was affixed to the mouse skull using dental cement. The awake mouse was secured on the imaging stage via the metal bar and allowed to acclimate for 30 min.
During the imaging session, we recorded the activity of ACC-glutamatergic neurons at various time points: pre-exercise, 30 min, 2 h, and 4 h post-exercise. The calcium activity of ACC-glutamatergic neurons, located at a depth of 200 to 300 µm, was recorded at a frequency of 2 Hz using a water-immersed objective on a Nikon A1 MP multiphoton microscope. During imaging, the laser was tuned to a wavelength of 920 nm. Imaging data were analyzed using ImageJ, following previously established protocols [45]. All acquired time series images were corrected by the TurboReg module of ImageJ. The same neurons were circled as regions of interest (ROI) at each time point and analyzed in a sample-blind manner. The fluorescent value of each neuron was normalized as (F − F0)/F0, where the F0 (basal value) was the minimum of all values during each recording series. The average integrated calcium was calculated as the average of ΔF/F0 of all recording neurons.
Enzyme-linked immunosorbent assay (ELISA)
Blood samples were collected from the hearts of the mice and centrifuged to obtain serum. Serum adiponectin levels were measured using commercially available ELISA kits (ImmunoDiagnostics Limited, Cat. No. 32010). Serum samples were diluted 600-fold before performing the ELISA. Proteins were extracted from isolated mPFC and hippocampal tissues. Adiponectin levels in these brain regions were measured using commercially available ELISA kits specific to brain tissues (AdipoGen Life Sciences, AG-45A-0004Y).
Reverse transcription quantitative polymerase chain reaction (RT-qPCR)
Total RNA was extracted from brain cortical tissues at various time points post-exercise using the ReliaPrep™ RNA Tissue Miniprep System (Promega). The RNA was then reverse transcribed into cDNA using the GoScript™ Reverse Transcriptase Kit (Promega). Real-time PCR was performed with the CFX96 Real-Time PCR Detection System (Bio-Rad) and the GoTaq® qPCR Master Mix (Promega). Primer sequences are provided in Table S5. Relative mRNA expression levels were analyzed using the delta-delta Ct (ΔΔCt) method, with normalization to human glyceraldehyde-3-phosphate dehydrogenase (GAPDH) as the internal control.
Acquisition and analysis of image APPL1 nuclear translocation
Brain slices were incubated overnight at 4 °C with primary antibodies against APPL1 and CaMKII (a widely used marker for glutamatergic neurons) [46], followed by a 2-hour incubation with secondary antibodies at room temperature (see Table S3 for details). Subsequently, sections were mounted with a fluorescent mounting medium containing DAPI to label the nuclei (Fluoroshield™ with DAPI, Sigma). Images were captured using a Zeiss confocal microscope at 60x magnification.
To assess the nuclear translocation of APPL1 in neurons, we selected neurons that were double labeled with CaMKII and DAPI staining for analysis. The Region of Interest (ROI) function in ImageJ was employed to delineate the cell contour (using Alexa 568 for CaMKII) and the nucleus (using DAPI staining). These contours were then applied to the APPL1 images (using Alexa 488 for APPL1) to determine the distribution of fluorescence intensity of APPL1 within glutamatergic neurons. All analyses were conducted by two well-trained researchers in a sample-blind manner to ensure objectivity and accuracy.
Preparation of nuclear protein extracts
Cytosolic and nuclear fractions of proteins were prepared using the Minute™ Cytosolic and Nuclear Extraction Kit for Frozen/Fresh Tissues (Cat. No. NT-032). Following exercise, mice were sacrificed, and brain tissues were collected. The tissues were ground with a pestle for approximately 1 min (40–60 strokes). The resulting homogenate was processed to separate cytosolic and nuclear proteins according to the kit’s protocol. Nuclear proteins were subsequently used to assess histone protein acetylation.
Synaptoneurosome and total protein preparations
To extract synaptoneurosome fractions, the mPFC was isolated, homogenized, and purified using the ice-cold Syn-PER Synaptic Protein Extraction Reagent (Thermo Fisher Scientific, Waltham, MA, USA). The homogenates were centrifuged at 1200×g for 10 min at 4 °C to collect the cytosolic fraction, which was then centrifuged at 15,000× g for 30 min at 4 °C. The synaptosomal fraction was resuspended in Syn-PER reagent and used for synaptic protein quantification via western blotting. For total protein extraction, mPFC tissues were homogenized in ice-cold radioimmunoprecipitation assay buffer (Abcam, Cambridge, UK) containing Halt™ phosphatase/protease inhibitor cocktail (Thermo Fisher Scientific, Waltham, MA, USA). Samples were centrifuged at 14,000×g for 30 min at 4 °C.
Protein concentrations of synaptoneurosome and homogenates were quantified using the Bradford assay (Bio-Rad Laboratories, Hercules, CA, USA).
Western blotting
A total of 30 µg of protein from each sample was loaded and separated using SDS–polyacrylamide gel electrophoresis, followed by transfer to polyvinylidene fluoride (PVDF) membranes (Bio-Rad Laboratories, Hercules, CA, USA). The membranes were blocked with 5% bovine serum albumin (Sigma-Aldrich, St. Louis, MO, USA) for 1 h and then incubated overnight with primary antibodies (see Table S3 for details). After washing, the membranes were incubated with HRP-linked secondary antibodies (Table S3) for 1 h at room temperature. Protein bands were visualized using an imaging system (Bio-Rad, Hercules, USA) and analyzed with ImageJ software (National Institutes of Health, Bethesda, USA).
For quantification in western blotting, total protein and nuclear protein extracts were used to measure total histone H4 and acetylated H4, respectively. Tubulin and histone H3 served as internal controls for total and nuclear extracts, respectively. Synaptoneurosomes were utilized to assess synaptic protein expression, with tubulin or actin as internal control.
Cannula implantation and drug infusion
For cannula implantation, male mice aged 6 to 7 weeks were deeply anesthetized with a mixture of ketamine (100 mg/kg) and xylazine (10 mg/kg) and secured on a stereotaxic frame (RWD Life Science). Guide cannulas (RWD Life Science) were bilaterally implanted into the ACC with coordinates anteroposterior +0.8 mm, mediolateral ±0.4 mm, and dorsoventral −0.9 mm from the bregma. The cannulas were affixed to the skull using dental cement and three skull screws. Metal cannula caps (RWD Life Science) were applied to prevent damage from gnawing. Following implantation, mice were allowed a 2-week recovery period and were pre-handled by the researcher one week before the exercise intervention to minimize stress.
As previously described, importazole was dissolved in dimethyl sulfoxide (DMSO) to achieve a final concentration of 40 μM and administered at 0.3 μl per side for the cannula infusion and local drug infusion experiments [47]. The peptides Tat-APPLNLS (YGRKKRRQRRRRRASEKQKEIERVKEK) and TatAPPL1Scr (YGRKKRRQRRRRRASEKQKEIEAAAAA) were synthesized by Genscript (Shanghai, China), dissolved in artificial cerebrospinal fluid to a final concentration of 10 μg/μl, and locally injected at 0.2 μl per side via bilateral cannulas [47].
For the cannula drug infusion, mice were lightly anesthetized with isoflurane in a glass chamber for 10–15 s. The metal cap was removed from the guide cannula, and injection cannulas (RWD Life Science) were inserted. Importazole was bilaterally infused into the ACC using microinjection at a flow rate of 0.1 μl per minute. Following the infusion, the injection cannula was left in place for 5 min to facilitate solution diffusion. Mice were lightly anesthetized again with isoflurane to remove the injection cannula and secure the cap. After a 10-min rest period, the mice returned to a normal awake state and subsequently underwent treadmill intervention.
Dendritic spine imaging
To image the ACC region, we employed a surgical procedure like previously described but with minor adjustment [48]. Before the imaging experiments, Thy1-YFP male mice underwent surgery to create a glass window analogous to a calcium imaging window. We utilized a Nikon A1 MP multiphoton microscope (Nikon, Japan) with a laser excitation wavelength of 920 nm to visualize dendritic spines. During imaging sessions, mice were head-fixed and kept awake to ensure stability and accuracy.
To accurately target the ACC region, imaging was conducted within 0–400 μm of the midline, demarcated by the sagittal sinus, and consistent imaging parameters were maintained across different time points. Each Thy1-YFP mouse was imaged in the same field of view by referencing the same blood vessel for precise localization. For the importazole infusion experiment, Thy1-YFP mice were imaged at a 2-hour time point to assess changes.
The dendritic spine analysis was conducted in accordance with the methods outlined in prior studies [45, 49]. To assess spine formation and elimination rates, the same dendritic segments were examined at various time points, using the initial spine count from the first imaging session as a reference. Spines were classified as stable if visible in both views, as eliminated if seen in the first view but absent in the second, and as newly formed if only appearing in the second view. The rates of spine elimination and formation were determined by dividing the number of spines eliminated or formed in the second view by the total number of spines in the first view. For each mouse, 80–100 spines were counted.
Statistical analysis
For the animal experiment, no formal statistical methods were used to estimate sample size. The number of animals per group was chosen based on previous studies and ethical guidelines that comply with the 3 R rules. Mice/samples used in our experiment were randomly assigned to each conditioning treatment. No data were excluded from analysis. The investigator was not blind to group allocation due to the requirement for intervention during the experiment, but was double-blinded to the outcome assessment. In the clinical study, neither the participants nor the experimenter was blind to the conditions of the study due to the characteristics of the intervention (i.e., physical exercise). All figures have been provided with the description of statistical tests of appropriate justification, and estimates of variation within each group (mean ± standard deviation) in the corresponding figure legend.
Figures and data analyses were conducted using GraphPad Prism 9 (GraphPad Software, USA). Data normality was assessed using the Shapiro–Wilk test for sample sizes less than 8, or the D’Agostino and Pearson test for sample sizes of 8 or more. Clinical data were analyzed using two-way RM ANOVA followed by Bonferroni’s multiple comparisons test. In pre-clinical data involving two independent variables, a two-way ANOVA followed by Tukey’s post hoc test for multiple comparisons was applied. For comparisons between two individual groups with normally distributed data, an unpaired t-test was used. For non-parametric data, the Mann-Whitney test was employed. When comparing more than two groups with a single variable, a one-way ANOVA was performed, followed by Dunn’s multiple comparison test for comparisons with the baseline, or Tukey’s multiple comparison test for comparisons between groups. Data were presented as mean ± SEM. Statistical significance was denoted as follows: *P < 0.05, **P < 0.01, ***P < 0.001, ****P < 0.0001.