
Baseline characteristics
The COPDGene Study includes 10,198 current and former individuals that smoke. We identified 144 individuals who met the definition of genetic resilience, 362 genetic risk-matched individuals with COPD, and 420 individuals who met the definition of clinical resilience (Table 1).
Table 1 Subject characteristics by resilience subtype
We excluded 24 individuals who met the definition of both genetic and clinical resilience. Compared to genetic risk-matched individuals with COPD, genetically resilient individuals were younger, more likely to be African-American, more likely to be current individuals that smoke, had fewer pack-years, and less likely to have self-reported asthma. There was no difference in gender or BMI. Similarly, compared to low genetic risk individuals with COPD, genetically resilient individuals were younger and had fewer pack-years (Table S1). Compared to clinically resilient individuals, genetically resilient individuals were slightly younger, more likely to be African-American, had higher PRS, had higher BMI, and were less likely to have asthma. There were no differences in age, gender, current smoking status, or smoking pack-years. While there was no difference in peripheral vascular disease or comorbidity count, as defined by Putcha et al. [28], genetically resilient individuals were less likely to have atherosclerotic cardiovascular disease (stroke or heart attack) and had lower coronary artery calcium score compared to genetic risk-matched cases (Table S2). Conversely, there was no difference in atherosclerotic cardiovascular disease between genetically resilient and clinically resilient individuals.
Compared to both genetic risk-matched individuals with COPD and low genetic risk individuals with COPD, genetically resilient individuals without COPD had less disease severity as evidenced by higher FEV1 percent predicted, six-minute walk distance, lower SGRQ total score, lower BODE index, lower rate of bronchodilator response, and lower % LAA < −950 HU, lower percent gas trapping, higher Perc15, and lower Pi10. After additionally matching on age, race, and smoking pack-years, these differences persisted (Table S3). After adjustment for age, gender, race, current smoking status, smoking pack-years, BMI, and the first five principal components of genetic ancestry, the differences in FEV1 percent predicted between genetically resilient individuals and genetic risk-matched individuals with COPD remained significant (β = 35.9%, p < 0.001),
Compared to clinically resilient individuals, genetically resilient individuals demonstrated greater disease severity but similar amounts of emphysema, with a lower FEV1 percent predicted, lower six-minute walk distance, greater likelihood of having bronchodilator response, more gas trapping and higher Pi10, but no difference in % LAA < −950 HU or Perc15. After matching on age, race, and smoking pack-years, there was no difference in FEV1% predicted, 6MWD, bronchodilator response, but the differences in SGRQ, BODE index, gas trapping, and Pi10 persisted. In multivariable analysis, the difference between in FEV1 percent predicted between genetically resilient individuals and clinically resilient individuals was no longer significant (β = −1.5%, p = 0.144). Similarly, the difference in % LAA < −950 HU and Perc15 between genetically resilient individuals and risk-matched individuals with COPD persisted after adjustment for the covariates above as well as CT scanner model.
In sensitivity analyses comparing genetically resilient individuals who remain resilient at Phase 2 to clinically resilient individuals, genetically resilient individuals again had higher SGRQ, BODE index, and more gas trapping (Table S4). However, there was no difference in six-minute walk distance, FEV1 percent predicted, bronchodilator response, and Pi10. In non-Hispanic white individuals, the differences were similar between genetically resilient individuals and both genetic risk-matched individuals with COPD and clinically resilient individuals were similar to the larger population (Table S5). However, in African-American individuals, while the differences between genetically resilient individuals and genetic risk-matched individuals with COPD were similar, there was no difference in FEV1 percent predicted, % LAA < −950 HU, Perc15, or Pi10 (Table S6). After adjustment for age, gender, current smoking status, smoking pack-years, BMI, and ancestry-specific principal components, the differences in FEV1% predicted between genetically resilient individuals and both genetic risk-matched individuals with COPD (βNHW = 33.9%, p < 0.001; βAA = 35.4%, p < 0.001) and clinically resilient individuals (βNHW = −1.7%, p = 0.2; βAA = −1.4%, p = 0.4) were similar to the overall population.
Longitudinal outcomes across resilience subtypes and genetic risk-matched individuals with COPD
We examined the progression (i.e., change in COPD status) of individuals categorized into the resilience subtypes and genetic risk-matched individuals with COPD across the 5-year (Phase 2) and 10-year (Phase 3) visits. Among the genetic resilience group, 91 individuals (63.2%) remained resilient with 21 individuals (14.6%) progressing to COPD, 23 individuals (15.9%) progressing to PRISm, and 9 individuals (6.3%) had incomplete follow-up at Phase 2 (Fig. 2).
Fig. 2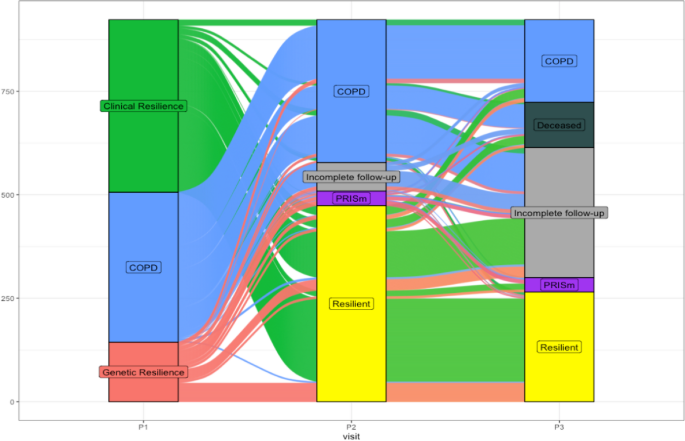
5-year and 10-year follow-up visit COPD status by resilience subtype. Alluvial diagram demonstrating flow of individuals from resilient subtype at baseline visit across 5-year and 10-year follow-up visit. COPD – chronic obstructive pulmonary disease; PRISm – preserved ratio impaired spirometry
At Phase 3, among individuals who had data through Phase 2, 20 individuals (13.9%) from the original genetically resilience group (n = 144) progressed to COPD, 14 individuals (9.7%) progressed to PRISm, 52 individuals (36.1%) remained resilient, 10 individuals (6.9%) had died, and 48 individuals (33.3%) had incomplete follow-up. The change in COPD status for the clinical resilience group and genetic risk-matched individuals with COPD are available in the supplement. Overall, excluding individuals who were lost to follow-up at Phase 3, while 71.6% of the clinically resilient group remained resilient at Phase 3, 54.2% of the genetically resilient group remained resilient at Phase 3.
We compared the change in clinical parameters from the baseline Phase 1 visit and the Phase 2 and 3 visits (Table 2).
Table 2 Change clinical measures at 5-year and 10-year follow-up by resilience subtype
While there was no difference in FEV1 percent predicted, SGRQ total score, and six-minute walk distance, genetically resilient individuals showed a larger decrease in FEV1 in milliliters and a decrease in % LAA < −950 HU compared to genetic risk-matched cases. On the other hand, clinically resilient individuals had an increase in both FEV1 percent predicted and FEV1 in milliliters compared to genetically resilient individuals, but no difference in SGRQ total, six-minute walk distance, and % LAA < −950 HU. The pattern of change was similar from Phase 1 to Phase 3 across both comparisons.
We performed univariable and multivariable survival analyses across the three groups. A Kaplan-Meier curve is displayed in Fig. 3.
Fig. 3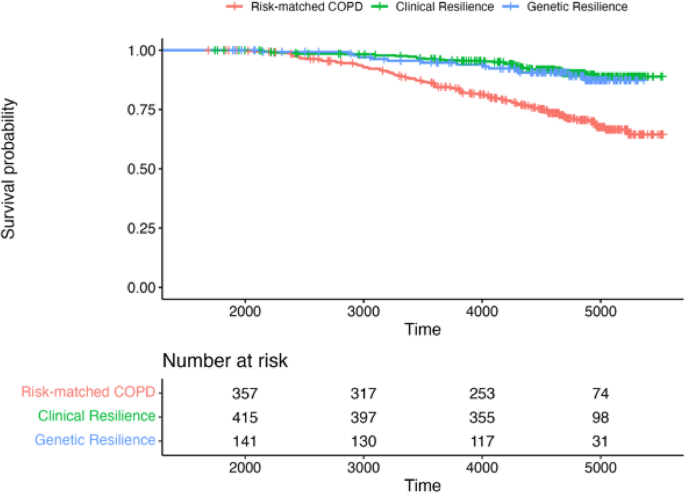
Survival probability after Phase 2 by resilience subtype. Kaplan-Meier curve demonstrating survival probability over time between genetic resilience, clinical resilience, and genetic risk-matched COPD. Time measured in days. COPD– chronic obstructive pulmonary disease
In a Cox proportional hazards model adjusted for age, race, gender, current smoking status, smoking pack-years, and BMI, when compared to individuals with COPD and high genetic risk, both clinical resilience (HR 0.34, 95% CI 0.23–0.50, p < 0.001) and genetic resilience (HR 0.41, 95% CI 0.23–0.73, p = 0.003) were associated with improved survival. In a separate Cox proportional hazards model directly comparing genetic and clinical resilience, there was no difference in survival (HR 0.78, 95% CI 0.41–1.47, p = 0.45). The proportional hazards assumptions were not violated in tested models.
Environmental and biological contributors to resilience
Given the observed differences in clinical, radiographic, and longitudinal characteristics between genetic and clinical resilience, we sought to identify possible etiologic differences. We found that genetically resilient individuals had higher (i.e., worse) SVI socioeconomic percentile, SVI minority status/language percentile, SVI housing type/transportation percentile, and SVI overall percentile compared to both genetic risk-matched individuals with COPD and clinically resilient individuals (Table 3).
Table 3 Social determinants of health among COPD resilience subtypes
In addition, SVI household composition percentile was higher in genetically resilient individuals compared to clinically resilient individuals but not risk-matched individuals with COPD. Finally, the ADI state rank was higher for genetically resilient individuals compared to clinically resilient individuals but not genetic risk-matched individuals with COPD. We performed multivariable analyses, adjusted for age, gender, current smoking status, smoking pack-years, educational attainment, income category, insurance status, and ancestry-specific principal components, to test for the association of resilience subtype with SVI overall percentile after stratifying by race. While there was no difference in SVI overall percentile between African-American genetically resilient and clinically resilient individuals, the SVI overall percentile was significantly higher in non-Hispanic white genetically resilient individuals compared to non-Hispanic white clinically resilient individuals (βNHW = 0.09, p = 0.001). There was no difference in ADI state rank after stratification by race and adjustment for covariates between genetically resilient individuals and both comparison groups.
We examined protein expression between genetically resilient individuals and the two comparator groups, specifically selecting proteins that were previously examined in the clinical resilience study [29]. Compared to genetic risk-matched cases, there was no difference in CRP, Fibrinogen, tumor necrosis factor receptor super family member (TNFRSF) 1 A, and TNFRSF1B levels in blood in genetically resilient individuals (Table 4).
Table 4 Expression of proteins associated with COPD across resilience subtypes
Conversely, there were reduced CRP and TNFRSF1B levels in clinically resilient individuals compared to genetically resilient individuals.