
Sample collection
This is a retrospective cross-sectional study conducted in compliance with the ethical principles for medical research involving human subjects as outlined in the Declaration of Helsinki. Ethical approval was granted by the Ethics Committee of XXX Hospital of Stomatology, XXX University. Prior to undergoing CBCT scanning for oral examinations, all patients provided written informed consent, explicitly authorizing the use of their scan data for educational and research purposes.
We retrieved and screened CBCT data from the archives of XXX Hospital of Stomatology, XXX University, cross-referencing corresponding medical records for the period 2020–2023. All CBCT images included in this study were acquired by the same experienced technician using the identical equipment (Smart3D-X). The scanning parameters were strictly standardized as follows: 100 kV, 6 mA, exposure time of 26.9 s, field of view of 23 × 18 cm, and voxel size of 0.25 mm. CBCT data were included in the study based on the following criteria:
Including criteria: (1) age > 18 years; (2) Chinese population; (3) CBCT images from patients without history of facial plastic surgery and dental treatment; (4) complete maxillary dental arch; (5) no obvious facial deformities; (6) no unilateral chewing habits. Excluding criteria: (1) history of orthodontic or functional orthopedic therapy, orthognathic surgery, or plastic surgery; (2) cleft lip and palate, other craniofacial anomalies, or a history of craniofacial trauma; (3) history of septoplasty or rhinoplasty; (4) temporomandibular joint disorders; (5) functional mandibular protrusion or retrusion; (6) permanent tooth loss; (7) unilateral chewing habits.
Sample size calculation: In line with the American Board of Orthodontics Objective Grading System (ABO OGS), a measurement difference of less than 0.5 mm is deemed to be clinically insignificant. From a clinical standpoint, DSCA emerged as the most sensitive and representative indicator among the NSD parameters. Therefore, we utilized DSCA to estimate the required sample size using the G*Power software (version 3.1.9.7). For a two-tailed test, we set the alpha (α) level at 0.05 and the statistical power at 80.0%. A minimum sample size of 16 participants per subgroup was determined to be necessary to detect a significant difference in the DSCA values across the mild, moderate, and severe groups. A total of 114 subjects were enrolled in this study, with the smallest subgroup containing 19 participants.
Measurement items and procedures
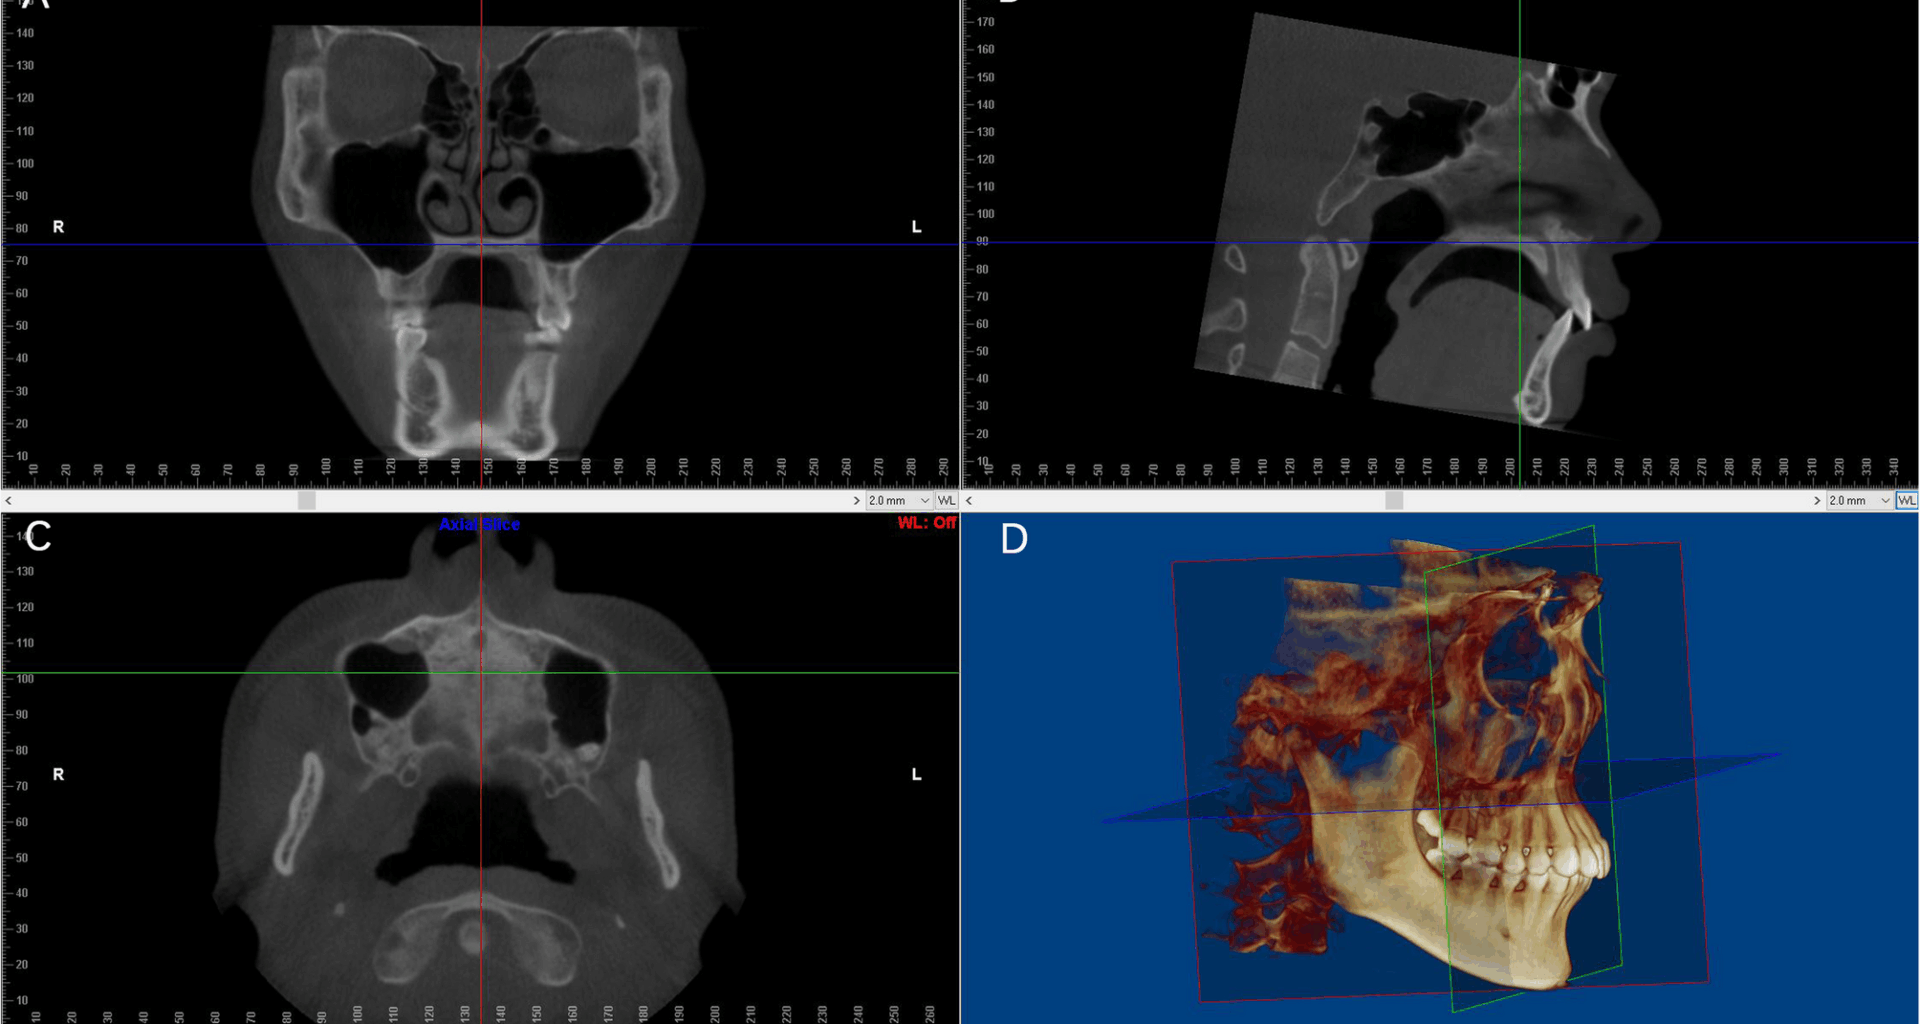
CBCT data saved in DICOM format were imported into Dolphin software (version 11.8; Dolphin Imaging and Management Solutions, Chatsworth, CA, USA) for measurement. Prior to measurement, each subject’s CBCT image was subjected to three-dimensional adjustment, following protocols adapted from previous studies with minor modifications [8, 11,12,13,14]. Specifically: In the coronal view, the red reference line was positioned to coincide with the median sagittal plane. In the sagittal view, the skull was rotated to align the blue reference line with the palatal plane. In the axial view, the skull was rotated to ensure the red reference line equally separated the cervical vertebrae. A recheck in the coronal view confirmed that the blue reference line ran parallel to the horizontal part of the palatine bone (Fig. 1).
Fig. 1
Standard Head Position Adjustment. A In the coronal view, the blue reference line passes through the horizontal part of the palatine bone, while the red reference line aligns with the median sagittal plane. B In the sagittal view, the blue reference line coincides with the palatal plane. C In the axial view, the red reference line passes through the anterior nasal spine and equally bisects the cervical vertebrae. D The adjusted 3D coordinate system
Transversal measurement items for the nasal septum, maxilla, dentoalveolar structures, and cranium were established using slices of varying dimensions, as defined in Table 1 and illustrated in Fig. 2. For the measurement of nasal septum deviation (NSD) on coronal slices, the view displaying the most significant deviation was selected, and NSD parameters (SDA, DSW, DSCA, SVL) were quantified (Fig. 2A). Parameters of the zygomatic bone (ZF-MA, ZM-MA), orbital bone (IC-MP, IO-MA), maxillary sinus (MSN-MP, MSO-MP, MS-MA), and palatal bone (HPT, MP-MP, PAD, PA-MA, HP-MA) were measured on the coronal slice (Fig. 2B) that, in the sagittal view, equally divides the palatine plane into anterior and posterior segments (green reference line in Fig. 1B). For molar parameter measurements (BMA-MP, LMA-MP, PA-MP, MM-MP, MMA-HA, LA-MA), the coronal slice was specifically positioned at the buccal groove of the maxillary first permanent molars (Fig. 2B). Parameters of the temporomandibular joint (MSF-MP, LSF-MP) were assessed on the coronal slice passing through the maximum cross-sectional area of the condyles (Fig. 2I). Other parameters, including those of the canine (MC-MP, Fig. 2C), pterygoid plate (LPP-MP, Fig. 2D), frontozygomatic suture (FS-MP, Fig. 2E), temporozygomatic suture (TS-MP, Fig. 2F), and orbit (LO-MP, Fig. 2G; MO-MP, Fig. 2H), were measured at different levels of axial slices. The definitions of the aforementioned measurements were referenced from previous studies [13], and XXX performed the whole measurements.
Table 1 Definitions of measuring parametersFig. 2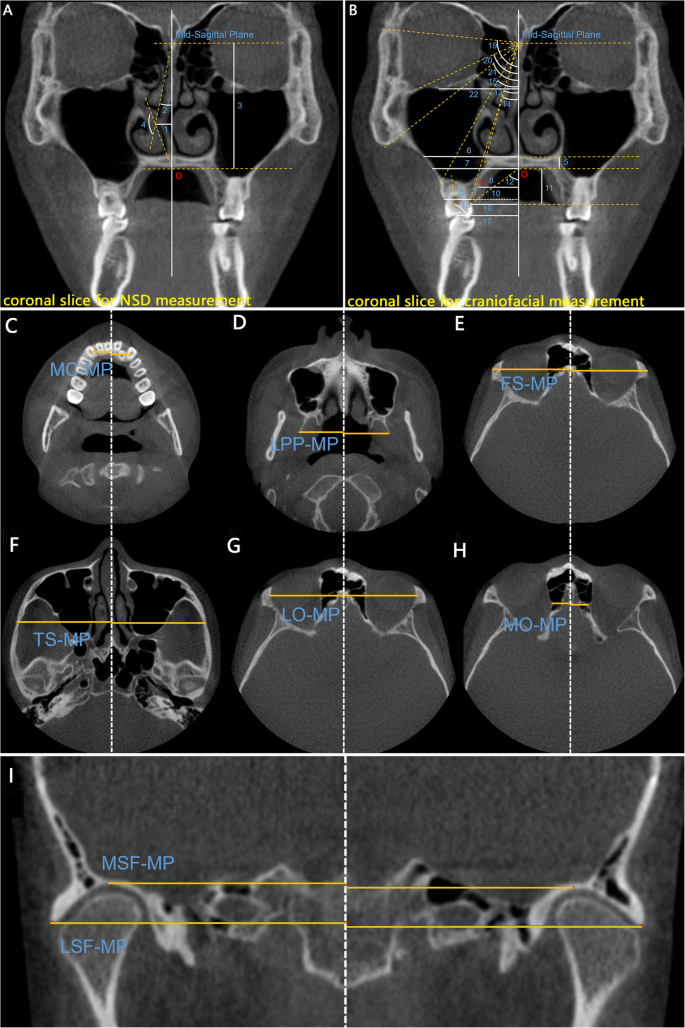
The diagram of NSD and craniofacial angular and linear measurements. A Measurement of NSD in coronal slice at the most deviated of the nasal septum: (1) DSW, (2) SDA, (3) SVL, (4) DSCA; (B) Measurement of craniofacial in the coronal slice located at the coronal slice equally dividing the palatine plane into anterior and posterior parts: (5) HPT, (6) MSN-MP, (7) MSO-MP, (8) MP-MP, (11) PAD, (12) PA-MA, (14) HP-MA, (15) MS-MA, (19) ZF-MA, (20) IO-MA, (21) ZM-MA, (22) IC-MP. The parameters, including (9) BMA-MP, (10) LMA-MP, (13) LA-MA, (16) PA-MP, (17) MM-MP, (18) MMA-HA, are measured in the coronal slice located at the buccal groove of the maxillary first permanent molars. The parameters, including the structures canine (C,MC-MP), sphenoid lateral pterygoid plate (D,LPP-MP), frontozygomatic suture and temporozygomatic suture (E,FS-MP;F, TS-MP), orbital rim (G,LO-MP;H,MO-MP), and temporomandibular joint fossa (I,LSF-MP/MSF-MP), were measured in axial views at different level. Point “O” is the intersection point of the middle sagittal line and the palatal bone at oral side. Point “A” is the intersection point on the palatal alveolar ridge in half the height of alveolar bone. All the measurement items were sorted by numbers and the corresponding definitions were provided in Table 2
Table 2 The analysis of inter- examiner and intra-examiner reliability (n = 20)
To investigate the relationship between nasal septum deviation (NSD) and transversal asymmetry of craniofacial structures, a two-step analysis was conducted: 1. The first step involved analyzing the correlation between NSD and craniofacial asymmetry, followed by selecting NSD variables that exhibited significant associations.2. The second step aimed to verify the effectiveness of these NSD variables in distinguishing craniofacial asymmetry by comparing subgroups classified according to NSD severity. Subjects were categorized into three subgroups (mild, moderate, and severe) based on established NSD severity criteria [8, 11], as follows:
For SDA: mild (≤ 9°), moderate (9–15°), and severe (≥ 15°);
For DSW: mild (< 5.08 mm), moderate (5.08–7.38 mm), and severe (≥ 7.38 mm);
For DSCA: mild (> 155°), moderate (148–155°), and severe (≤ 148°).
Statistical analysis
Data analysis was performed using IBM SPSS software (version 27.0; IBM Corp., Chicago, IL, USA). Due to violations of the Shapiro-Wilk normality test, non-parametric tests were employed for enhanced robustness. To assess measurement reliability, XXX conducted the intra-observer measurement on 20 randomly selected CBCT subjects, and XXX performed the inter-observer measurement after a two-month interval. Intraclass correlation coefficients (ICC) and Wilcoxon signed-rank tests were used to evaluate intra- and inter-examiner reproducibility, respectively. The craniofacial parameters were the side-to-side differences in transverse measurements, and Spearman correlation analysis was applied to explore relationships between NSD and craniofacial indicators. Subgroup differences stratified by the severity of NSD variables were analyzed using the Kruskal-Wallis H test, followed by Conover-Iman post-hoc tests and Bonferroni adjustment to get the adjusted P values. Correlation coefficients were denoted as ‘γ’, with significance levels set as follows: *P < 0.05, **P < 0.01, ***P < 0.001, and ns (non-significant) for P > 0.05.