
The Greenland Ice Sheet — the second largest ice sheet on Earth — has been melting at its fastest rate in 12,000 years due to rising surface temperatures caused by man-made climate change, according to a 2020 study. The resulting meltwater now ranks among the greatest contributors to global sea level rise and threatens to destabilize major ocean circulation systems.
But two recent articles co-authored by Brown Professor of Environmental Studies Laurence Smith suggest that current measurements and simulations may not adequately consider processes that retain meltwater occurring on the Ice Sheet, leading to overestimations of meltwater runoff.
Current climate models are “largely right,” Smith said. But they pass over how meltwater can refreeze or pond instead of flowing into the oceans, which can lead to “10% to 15%” corrections, he explained.
While these adjustments are “more like tinkering around the edges,” Smith said researchers still “want the best physical understanding possible to get into these models.”
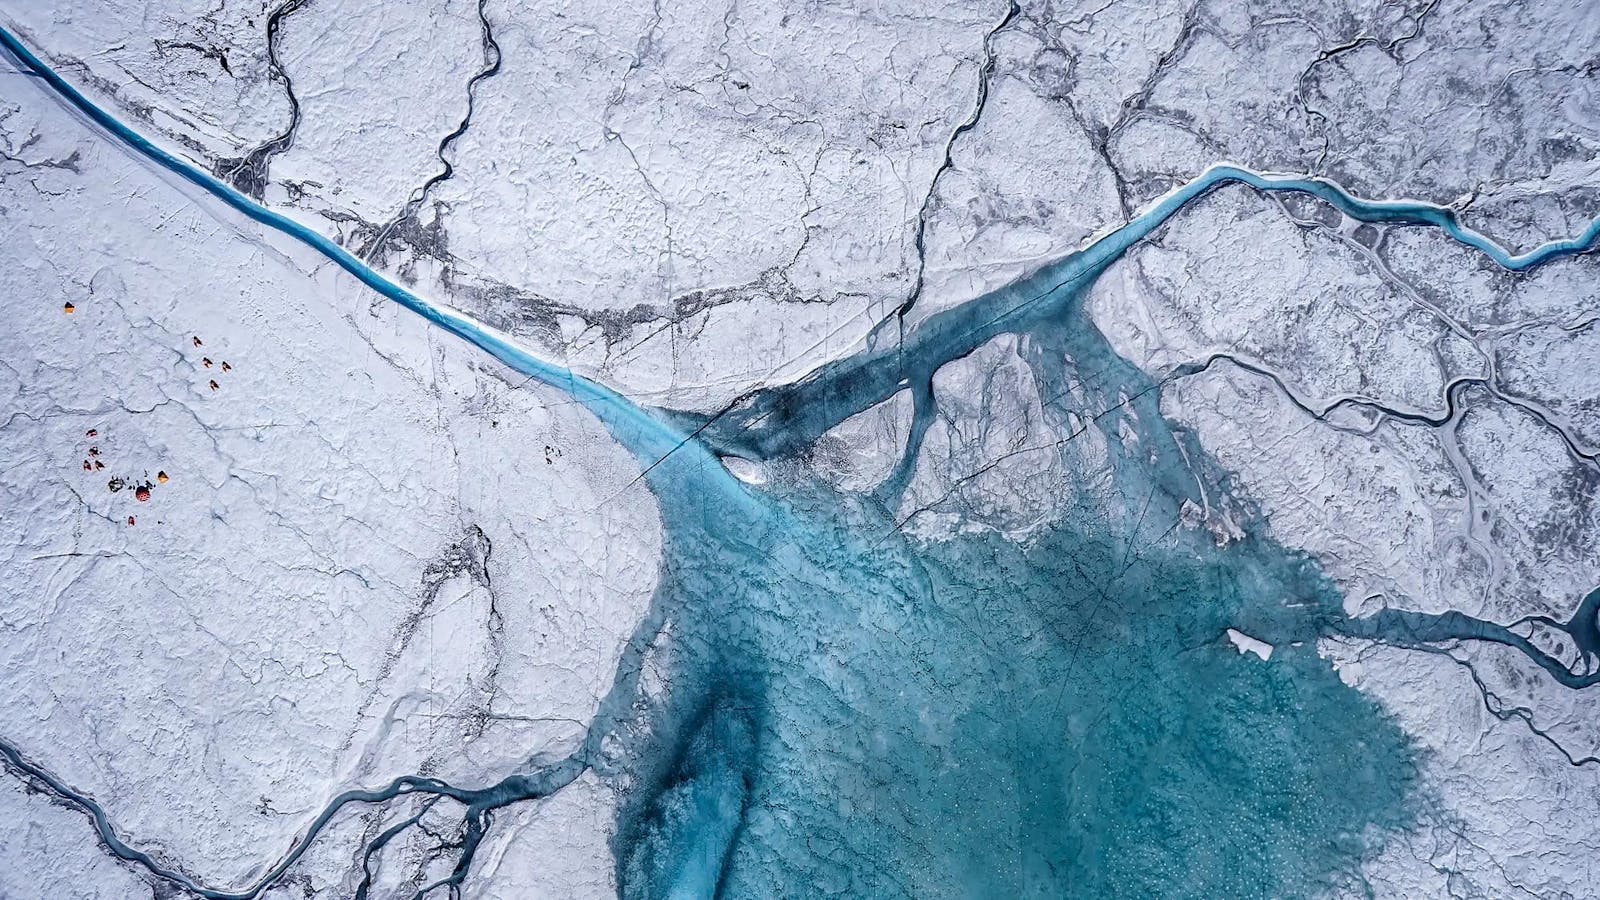
As part of their research, Smith and his collaborators conducted fieldwork in Greenland’s southwestern region. They focused on the ablation zone of the Ice Sheet, a lower-elevation area where more snow is lost than accumulated every year.
“Each summer, the seasonal snowpack melts away completely in this zone, exposing dark, bare ice that absorbs more sunlight and drives further melt,” wrote Matthew Cooper, who was the lead author on one of the papers and a climate researcher, in an email to The Herald.
Knowing that climate models were very likely overestimating meltwater runoff, the researchers found that meltwater refreezing in the porous ice surface is likely a major cause of inaccuracies.
The researchers measured the flow rate of a river in which meltwater was draining on the surface of the Ice Sheet using an instrument that “beams sound waves down into the water” to compute the water’s speed and depth, Smith said.
Courtesy of Matthew Cooper
The team also drilled small holes along the watershed perimeter, inserting bamboo stakes that water would refreeze around overnight. Over the course of a few days, the height between the top of the stake and the ice was measured to quantify the volume of ice lost. Because the researchers saw that the volume of ice lost did not equal the volume of water flowing out of the river, they realized that meltwater was somehow being retained, Smith explained.
Leveraging computational modeling of the bare ice surface, the study demonstrated that meltwater produced during the daytime fills into the pore spaces of the top layers of the ice. But at night, temperatures plunge and the meltwater refreezes, Smith explained. In the following days, heat is dedicated towards re-melting that same body of ice, rather than generating new runoff, according to the study.
Projecting the findings across the entire southwestern region of the Ice Sheet, the mass of meltwater “retained and refrozen within porous bare ice” amounts to “roughly 11 to 17 gigatons per year, equivalent to about 9% to 15% of modeled annual runoff from that sector,” Cooper wrote.
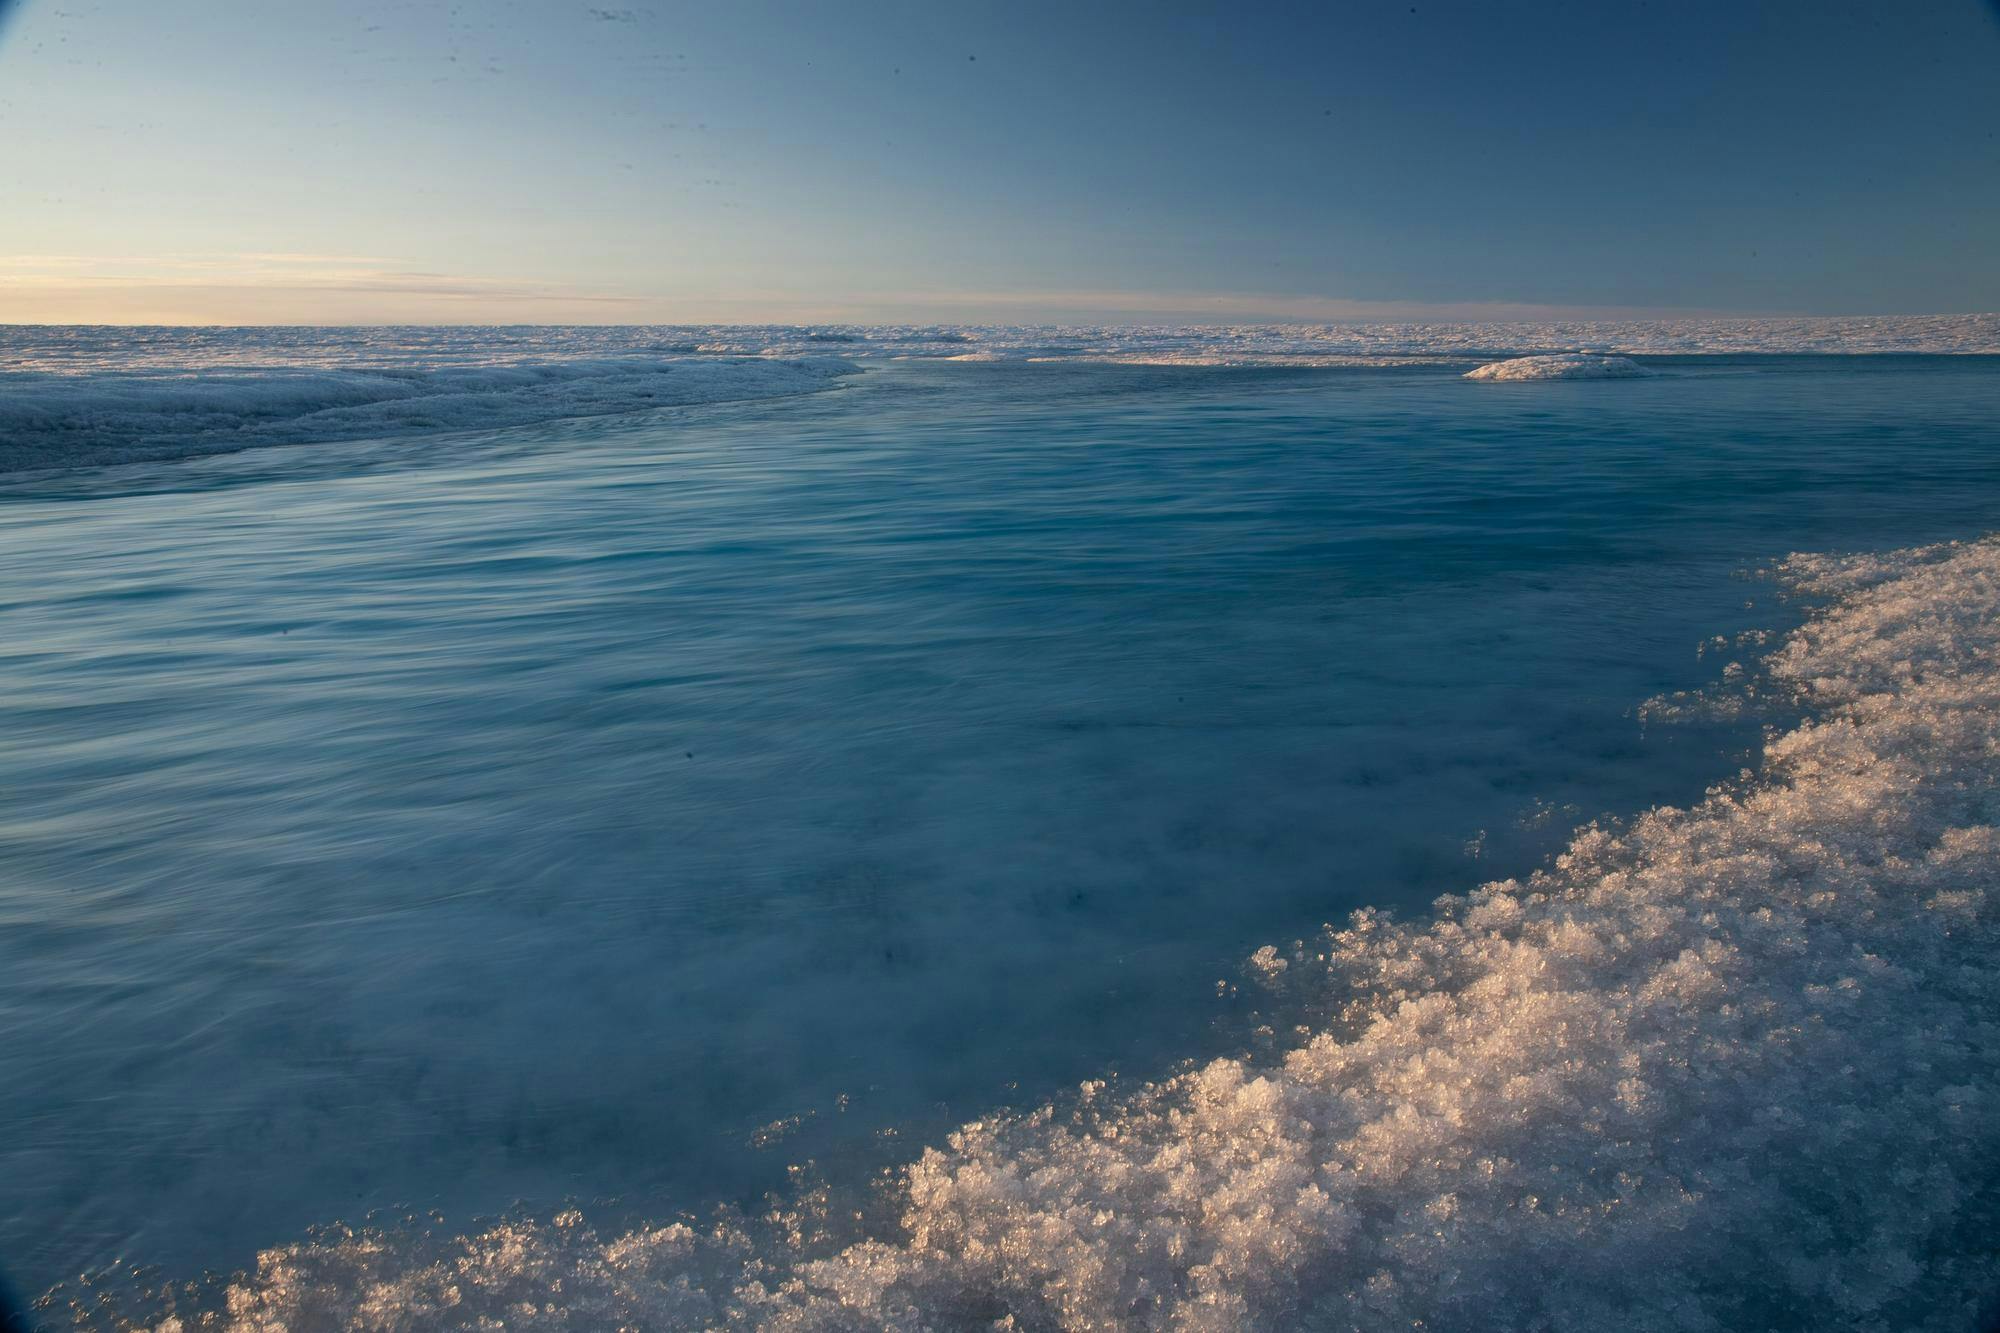
In flatter areas of the ablation zone, meltwater tends to pond, kickstarting a positive feedback loop that warms the Ice Sheet and furthers long-term melting. In a second study, Smith and his team worked to understand the warming effect caused by these ponds.
Ice sheets, which are usually white, have high albedo, or reflectivity. But when air temperatures rise and ice begins to melt and pond, “the Ice Sheet becomes darker,” said Jonathan Ryan, lead author and assistant professor of ice and climate sciences at Duke University, in an interview with The Herald.
This allows it to “absorb more solar radiation, and it melts faster,” added Ryan, who was formerly a postdoctoral researcher at the Institute at Brown for Environment and Society.
Because satellites lack the resolution to capture smaller surface meltwater reservoirs on the Ice Sheet, the team launched drones into the air that took pictures of the Ice Sheet at different GPS points.
Ryan then overlapped satellite maps of water on the Ice Sheet with maps showing the region’s albedo. By computing the difference between the reflectivity of areas filled with surface water and that of areas with no water, he showed how albedo varies with water coverage. He was then able to quantify heating of the newly documented meltwater by applying this relationship to the drone images, Ryan explained.
According to the study, meltwater ponding accounted for around 1% of the total heating from sunlight across the entire Greenland Ice Sheet in the summer of 2019. But depending on the time of year, elevation and the size of a given area, ponding can lead to a much greater proportion of albedo variability and heating.
Get The Herald delivered to your inbox daily.
Courtesy of Matthew Cooper
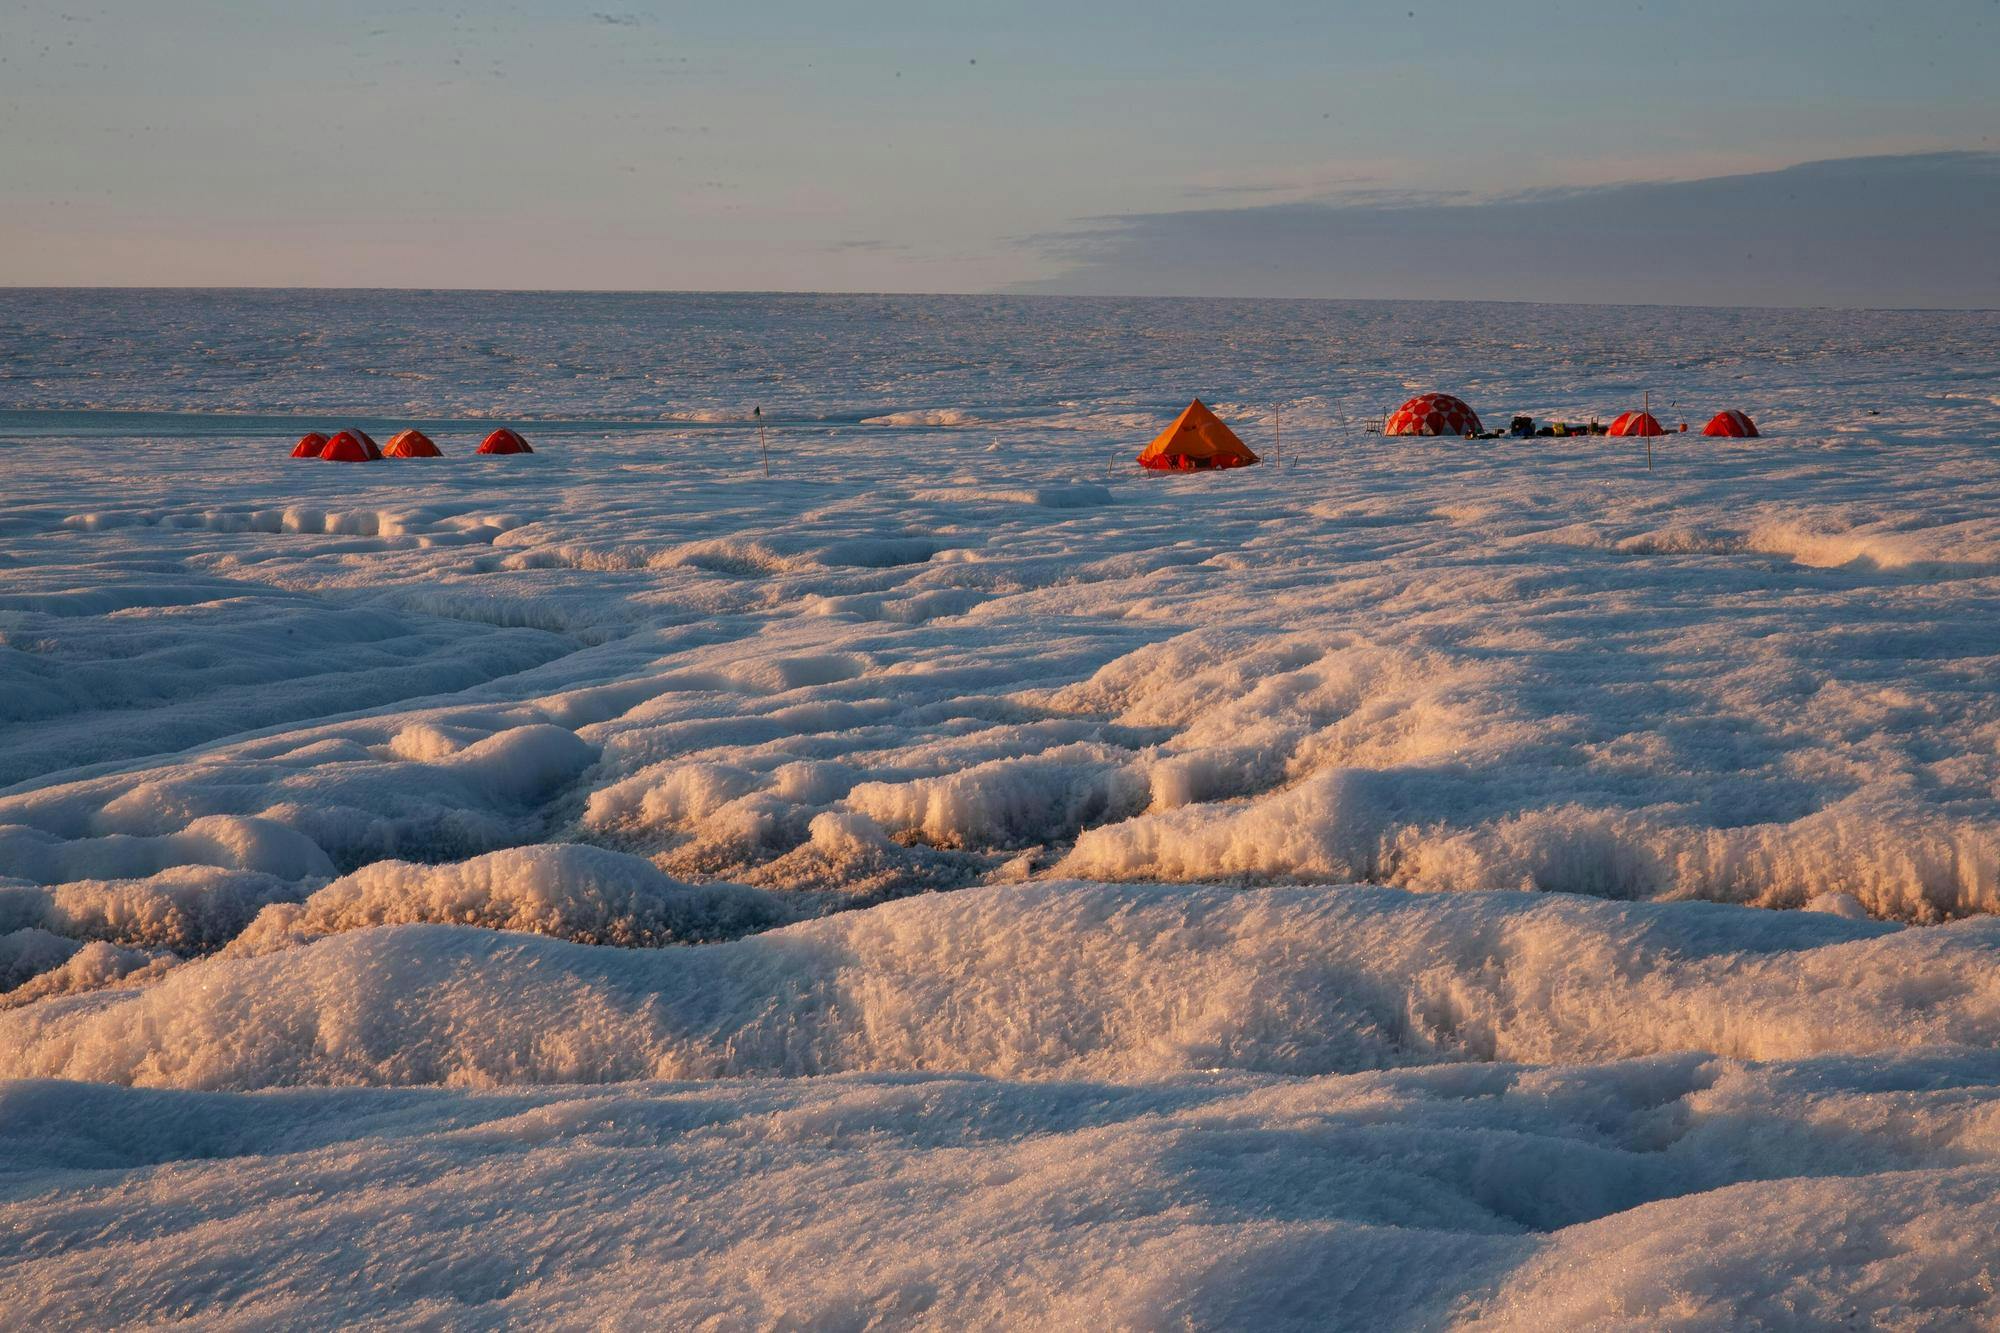
The fieldwork supporting the research in these studies is “intense,” Smith said. For Ryan, doing the fieldwork was “very rewarding.”
“We camp right in the melt zone, pitch our tents, there’s water flowing all over the place,” Smith said. “We have to tether into harnesses and ropes (and) mark off a safe perimeter of the camp because there’s cracks and … slippy-sliding water.”
“I think it’s the reason why we all go into this field, to have these cool experiences where you have to perform at a high level,” Ryan said. “There’s a lot of time for being stressed, and there’s also a lot of time for having fun and working really well as a team.”
In the future, Smith and his research team aim to continue bridging the energetic processes captured in climate models with additional modeling to “describe what’s happening on and under the Earth’s surface,” which have yet to be thoroughly explored in the Greenland Ice Sheet, Smith said.