
The intervention was operational from 1 April 2019-30 September 2021 in Harare, 1 July 2019-15 December 2021 in Bulawayo, and 14 October 2019-31 March 2022 in Mashonaland East (Supplemental Fig. 1). All components were available from the beginning of the service, except for syphilis testing (introduced on 4 December 2020) and text messages (introduced on 25 January 2021) as shown in the figure. In total 36,991 clients attended, for a total of 78,809 visits; 40.6% (N = 15,034) of clients returned for > 1 visit and 6.5% of clients (N = 2398) returned for > 5 visits. The median number of visits per client was 1 (IQR 1–2; maximum 61) and 40.6% of clients made more than 1 visit. When stratified by age group at baseline (16–19 vs. 20–24), the median and IQR of visits per person was the same (1, IQR 1–2). Each centre operated for a median of 114 days (range 108–119) over the 30-month period; once per week for 129 weeks with a two-week break at the end of each calendar year and an eight-week suspension from 27 March-17 May2020 due to national lockdown as a result of the COVID-19 pandemic. The median number of clients per community centre per day was 55 (IQR 42–70; range 1-207). Overall, 75.0% (N = 27,725) of clients were female and 53.0% (N = 19,588) were aged < 20 years at their first visit.
The median number of service components ever taken up per client was 3 (IQR 2–4, range 0–9); 3 (IQR 2–4) for females and 2 (IQR 2–3) for males, out of a maximum of 10 for females and 7 for males. The median number of services taken up in a single visit was 2 (IQR 1–3, range 0–9); 2 (IQR 1–3) for females and 1 (IQR 1–2) for males. At their first visit, the median number of services taken up was 2 (IQR 2–3) overall, 3 (IQR 2–4) for females, and 2 (IQR 1–2) for males; 84.1% of clients (74.0% of males and 87.5% of females) took up > 1 service at their first visit.
The probability of a repeat visit is shown by the number of service components taken up at the first visit (Table 1). Adjusting for sex and age category, each extra component accepted at the first visit was associated with lower odds of a repeat visit (aOR 0.94 (95%CI 0.92, 0.96), p < 0.001). Table 2 shows the number of clients who were ever eligible for each service component, the number and proportion who ever took it up, and the number of eligible visits at which each component was taken up.
Table 1 Proportion of clients who returned for a repeat visit by service component uptake at the first visitTable 2 Eligibility and uptake of service components, at individual level and visit levelService changes
In August 2019 uptake was evaluated and some revisions were made to the package of services. Between 1 April 2019 and 28 August 2019, 1930 HIV tests were performed, of which 1731 were done by the provider on site, 171 were self-tests on site, and 26 were self-tests at home (method was not recorded for 2 tests). Of the 26 clients who self-tested at home, 14 reported their test result (13 negative, 1 indeterminate). Qualitative research identified considerable barriers to self-testing, and young people almost universally preferred provider testing [20]. As a result, the option to self-test at home was dropped at this point. At the same time the eligibility requirements for HIV testing were broadened, allowing clients to test at any time if they did not have an HIV diagnosis, to encourage wider uptake of HIV testing.
HIV testing and treatment
At their first visit 43.6% (95%CI 43.1, 44.1) of clients reported never having had an HIV test before. Among clients aged 16–19 years 55.9% (95%CI 55.2, 56.6) had never had an HIV test before, compared to 29.8% (95%CI 29.1, 30.5) of those aged 20–24 years. The CHIEDZA service provided 38,603 HIV tests; 28,145 (72.9%) blood-based, 10,298 (26.7%) using OMT, and 160 (0.4%) indeterminate results had a sample sent to the laboratory for an ELISA test. From 29 August 2019 onwards all HIV tests were administered onsite. Out of 36,673 HIV tests in this period, 8380 (22.9%) were OMT and 28,293 (77.2%) were blood-based. Clients were more likely to request an OMT test rather than a blood-based test if it was their first visit (25.4% [95%CI 24.8–25.9], versus 17.0% [95%CI 16.3–17.7] at other visits), and if they were aged under 20, female or had never been tested before outside the CHIEDZA service (Table 3).
Table 3 Uptake of OMT HIV testing (versus blood-based test), STI consultation, and condoms, among eligible clients by visit type, age group, sex and whether the client had ever had an HIV test before
In total 84.1% of eligible clients (N = 29,826) had at least one HIV test, 17.4% had > 1 test and 1764 clients had > 2 HIV tests, to a maximum of 13 (2 male clients who tested frequently but remained negative).
At the first visit 34,885 clients were eligible for HIV testing and 78.4% (N = 27338) had a test. Out of the 7547 clients who did not test at the first visit, 3436 later returned for at least one more visit, and 62.2% of them (N = 2136) accepted an HIV test. Meanwhile, of the 2106 clients who were not eligible for testing at their first visit, 554 (26.3%) were eligible at a later visit and 62.8% (N = 348) accepted a test. Testing uptake over repeat visits is shown in Fig. 2. In total, 1545 clients were never eligible for HIV testing at any visit, leaving 35,446 who were eligible. Of these, 77.1% (N = 27,338) had an HIV test at their first CHIEDZA visit, 7.0% (N = 2488) tested at a later visit and 15.9% (N = 5619) never tested. Uptake of HIV testing at the first visit was higher for males than females (80.6% vs. 77.6%, C2 = 35.8, p < 0.001). HIV test yield at clients’ first test was 1.3% for tests at the first visit and 1.4% for delayed tests.
Fig. 2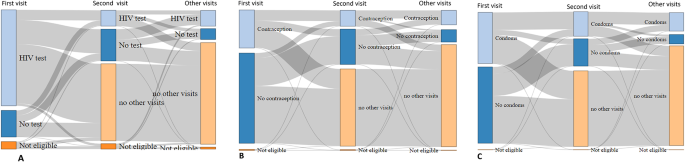
Sankey plots of (A) HIV test uptake; (B) Contraception uptake and (C) condom uptake, by visit
Overall, 377 clients tested HIV positive at CHIEDZA (prevalence 1.3% among all those tested) and 70.3% linked to care, either at CHIEDZA (n = 234) or with other service providers (n = 31), while 1162 clients were previously diagnosed. Of these, 1090 were linked to care elsewhere and 66 transferred their care to CHIEDZA. Treatment outcomes of HIV positive clients have been reported separately [16]. HIV incidence among clients with repeat visits was 0.72 per 100 person years (95%CI 0.53–0.98).
Clients who accepted HIV testing at their first visit were more likely to receive menstrual health products, analgesia and VMMC at the same time, but less likely to receive contraception, than those who did not have an HIV test at the first visit (Table 4).
Table 4 Number of eligible clients who took up the service component at first visit as a percentage of those eligible, by HIV test statusSTI management
There were 4636 STI consultation visits, syndromic STI treatment was given at 1679 visits and 268 of these were follow-up reviews. The consultation visits were for 3631 women and 1005 men, with syndromic treatment provided to 34.9% of women (N = 1268) and 40.9% of men (N = 411). STI consultations were more likely at repeat visits (8.0% [95%CI 7.7–8.2]) than at first visits (3.5% [95%CI 3.3–3.7]), and more common among female clients (6.4% of visits [95%CI 6.2–6.6]) than male (4.5% [95%CI 4.2–4.8]). Among women, the specific STI treatment was recorded for 1172 of the 1268 who received treatment. Among 1172 female clients managed syndromically for STIs, 59.7% were recorded as treated for vaginal discharge, 17.2% for candida, 11.4% for pelvic inflammatory disease, 7.0% for genital ulcer disease, and 3.0% for genital warts. Among the 381 men who received syndromic management for a named condition, 68.8% were treated for urethral discharge, 17.1% for genital ulcer, 8.9% for genital warts, 2.9% for epididymo-orchitis and 1.8% for a bubo.
Syphilis testing using SD Bioline was introduced as per national guidelines for STI management in December 2020, offered to all clients who had received STI syndromic management. In total 1275 syphilis tests were performed, with 62 (4.9%) positive and 3 indeterminate.
Other service components
There were 10,263 visits by uncircumcised males, and 363 (3.5%) accepted referral for VMMC (Table 2). In 388/10,263 visits the client was living with HIV, either already diagnosed (N = 362), or testing positive at CHIEDZA (N = 26). Among clients living with HIV, 14/388 (3.6%) took up referral, and among clients not living with HIV 349/9875 (3.5%) took up referral. VMMC referral uptake was 4.0% (180/4470) at the first visit and 3.2% (183/5793) at subsequent visits.
All clients were eligible to take condoms at any visit. On 41 client visits (0.05%) condoms were out of stock. At remaining visits, clients took condoms 38,124 times (48.4% of visits). Overall uptake was 94.3% for men and 30.1% for women. Condom uptake increased with repeat visits. Out of 8428 clients who refused condoms on their first visit and later returned, 39.1% took up condoms on a subsequent visit (Fig. 2). Most clients (85.0%) who took condoms at their first visit and returned also took condoms on a later visit. Among men, uptake was 91.6% at the first visit and 96.2% at subsequent visits. Among women, condom uptake was 22.9% at the first visit and 37.1% at subsequent visits. In total 94.0% of male clients and 34.0% of female clients ever took condoms. Condom uptake was higher among women who ever took up contraception (52.0%, 5164/9923) then women who did not (23.9%, 4229/17703; χ2 = 2200, p < 0.001).
In total, 95.4% of eligible women took menstrual health products at least once. Almost all eligible clients (94.4%) took products at their first visit. At subsequent eligible visits, uptake was 25.5%. Women were eligible for period pain management (analgesia) at the first visit and then at monthly intervals. Women were eligible at 53,978 visits and took analgesics at 25,330 (46.9%). At the first visit all women were eligible for analgesia and 49.1% took it up. At later visits uptake was 44.7% (11,726/26,254 eligible visits). The maximum number of times a client took analgesia was 24, and some clients took analgesia more frequently than the monthly intervals defined by the protocol. Analgesia uptake was higher in younger women (Table 5).
Table 5 Proportion of eligible clients who ever took up each service component by age, sex, area type and number of visits made
Contraception was a repeat-use service component (Fig. 2). At their first visit 29.7% of women accepted contraception. However, 46.7% of the women who took up contraception on their first visit later returned for more visits, compared to 36.8% of those who did not take up contraception. Among those who took up contraception on their first visit and returned, the majority (77.2%) took up contraception at least once more. The median number of visits for women who ever took up contraception was 2 (IQR 1–4) compared to 1(1–2) among eligible women who did not. Among women who ever took up contraception, HIV test uptake was 86.2%, compared to 82.3% uptake for women who did not take up contraception.
From 25 January 2021, all client visits were eligible to receive text messages unless the client was already registered for it. Uptake of text message registration at eligible visits was 49.9% (9451/18,951). The most common reason clients gave for non-uptake was that they did not have a phone (4645/9500, 48.9%). Excluding these, text message service uptake at eligible visits was 66.1% (9451/14,306). In total 9451 clients (60.1% of those who attended CHIEDZA after 25 January 2021) registered for text messages.
Counselling was available at all visits and was taken up at 1438 (1.8%) visits, by 1357 unique clients. 244 red flags were identified: 112 (45.9%) for an acute mental health problem or suicidality, 56 (23.0%) for miscarriage or abortion services, 50 (20.5%) for sexual assault, 13 (5.3%) for a severe STI, (e.g. severe pelvic inflammatory disease) and 13 (5.3%) referrals to hospital for other reasons.
The most popular service components for women were menstrual health products (taken at least once by 95.4% of those eligible), HIV testing (83.7%) and analgesia (59.9%); for men the most popular were condoms (93.9%), HIV testing (85.6%) and text messages (67.1%). Among women aged ≥ 20 years, 43.7% took condoms and 60.3% took up contraception (Table 4). The group with highest uptake of HIV testing was men aged 16–19 years. All service components had higher uptake by clients who had repeat visits.
The most popular services for women living with HIV (N = 1375) were menstrual health products (93.3% of those eligible), text messages (65.5%), condoms (64.2%), analgesia (60.2%) and contraception (47.6%). The most popular services for men living with HIV (N = 164) were condoms (93.3%), text messages (66.3%), STI consultation (20.2%) and counselling (18.2%). Counselling was accepted by 17.6% of clients living with HIV versus 3.1% of those who were not HIV positive.
The peri-urban communities in Mashonaland East had higher uptake of HIV testing than the urban clusters in Harare and Bulawayo (95.8% vs. 77.9%). Menstrual pain management uptake varied widely between the provinces, from 46.0% in Mashonaland East to 57.6% in Harare and 80.8% in Bulawayo. The reasons for this diversity are unclear. Uptake of other services was broadly similar between settings.