
LAB strain isolation and identification
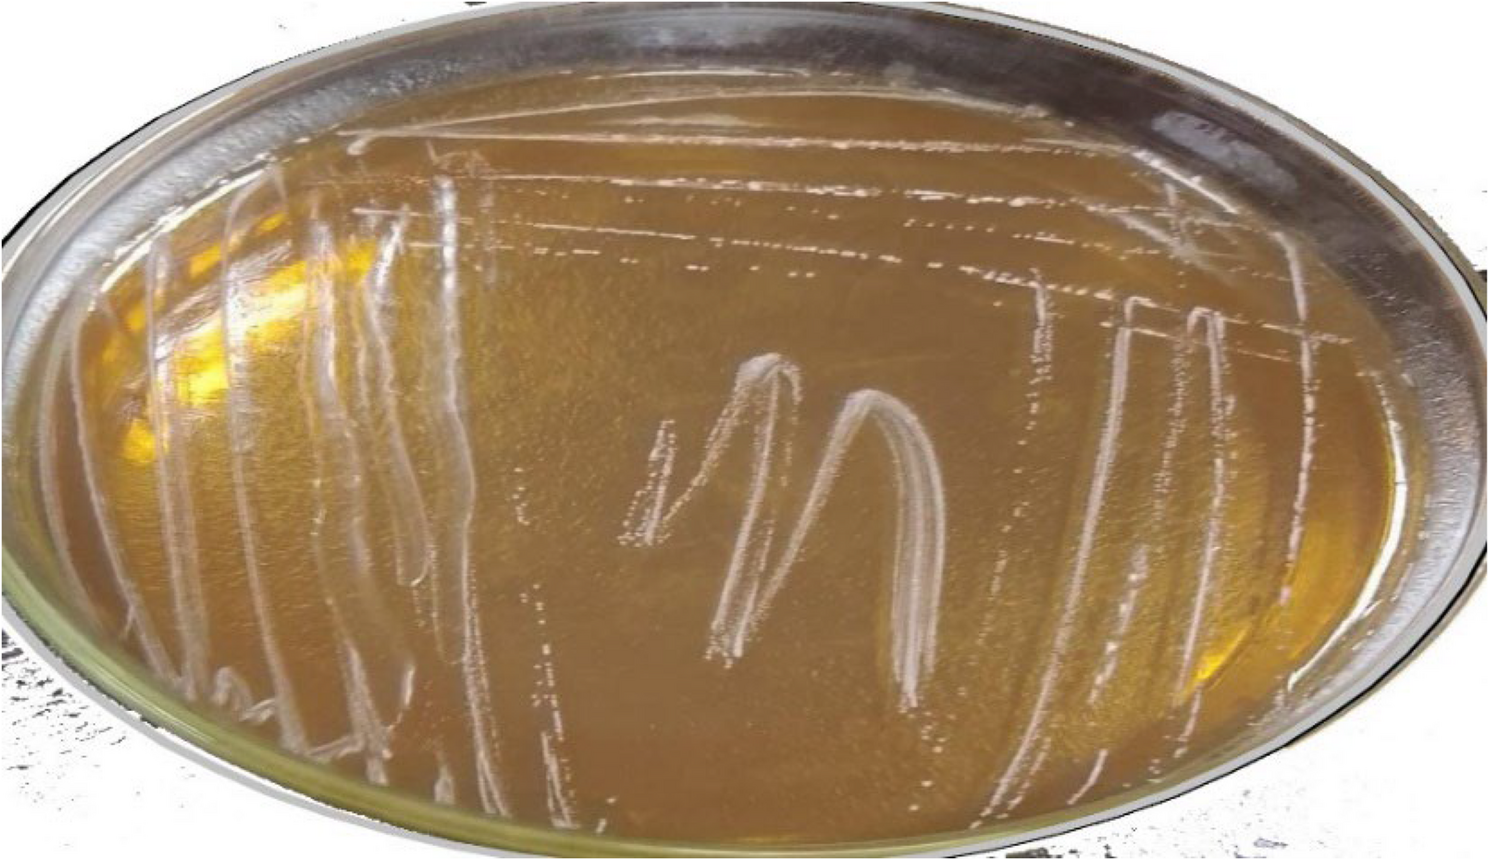
A total of twelve isolates were selected from various dairy sources, including raw buffalo milk, whey, quraish cheese, white yogurt, cream cheese, white cheese, and rayeb milk, based on colony morphology, cell shape, and staining characteristics. All selected isolates were Gram-positive, non-motile, non-spore-producing, and catalase-negative. They produced distinctive small, whitish-creamy colonies on MRS agar (Fig. 1). Due to their ability to grow under anaerobic conditions, these isolates were designated as LAB-1 to LAB-12, indicating their affiliation with lactic acid bacteria.
Fig. 1
purified colonies of lactic acid bacteria on MRS Agar media
Colony description
The colonies were moderate in size, white, shiny, smooth, entire, raised, and round.
Gram staining
The Lactiplantibacillus isolate stained Gram-positive, demonstrating a strong cell wall that retains the purple stain. The bacteria appeared as long rod-shaped cells, occurring singly or in pairs (Fig. 2).
Fig. 2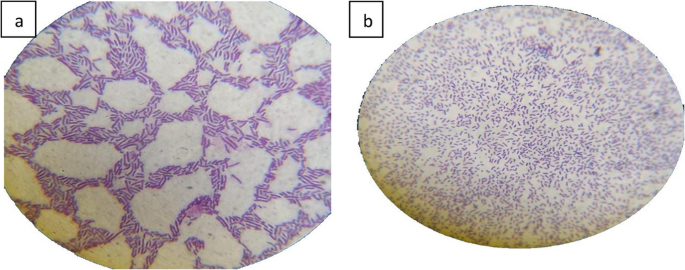
Gram stain of isolated bacteria. a: strepto bacilli, b: long mono and diplo bacilli
Methods for detection of biofilm
The reference strains (Pseudomonas aeruginosa ATCC 9027, Staphylococcus aureus ATCC 6 538, and Escherichia coli ATCC 25922) were used for antimicrobial susceptibility testing in accordance with CLSI guidelines. Additionally, clinical isolates of Escherichia coli, Pseudomonas aeruginosa, Staphylococcus aureus, and Klebsiella pneumoniae were biochemically identified and subjected to antimicrobial susceptibility testing using the VITEK 2 automated system (BioMérieux, France) in table (S1 and S2).
a) tube method (TM)
The tube adherence method (TM) is a qualitative assay used to detect biofilm-producing microorganisms. A thick film lining the tube walls and bottom, stained with crystal violet, indicates biofilm production. Weak or no biofilm production is inferred from absence or faint staining (Fig. 3). Although simple and cost-effective, the TM is less sensitive than other methods such as the microtiter plate assay, which allows more precise quantification of biofilm mass.
Fig. 3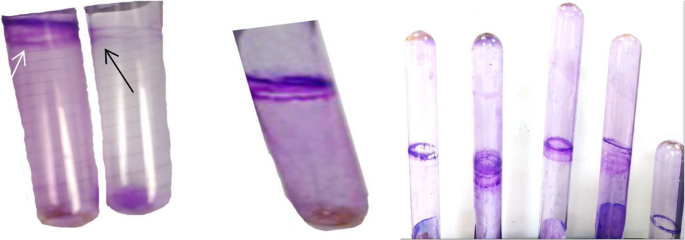
Tube adherance method (TM). White arrow refer to a violet thick film lined the wall of the tube indicates positive biofilm production and black arrow indicate lacking of biofilm production
b) congo red agar (CRA) method
The Congo Red Agar (CRA) method is a qualitative assay for detecting biofilm-producing microorganisms. Bacterial cultures were incubated on CRA plates for 24 to 48 h at 37 °C. Strains capable of biofilm formation secrete extracellular polysaccharides that bind to the Congo red dye, resulting in dark red or black colonies. Conversely, weak or non-biofilm producers produce red or pink colonies (Fig. 4). Although this technique allows visual identification of biofilm producers, it may fail to detect weak biofilm formers and is less sensitive than quantitative methods such as the microtiter plate assay.
Fig. 4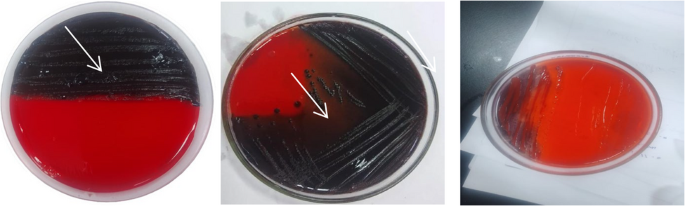
CRA method applied on CRA medium. White arrow refer to Black crystalline colonies of biofilm producer cell and pinkish-red colonies of biofilm nonproducer cell
c) biofilm phenotypic characterization using the microtiter plate test
This method quantitatively detects biofilm formation using a microplate reader (micro ELISA). Results indicated that the microtiter plate (MTP) assay exhibited superior sensitivity (100%) in detecting biofilm-positive strains compared to the CRA and tube methods. The MTP assay quantitatively measures optical density of biofilms adhered to wells, providing accurate and objective results (Fig. 5). While the TM and CRA methods yielded inconsistent and sometimes contradictory findings, the MTP assay detected biofilm formation in 13 out of 15 isolates (86.7%) in this study. Notably, some strains (e.g., E. coli 1 and K. pneumoniae 2) that were negative in TM or CRA assays were identified as strong biofilm producers by MTP, demonstrating its higher sensitivity in detecting weak and moderate biofilm formers.
Fig. 5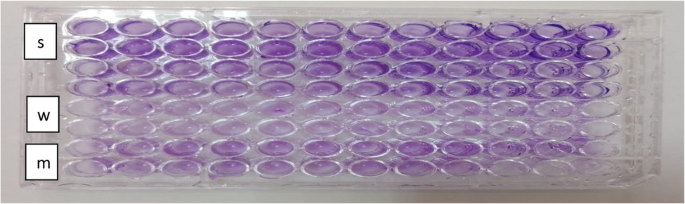
Microtiter plate assay indicating biofilm production.This result shows that the dark violet color indicates the production of biofilm pathogen bacteria (s) strong, (w) weak and (m) moderate biofilm producers in96-wells Microtiter plate
The antibiofilm activity of twelve Lactiplantibacillus plantarum isolates (L1–L12) was evaluated using the disk-diffusion method on Congo Red Agar (CRA). This medium allows for the visual detection of biofilm formation due to the interaction of Congo red dye with the exopolysaccharide matrix.
To evaluate the antibiofilm activity of the LAB isolates, culture filtrates obtained from well-grown strains were carefully introduced into wells previously made in CRA plates inoculated with pathogenic bacteria. Following incubation, the diameters of the inhibition zones surrounding the wells were measured in millimeters as an indication of the inhibitory effect.
All LAB isolates showed varying degrees of inhibition against the tested pathogens (Staphylococcus aureus, Escherichia coli, Klebsiella pneumoniae, and Pseudomonas aeruginosa). Isolate L1 showed the highest antibiofilm activity, with inhibition zones of 32.33 mm against S. aureus and 35.33 mm against E. coli are presented in Table 1.
Table 1 Antibiofilm activity of LAB isolates (L1–L12) against pathogenic bacterial strains as measured by Inhibition zones (mm) on congo red agar
L2 also exhibited strong activity, while L3–L5 showed moderate effects. Isolates L6–L12 had weaker or limited inhibitory zones, with L12 showing the least activity overall. Notably, P. aeruginosa strains exhibited lower sensitivity, as reflected in smaller inhibition zones for most LAB isolates.
Statistical analysis indicated significant differences (p < 0.05) among the LAB strains, as shown by different grouping letters (a–f) in the data table (Table 1).
The phenotypic characterization of biofilm formation using tube method (TM), Congo red agar (CRA), and microtiter plate (MTP) methods is presented in (Table 2). Representative images showing antibiofilm activity of LAB isolates are provided in (Figs. 6 and 7).
Table 2 Phenotypic characterization of biofilm formation by different methodsFig. 6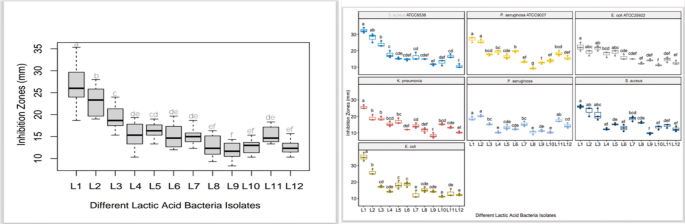
The antibiofilm activity of different LAB isolates (L1–L12) against pathogenic bacterial biofilms was assessed using the disk-diffusion method on Congo Red Agar. The results are presented as mean inhibition zone diameters (mm) with standard deviation (SD). Columns with different superscript letters (a, b, f) indicate statistically significant differences among the isolates (p < 0.001)
Fig. 7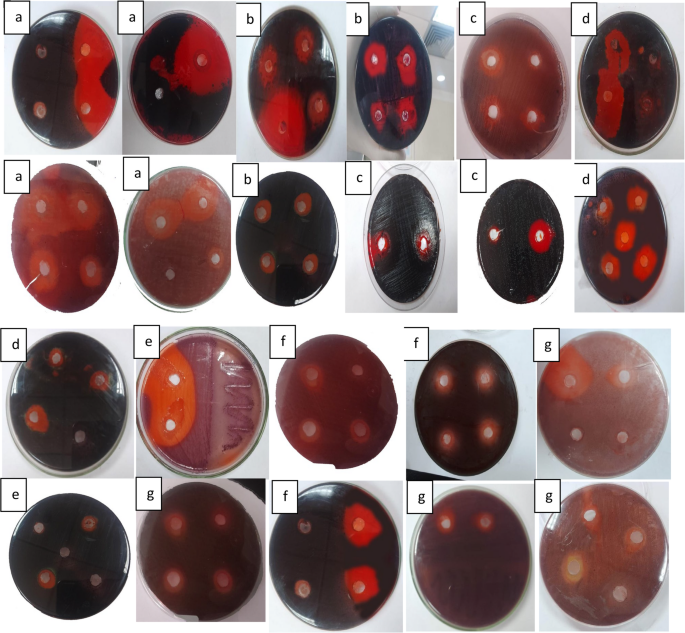
Antibiofilm produced by LAB supernatants against pathogenic bacterial biofilm by using congo red agar media, a refers to S. aureus ATCC6538,b refers to P. aeruginosa ATCC9027,c refers to E. coli ATCC25922, d refers to K. pneumonia,e refers to P. aeruginosa.f refers to S. aureus and g refers to E. coli
Biochemical characterization of LAB isolate EH1 was performed with the VITEK 2C2 microbial identification system, and the results are summarized in (Table 3). According to the manufacturer, “+” refers to positive test results and “−” refers to negative test results.
Table 3 Chemical characterization of LAB isolate E.H1 using the VITEK 2c2 microbial identification system (BioMérieux, Craponne, France)Optimization of culture conditions for LAB growth and bioactive filtrate production
The results were measured with a spectrophotometer measuring the optical density at 600 nm in (Fig. 8). Lactiplantibacillus plantarum’s development and bacteriocin production are heavily influenced by a number of dietary and environmental variables growth type, nitrogen and carbon sources, as well as fermentation conditions including pH, temperature, and incubation duration. To increase antibacterial action and biomass yield, these parameters must be optimized. The results show how the maximum bacteriocin activity was attained, suggesting that the mid-logarithmic phase is ideal for biosynthesis after 48 h. Shorter (24 h) or longer (72 h) incubations resulted in lower activity. With notable drops at 20 °C and 30 °C, and almost no activity at 50 °C, either due to metabolic inhibition or protein denaturation, 37 °C was the ideal temperature for both growth and bacteriocin synthesis. With the maximum activity seen at pH 6–7, pH also had a significant effect. In contrast, both acidic (pH 3–5) and alkaline (pH 8–10) circumstances caused a noticeable decrease, maybe as a result of cellular stress or enzyme deactivation. The most efficient nitrogen supply was yeast extract, perhaps because it contained a lot of peptides, amino acids, and vitamins. Peptone provided a modest amount of support, while the least effective sources were inorganic ones like urea, ammonium chloride, and ammonium nitrate. L. plantarum can effectively use simple sugars for energy and metabolite synthesis, as evidenced by the highest bacteriocin production from sucrose and fructose, followed by glucose and lactose, when considering carbon sources. In contrast, starch demonstrated lower effectiveness, most likely because of its complex structure that necessitates enzymatic hydrolysis. Furthermore, bacteriocin production was much increased under shaking conditions as opposed to static culture, presumably as a result of better aeration, oxygen availability, and uniform nutrient distribution. These findings highlight how crucial it is to optimize physicochemical and nutritional parameters in order to increase the effectiveness of L. plantarum’s capacity to produce bacteriocins, which may find use in the creation of antimicrobial agents and natural food preservation.
Fig. 8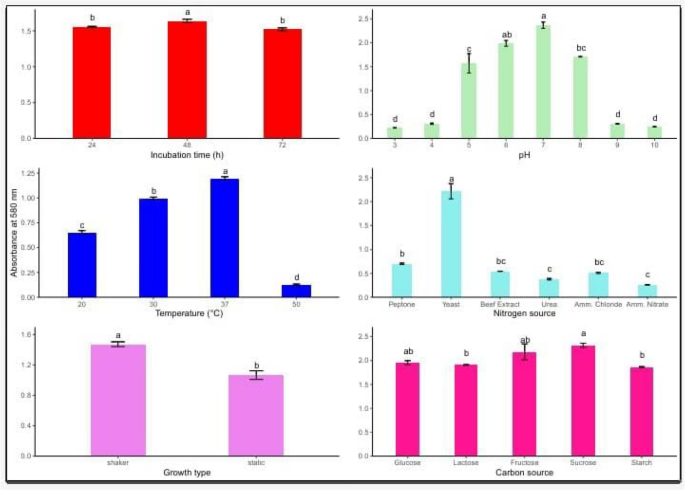
Effect of various influencing parameters on LAB growth. Values are expressed a, b. and f: means having different superscripts within each column are significantly different (p < 0. 001). SE standard error
Physiological and molecular identification of LAB isolates growth
Total genomic DNA was extracted from each of the isolate LAB-1, with the highest probiotic p otential in order to identify characteristics of their genotypic. According to Sadrani et al. (2014), this extraction was carried out in order to identify the isolates using bacterial-specific 16 S rRNA amplification of gene sequencing, which enables identification of bacteria down to the genus and species level. Selected isolates’ 16 S rRNA gene sequences were compared to those found in the Gene-Bank databaseMolecular identification based on 16 S rRNA gene sequencing confirmed that the most promising isolate, LAB-1, belongs to the genus Lactobacillus and specifically to Lactiplantibacillus plantarum, showing 98.7% similarity to strains JCM 1149 and LC064896.1 (Fig. 9).
Fig. 9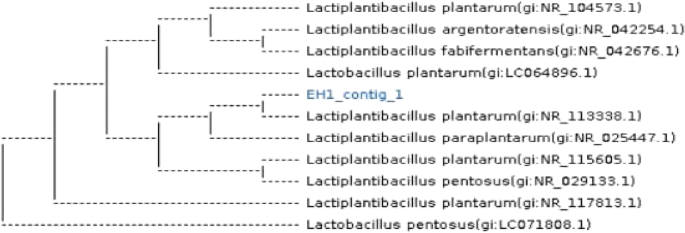
Phylogenetic tree illustrating the connection between a few chosen isolates and their Genbank homologs. MEGA6 sequence alignment software was used to build the tree for Lactiplantibacillus plantarum strains JCM 1149 and LC064896.1
https://www.ncbi.nlm.nih.gov/nuccore/OQ538171.1/.
The bacterial strains have been recorded at the GenBank with the identification number JCM 1149, LC064896.1.
Lactiplantibacillus plantarum strain’s antibacterial and antibiofilm properties
The antibacterial activity of LAB strains was first tested using the agar well diffusion method. Pseudomonas aeruginosa ATCC9027, Staphlococcus aureus ATCC6538, Escherichia coli ATCC25922, and Klebsiella pneumoniae were the examined bacterial strains against which the bacterial strains displayed discernible inhibitory zones. Table 4 displays the LAB strains’ inhibitory zones against each bacterial strain. They cause membrane disruption, which increases membrane permeability, causes cell lysis, causes metabolite loss, and ultimately results in the death of the bacteria. Additionally, the effect of the L. plantarum supernatant on the cellular ultrastructure of S. aureus, P. aeruginosa and E. coli was examined by SEM and TEM before and after treatment. The SEM and TEM micrographs revealed the control to have normal morphological characteristics (Figs. 11 and 12), displaying a smooth, undamaged cell membrane. Nevertheless, the cell membrane exhibited signs of impairment, characterized by the emergence of many holes besides completely lysed cells. Also, the deformation of the cell membrane and reduction in biofilms of LAB -treated S. aureus, P. aeruginosa and E. coli as shown in (Figs. 6 and 7) For testing the antibiofilm activity of LAB, the bacterial strains were first tested for their capability to form biofilm. Using the CRA plates, all of the tested strains showed the ability to form biofilms. These biofilms were detected through the formation of black colonies on the CRA plates (Fig. 4). Afterward, using the microtiter plate method, the antibiofilm activity of different concentrations (ranging from 50 to 100 ml) of L. plantarum supernatants were assessed. The L. plantarum supernatants were found to possess a dose-dependent capacity to eliminate the preformed biofilms of P. aeruginosaATCC9027, S. aureus ATCC6538, E. coli ATCC25922 and K. pneumoniae. As illustrated in (Table 4), L. plantarum was able to eliminate and reduce the biomass of the preformed biofilms of bacterial pathogen by 50 and 100 ml, respectively, after 24 h of exposure.
Table 4 Evaluation of antibiofilm activity of Lactiplantibacillus plantarum supernatant (EH1)Evaluation of antibiofilm activity by microtiter plate-crystal violet method by using ELISA reader (ER96) apparatus
Lactiplantibacillus plantarum (EH1) antibiofilm effects were examined using the microtiter plate-crystal violet assay (Table 4 and Fig. 10)
Fig. 10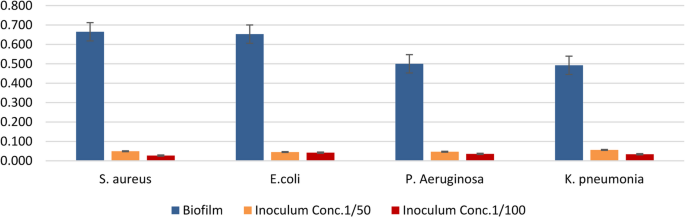
Antibiofilm activity of Lactiplantibacillus plantarum EH1 cell-free supernatant against biofilm-forming pathogens. Biofilm formation and inhibition at two inoculum concentrations (1/50, orange; 1/100, red) were measured for Escherichia coli, Staphylococcus aureus, Pseudomonas aeruginosa, and Klebsiella pneumoniae
Results are expressed as optical density (OD) values with standard error bars.
Ultrastructural effects of cell-free filtrates of Lactiplantibacillus plantarum on biofilm-forming bacteria as observed by SEM and TEM
The effect of the cell-free supernatant (CFS) from Lactiplantibacillus plantarum on biofilm-forming bacteria was analyzed using scanning electron microscopy (SEM) and transmission electron microscopy (TEM). Three notable pathogenic strains—Escherichia coli ATCC 25,922, Staphylococcus aureus ATCC 6538, and Pseudomonas aeruginosa ATCC 9027—were chosen for this investigation because to their robust biofilm-forming characteristics.
SEM examination of untreated control samples demonstrated complete biofilms consisting of densely aggregated bacterial cells embedded within a structured extracellular polymeric substance (EPS) matrix. The bacterial surfaces exhibited a smooth and well-preserved appearance, characterized by distinct cellular boundaries and intact morphology.
Conversely, cells exposed to L. plantarum CFS exhibited significant morphological changes. The EPS layer appeared either collapsed or fragmented, and the bacterial cells exhibited unusual shapes with evident surface roughening, membrane perforation, and, in certain instances, complete cell collapse. The spatial arrangement of the biofilm was markedly impaired, signifying a deterioration of structural integrity.
TEM offered additional understanding of the intracellular consequences of the treatment. Untreated bacterial cells displayed uniform cytoplasm, distinct membranes, and typical internal structure. Cells subjected to the CFS exhibited significant subcellular damage. Disruption of the cytoplasmic membrane, efflux of intracellular contents, and the emergence of electron-dense granules were frequently noted. These granules may indicate aggregated or denatured proteins and nucleic acids, implying a deterioration of metabolic integrity and cellular function.
The SEM and TEM results collectively demonstrate that the culture filtrate has a twofold effect, disrupting both the external biofilm matrix and the interior architecture of bacterial cells. The significant distortion and failure of membrane integrity align with mechanisms that compromise cell viability and destabilize biofilms. While the specific chemical composition of the active components was not delineated in this investigation, the findings highlight the capability of these filtrates to operate as potent disruptors of mature biofilms and modify bacterial cell architecture at both surface and ultrastructural dimensions (Figs. 11 and 12).
Fig. 11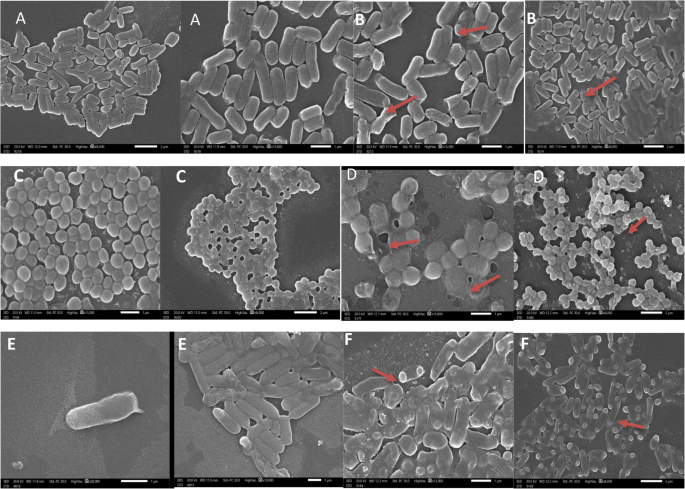
Scanning electron microscope (SEM) images showing the effect of Lactiplantibacillus plantarum treatment on pathogenic bacteria. A Staphylococcus aureus control cells exhibiting intact and smooth cell membranes; (B) S. aureus treated with L. plantarum showing visible deformation and damage to the cell membrane (indicated by red arrows); (C) Escherichia coli control cells with normal morphology; (D) E. coli treated cells displaying membrane disruption and deformation; (E) Pseudomonas aeruginosa control cells with undamaged surfaces; (F) P. aeruginosa treated cells revealing significant membrane damage and cell surface irregularities
The red arrows highlight areas of bacterial cell membrane deformation caused by the treatment.
Fig. 12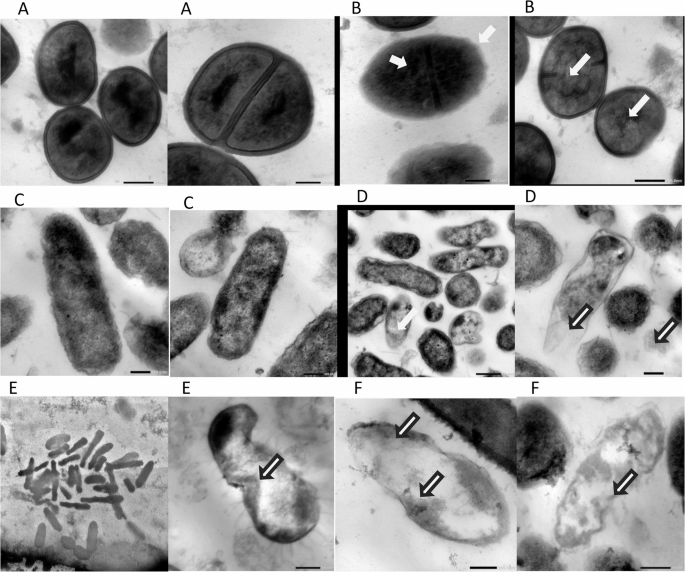
Transmission electron microscope (TEM) images showing ultrastructural changes in bacterial cells after treatment with Lactiplantibacillus plantarum supernatant. A Staphylococcus aureus control cells displaying normal ultrastructure; (B) S. aureus treated cells showing disrupted membranes and cytoplasmic leakage; (C) Escherichia coli control cells with intact cellular structure; (D) E. coli treated cells exhibiting membrane damage and intracellular alterations; (E) Pseudomonas aeruginosa control cells with normal ultrastructure; (F) P. aeruginosa treated cells revealing membrane breakdown, cytoplasmic leakage, and electron-dense aggregates indicative of cellular damage