
A small number of species dominate the distribution of wild mammal biomass.
Wild mammals once dominated the mammal kingdom. Not anymore. Today, humans and our livestock account for 98% of the world’s land mammals by weight, while wild land mammals are just 2%.1
But it’s not just the total number of wild mammals that matters. Having a broad range of different mammals that flourish does too.
There are various reasons why we should care about biodiversity, having a variety of animal and plant life in the world.
Some of those are “functional” and focus on what species do biologically in terms of managing ecosystems and providing services. Having a diverse range of mammal species is important for regulating diseases.2 It also helps to disperse seeds, control pests, cycle nutrients, and engineer ecosystems. Species such as beavers heavily influence their environments by felling trees and creating dams, which can reduce downstream flooding and create wetlands that store carbon. Bats are effective in controlling crop and forest pests.3
But there are also intrinsic arguments for biodiversity based on the argument that species carry value in and of themselves: humans can value diversity simply for its wonder, awe, or beauty. If biodiversity is valuable in itself, then morally we have a duty not to cause extinction and to maintain it.
If you care about any of the reasons above, having a diverse mammal kingdom matters.
If we want to understand global biodiversity and how it’s changing, we can’t only look at quantity. We also need to look at the composition of the world’s wild mammals, which is the focus of this article.
For this article, we rely on a large study by Lior Greenspoon and colleagues, published in PNAS.4
In this study, the researchers quantified the distribution of wild mammals using several measures, including population size (the number of individual elephants, monkeys, or rats) and the total weight of different animals (their biomass). Biomass takes into account the number and size of animals.
The study confirms that the small mammals, like rats, squirrels, and bats, have the largest population sizes. In terms of numbers, rodents and bats make up over 90% of mammals. But the results in terms of biomass are quite surprising.
To arrive at a full picture of wild mammal distributions globally, the authors used a combination of expert assessments of well-studied species and models to infer the populations of less well-known ones. As a disclaimer, this analysis involves a significant amount of approximations and carries a reasonable level of uncertainty. But we believe that it still provides a helpful perspective on the size of different groups and species. At the end of this article, we lay out some of the paper’s assumptions in more detail.
The treemap below summarises the main results. Each box represents 1% of global wild mammal biomass on land.
Here, we’re focusing on wild terrestrial mammals, which means that marine mammals are not included.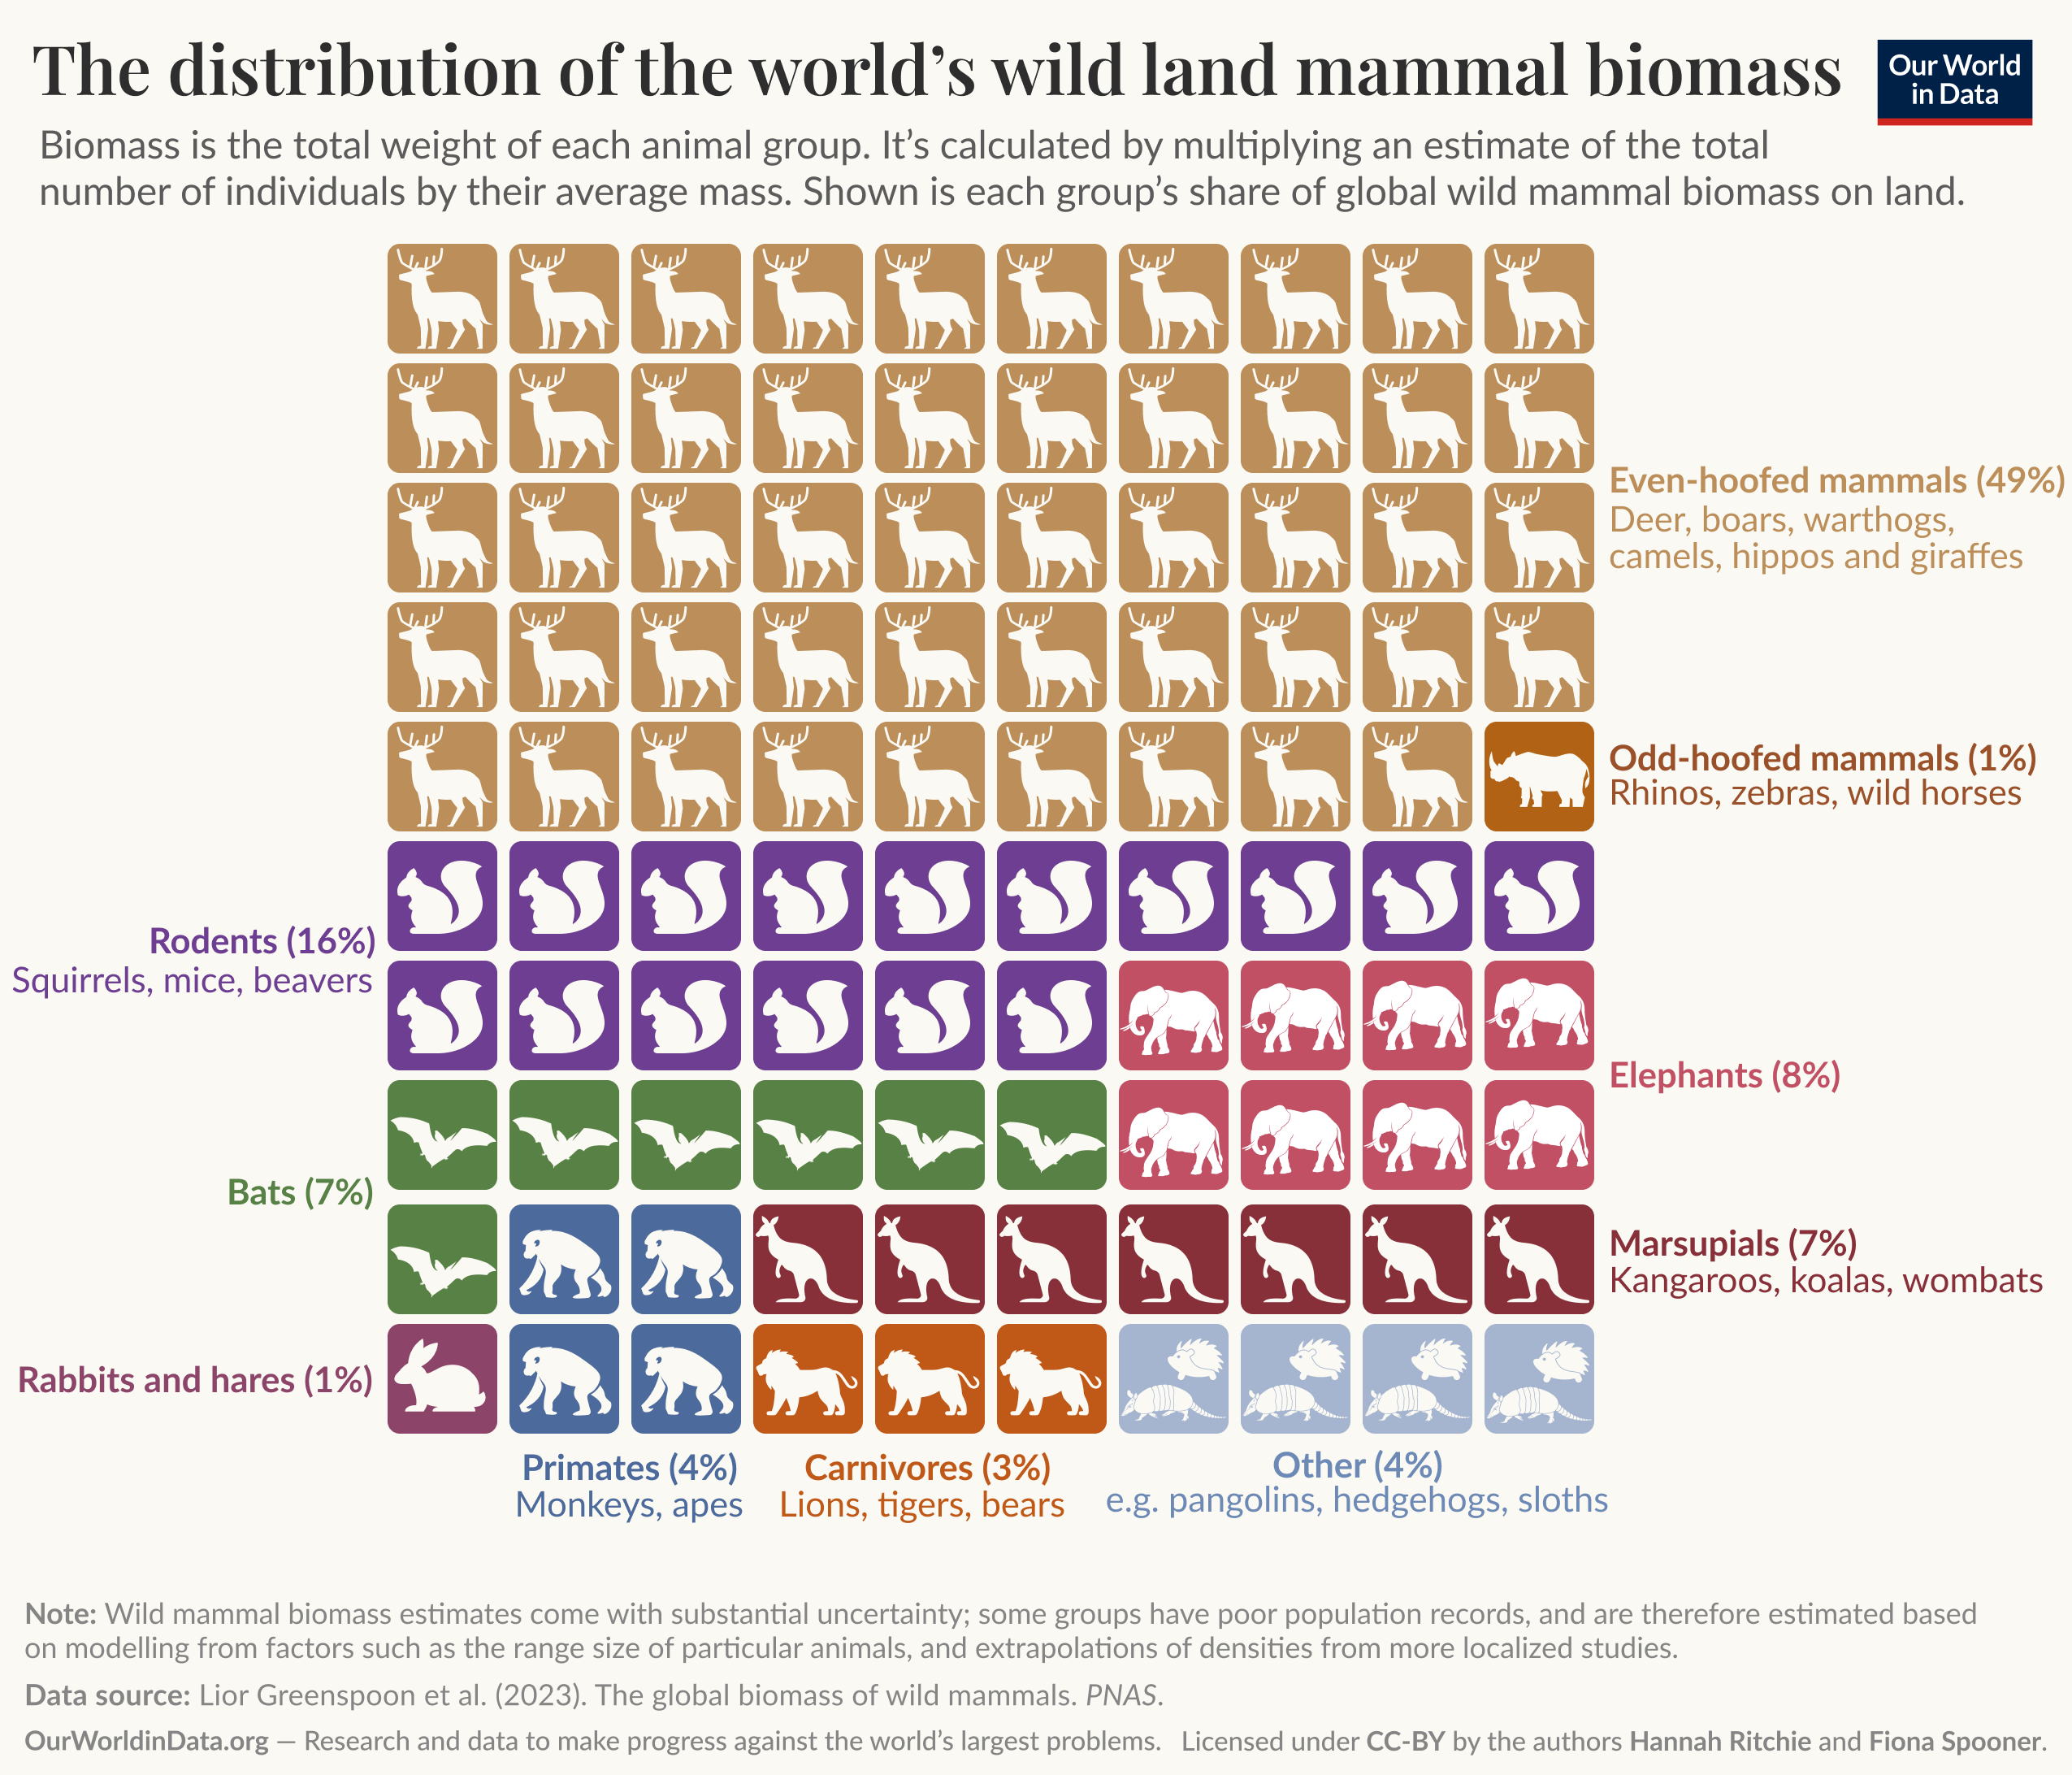
In terms of biomass, it is the “even-hoofed mammals” — mainly deer and boars — that dominate the kingdom of animals. They make up roughly half of the total. As we’ll see in the next section, this is further dominated by a small number of species: white-tailed deer, mule deer, red deer, European roe deer, and wild boars.
Rodents, which are individually tiny compared to most other mammals, still account for 16% because their population numbers are so large. Elephants, the largest land mammals, account for 8%, closely followed by marsupials — kangaroos, koalas, and wombats.
What surprised us were the bats. We wouldn’t have expected that the total weight of bats in the world is comparable to that of elephants, or more than double that of all the lions, tigers, bears, and other carnivores.
There are approximately 6,500 land mammal species in the world today.5
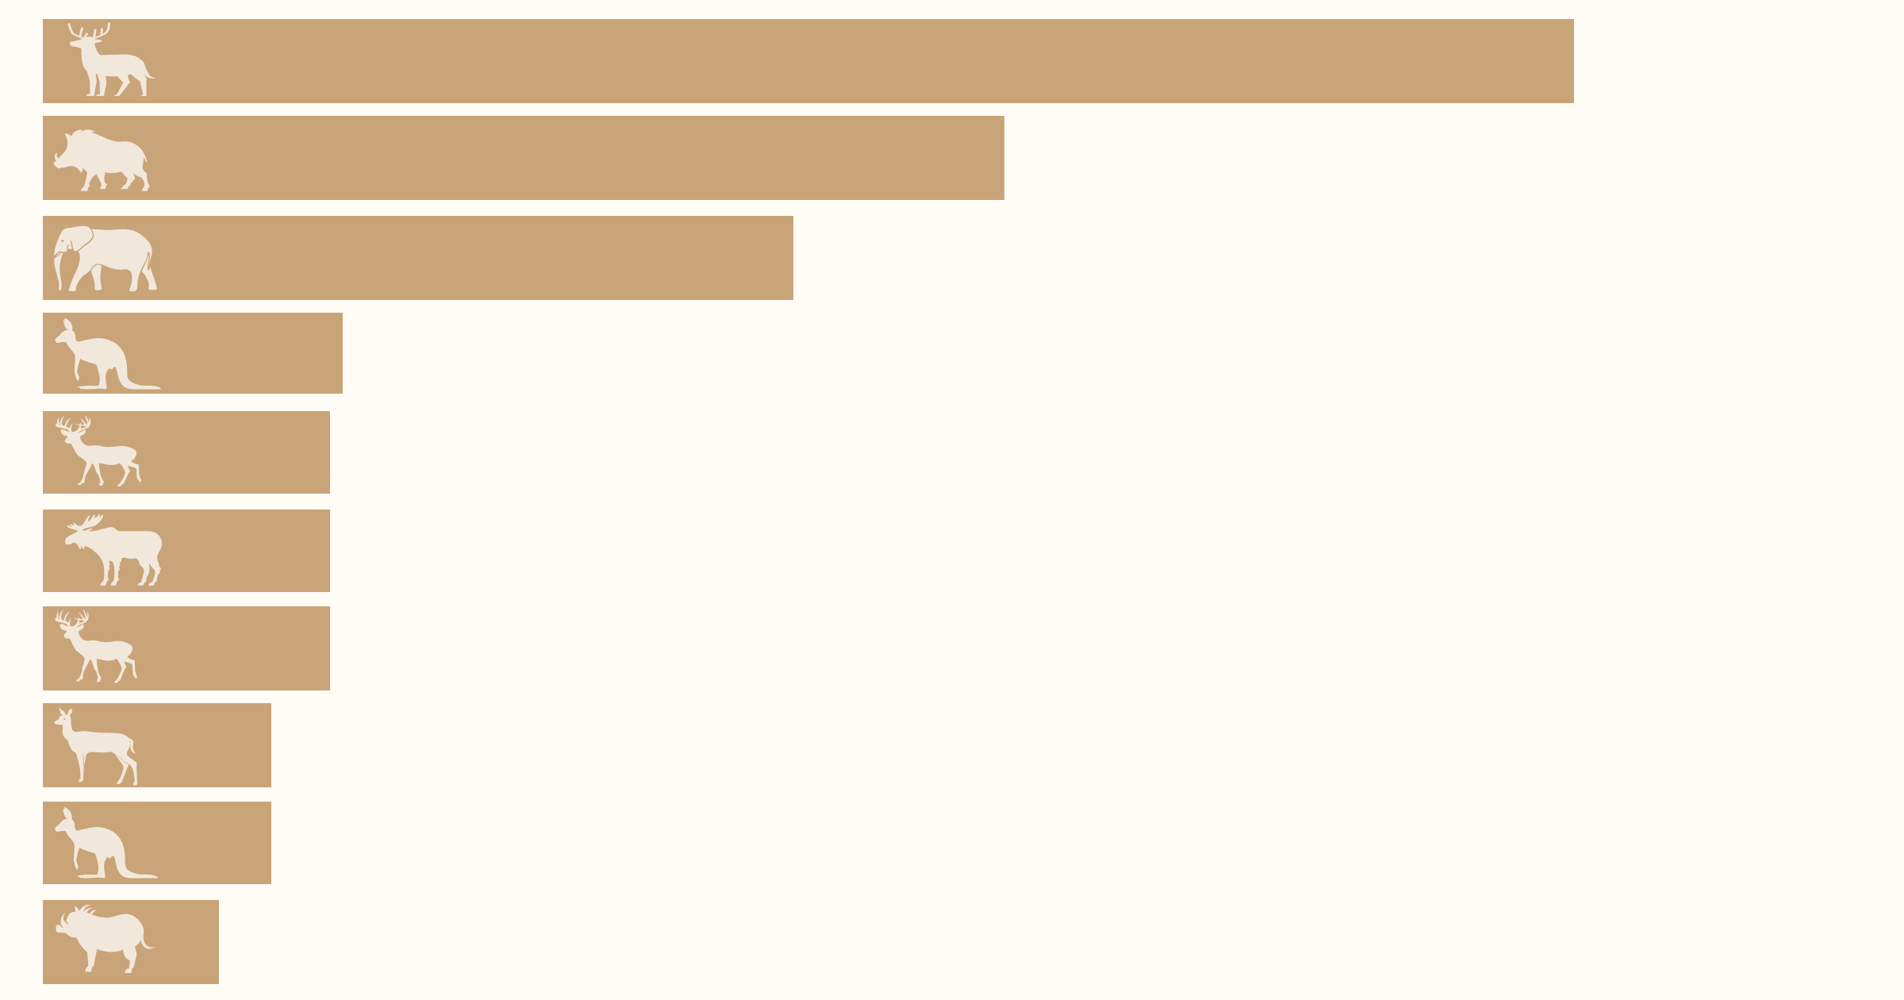
Just ten of those — 0.15% of species — account for around 40% of wild mammal biomass. The remaining 99.85% of species make up the other 60%.
These are shown in the chart below.6
As we might expect, this “top ten” list is dominated by species of deer, moose, and boars (all of which are even-hoofed mammals). Some species of kangaroos and elephants also make the list.
Again, these estimates come with some uncertainty; in our appendix below, we dig into some specific species in more detail to explain where the numbers come from.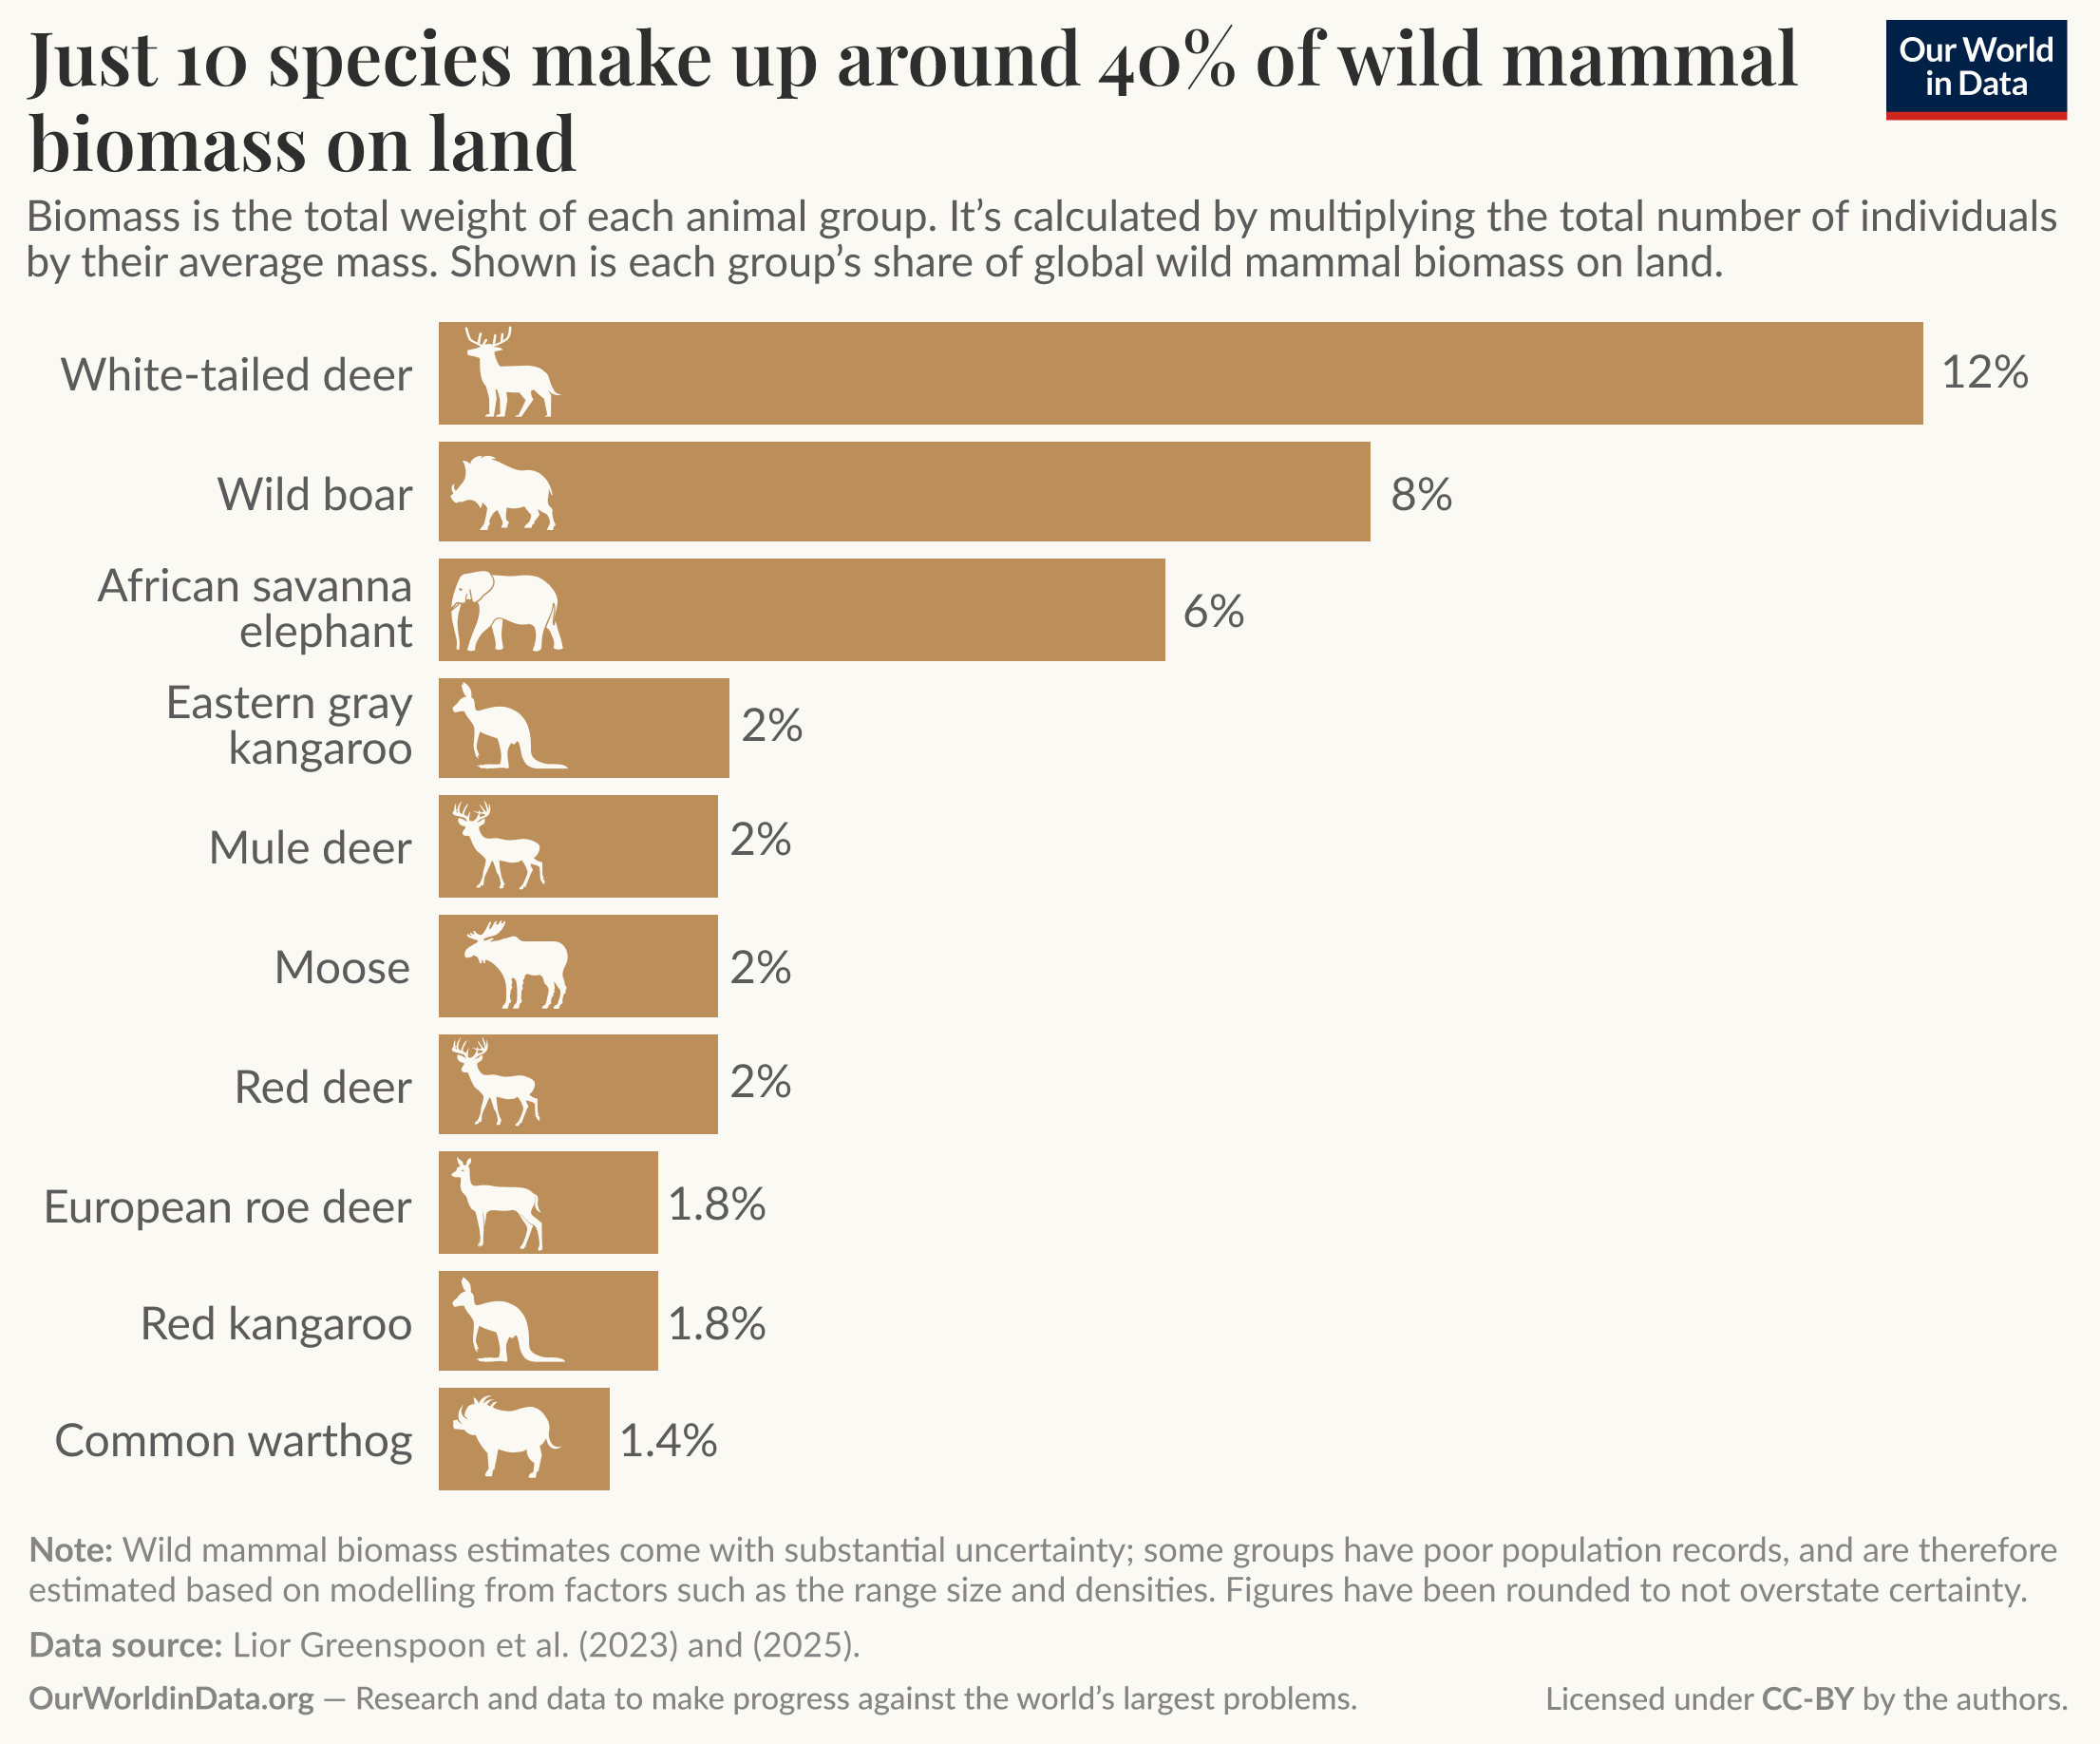
An interesting question is how humans have impacted this over our history. We’ve caused populations to shrink, and some species to go extinct.7 But we’ve also impacted the types and dominance of animals that remain.
Just ten species — 0.15% of them — account for around 40% of wild mammal biomass.
We don’t have the counterfactual of what life would be like on a planet without us, but we can find a number of examples where our impact has been clear.
It’s possible to imagine a world where the biggest mammals would be even more dominant. Look at the average size of mammals over the last 50,000 years of human history, and we see an obvious trend: they’ve gotten smaller.8 This is for several reasons, but humans have played a crucial role.
Humans hunted many of the largest mammals, and overhunting has often either led to a stark decline in population numbers or, in some cases, extinction.9 Humans also tend to compete with some of the largest mammals for habitat; we can co-exist with foxes, rabbits, and rats on farms and in cities, but we can’t live with wolves and lions in quite the same way. In fact, in many countries — including our own, the UK — deer are often viewed as a pest and are culled periodically to try to “keep in check” their impacts on other wildlife and landscapes.
In terms of biomass, the “even-hoofed mammals” — mainly deer and boars — dominate the kingdom of animals.
So, it’s plausible that biomass would be even more dominated by the largest mammals in a world without humans.
But there’s also an opposing case: that human impacts have made some larger mammals more dominant than they would be. The decline of key carnivores, such as wolves and lynxes, is a key reason why deer populations have increased in Europe and North America. With few predators, prey can flourish.10 Just as humans played a role in the wolves’ demise, programs trying to reintroduce these species are changing the dynamics of these ecosystems yet again.
In the 1990s, wolves were reintroduced to Yellowstone National Park in the United States. This has generally been considered a conservation success story, as elk — who graze heavily on trees and vegetation — have become less dominant in the reserve and wolf populations have increased.11
There are countless other examples of how human behaviors and settlements have allowed some animals to flourish; pressures on others have caused some species to shrink or disappear directly, or our choice to introduce non-native species has pushed others out. That stretches from battles between large mammals like wolves and deer, all the way down to tiny rats and rodents.12
The brown rat, for example, originated in China but is now on all of the world’s continents (except Antarctica), and thrives wherever humans live, such as cities with abundant food supplies and warm shelter.
If we zoom out again to look at the distribution of the world’s wild mammals today, there’s no answer to what the “correct” or “optimal” mix should be. But if humanity wants to protect and restore biodiversity that has been lost — whether that’s for the “functional” services they give us in terms of regulating diseases and maintaining ecosystems, or simply out of a moral duty of protection — it’s not just the total number or weight of wild animals that matters. Having elephants, deer, apes, wolves, and rats is important too.
Continue reading on Our World in DataAppendix: measurement challenges and uncertainty
The main data used in this article came from a large study by Lior Greenspoon and colleagues, published in PNAS.4
The authors of the study collected population reports for 392 species, around 6% of mammal species in the analysis. While this is a small share of the total number of species, the species they had population reports for make up 55% of the total mammal biomass. This abundance data is hard to collect and tends to be more available for only the best studied species.
Most population reports (382 of 392) came from species extinction risk assessments made by experts through the International Union for the Conservation of Nature’s (IUCN) Red List assessments. The remaining 10 species were not available from the IUCN, but were expected to be among the species with the greatest biomass. Information on the abundance of these species was gathered from a range of sources.
For example, the population reports on the eastern grey kangaroo and red kangaroo were both taken from reports by the Australian Government’s Department of Climate Change, Energy, the Environment and Water. The last estimates for both these species are from 2011 and are restricted to commercial harvest areas. It may be that the true national population levels of these species are higher, as the figures do not include non-surveyed areas.
It’s important to note that all these figures are uncertain, but the authors provide them as the best estimate. The figures are not without dispute or controversy. Luca Santini and colleagues, for example, wrote a response to the original paper, arguing that IUCN population reports are not suited for providing biomass estimates.13 The original authors also responded to this critique, with a point-by-point response, and maintain that while their figures are uncertain, they continue to provide a best estimate based on available data and methods.14
To estimate the biomass of the remaining 94% of mammals, the authors used data from these 392 population reports and additional ecological information, including range size, body mass, IUCN Red List category, taxonomic order, and trophic level, to build a Support Vector Regression model with which they could make these estimates. For smaller mammals (<1kg), they used a simpler model which excluded range size.
To make some of these figures more transparent, in the table below, we’ve included the assumptions about the assumed number of individuals and biomass of the top 10 species (which we showed a chart of earlier). Note that we use the latest data available from their GitHub repository. This can slightly differ from the figures in the academic paper itself, because they round their numbers in the paper to not overstate uncertainty.
Species
Biomass (Mt)
Individuals (millions)
Share of wild land mammal biomass
White-tailed deer
2.7
45
12.3%
Wild boar
1.7
20*
7.7%
African savanna elephant
1.3
0.44
6%
Eastern gray kangaroo
0.6
22
2.7%
Mule deer
0.5
7.5
2.3%
Moose
0.5
1.35
2.3%
Red deer
0.5
2.44
2.3%
European roe deer
0.4
22.5
1.8%
Red kangaroo
0.4
12
1.8%
Common warthog
0.3
5
1.4%
*The estimated number of individuals of wild boar has been updated in Greenspoon et al. (2025) to be 20 million, down from 30 million in Greenspoon et al. 2023.Cite this work
Our articles and data visualizations rely on work from many different people and organizations. When citing this article, please also cite the underlying data sources. This article can be cited as:
Hannah Ritchie and Fiona Spooner (2025) – “Just ten species make up almost half the weight of all wild mammals on Earth” Published online at OurWorldinData.org. Retrieved from: ‘https://ourworldindata.org/wild-mammal-biomass-dominance’ [Online Resource]
BibTeX citation
@article{owid-wild-mammal-biomass-dominance,
author = {Hannah Ritchie and Fiona Spooner},
title = {Just ten species make up almost half the weight of all wild mammals on Earth},
journal = {Our World in Data},
year = {2025},
note = {https://ourworldindata.org/wild-mammal-biomass-dominance}
}![]() Reuse this work freely
Reuse this work freely
All visualizations, data, and code produced by Our World in Data are completely open access under the Creative Commons BY license. You have the permission to use, distribute, and reproduce these in any medium, provided the source and authors are credited.
The data produced by third parties and made available by Our World in Data is subject to the license terms from the original third-party authors. We will always indicate the original source of the data in our documentation, so you should always check the license of any such third-party data before use and redistribution.
All of our charts can be embedded in any site.