
Participant demographics
We obtained recordings from 53 autistic participants and 18 neurotypical controls (NTCs), including children (5–12 years), adolescents (13–17 years), and adults (18–45 years), as part of an observational study (NCT03611075). While 135 participants initially took part in the study, only 71 recorded at least 1 conversation. This study was conducted in order to test various data collection strategies that would help inform our methodology for future clinical trials. The study was conducted according to the guidelines of the Declaration of Helsinki and received all necessary Institutional Review Board (IRB) approvals. For the specific inclusion and exclusion criteria for the clinical trial, please see the Supplementary Information.
Each participant was required to have a single study partner with whom they would record their conversations. For inclusion criteria of the study partner, please see the Supplementary information. Autistic participants had their intelligence quotient (IQ) measured according to the Abbreviated Battery IQ (ABIQ) of the Stanford-Binet intelligence scales fifth edition (SB5)37, and were subsequently placed into two categories, depending on whether their IQ was above or below 70. In accordance with standard diagnostic criteria, an IQ score of 70 is used as a threshold for intellectual disability, representing two standard deviations below the mean IQ of 100, with a standard deviation of 15. This threshold is widely recognized in clinical practice and research as a key criterion for diagnosing intellectual disability. Table 1 displays the demographic information and number of conversations that were transcribed.
Table 1 Participant demographics.Audio recordings and transcriptions
As part of the study, participants and their study partners were instructed to record natural conversations, once per week, on a smartphone that was provided at the start of the trial. The study partners were given 6 suggested topics to discuss: school, work, free-time, what they did today, dreams, and things they like or dislike, but were not required to stick to these topics. While we did instruct them to take place in a quiet environment, they often included background noise from everyday living activities, as well as speech from other members of the household. The study partners were also instructed to have conversations at least 5 min in length, but these were often shorter in practice (mean, 25th/50th/75th percentiles: 4.5 m, 2.41 m, 5.5 m, 5.96 m). No other instructions were given; therefore the conversations were free-flowing and unstructured in every other regard.
All conversations were transcribed using TransPerfect38, including time-stamps of who spoke when (diarization). Further analysis was restricted to those conversations with at least 250 words (a threshold selected as to accurately reject accidental or short recordings), resulting in 52 autistic and 18 NTC participants retained.
GPT-4
Generative Pre-trained Transformer 4 (GPT-4), is a large language model developed by OpenAI. It is trained on a diverse range of internet text, so it can perform a wide variety of tasks without task-specific training, and can effectively process and generate human-like text. GPT-4 was deployed via a custom Azure installation for confidential patient data, in keeping with the informed consent provided by participants.
There are three settings of primary importance to our application of GPT-4. The first is the temperature parameter44 (range: 0–2), which controls the randomness of the output. A lower temperature means the model will produce more predictable text, while a higher temperature results in more varied outputs. Here we experimented with 3 different temperatures: 0.0, 0.5, and 1.0. The second setting is referred to as ‘top-p’. This is another parameter that controls the randomness of the model. We tried values of 0.0 and 0.9.
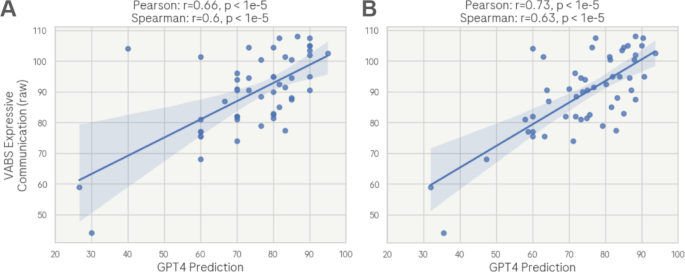
The third setting is the model primer: the initial context and instructions given to the model to guide its text generation. In our case, we primed the model by defining the style and format of the conversation transcripts, the specific task for the model, and the format its output should have. Specifically, we requested that GPT-4 provide an estimate of the expressive communication abilities of the participant. We also tried 3 variations of prompts, with decreasing levels of information provided to GPT-4 about autism and the VABS. Prompt 1: GPT is informed that the participant has autism, and asked to provide a score (between 0 and 100) based on the VABS expressive communication subdomain. Prompt 2: GPT is not informed that the participant has autism, but is still asked to score the conversation based on the VABS. Prompt 3: GPT-4 is neither informed about autism, nor the VABS. Instead, it is just asked to provide a score of the expressive communication abilities of the participant. For the full primer, please see the supplementary information.
The raw VABS scores in each subdomain are calculated by assigning a score between 0 and 2 for each question. Each subdomain has a different number of questions, with the expressive and receptive subdomains containing 55 and 20 questions respectively, thus resulting in theoretical maximum scores of 110 and 40. We chose to standardize the GPT-4 scores on a 0–100 scale to accommodate the variability in score ranges across different VABS subdomains and versions (e.g. VABS-2 and VABS-3). This approach provides a consistent framework for initial analysis, allowing for subsequent linear transformations to map these scores to the specific scales of each subdomain. This decision was made to ensure comparability and flexibility in interpreting the results across diverse scoring systems. Therefore, we did not seek to precisely predict the exact raw score of the VABS, but rather to produce a score that is monotonically related to it.
We also experimented with using two example conversations as (in-context) training data, one from an autistic individual with a very low VABS raw expressive communication score (44), and one from an NTC (and who therefore did not have a VABS score). We used these to guide GPT-4 on the style and format of the conversations, and what should be expected in terms of VABS scores. It is important to state that we did not use data from the same participant for (in-context) training and testing. We always used the example from the NTC participant (because that individual did not have a VABS score, and therefore we never tried to predict it), but we swapped the example from the participant with a low VABS score with another participant with a similarly low score when appropriate. Each conversation, along with the model primer, was independently submitted to GPT-4 for score prediction with a fresh context window for each submission (i.e. with no memory of previous iterations).
Reliability of GPT-4 ratings and individual conversations
Given the vast and variable number of conversations that each participant recorded, we opted for 2 analysis methods: 1) an Aggregate Assessment, in which we evaluated the overall capability of the model to gauge communication skills by concatenating all of the conversations from a participant together, and 2) a Single-Event Assessment, in which we examined the model’s performance in assessing communication from individual conversations. Therefore, this second method should not only measure the consistency of GPT-4, but also the ability of individual conversations to reliably reflect the communication skills of each participant. However, when comparing the results from the Single-Event Assessment method with the VABS, we took the mean value across all conversations in order to obtain a single value per participant.
With these two assessment methods, we wanted to quantify the variability associated with the stochastic nature of GPT-4, as it is known that the model is highly unlikely to produce identical outputs successively44. To do so, we ran the data through the model three times. (Note: To obtain a final score for each participant in the correlation analyses, we took the average over these three iterations). We estimated the agreement between these iterations using the intraclass correlation coefficient (ICC) using the two-way random, single measures, absolute agreement method (ICC(2,1)). We employed a hierarchical Bayesian model from PyMC39 to compute the ICC, which is particularly suitable for our dataset with its unbalanced number of conversations per participant. By grouping conversations by participant within the model, we treat participant effects as random variables, which allows us to effectively handle the variability in conversation counts. This approach is advantageous as it provides a flexible framework for accommodating the uneven sample sizes, thus offering a more accurate representation of the data structure than traditional ICC methods. The Bayesian model estimates latent variables for each participant, capturing the underlying participant-specific effects, which are then used to calculate the ICC. This method integrates the uncertainty inherent in the data, yielding a robust estimate of the ICC that encapsulates both within- and between-participant variability. The ICC is derived from the posterior distributions of these effects, reflecting the degree of similarity within clusters of data (i.e., conversations within participants), which is central to our analysis.
Comparison with linguistic and temporal feature benchmarks
In addition to comparing GPT-4’s predictions with the actual VABS scores, we also compared them with three quantifiable linguistic and temporal features previously shown to be indicative of communicative abilities15,16,17,18,19,20,21. By comparing the performance of GPT-4 against this baseline, we aimed to ascertain the added value of the model’s advanced linguistic and contextual processing capabilities. The features chosen were: (1) the number of words spoken per sentence (WpS), which reflects syntactic complexity and the ability to form coherent, structured expressions. (2) The utterance duration of the participant (UD: the length of time that a participant would speak for within their turn). We defined an utterance as a continuous segment of speech separated by a pause no longer than 1 s in duration. (3) The age of acquisition (AoA43) for the words used in the communication samples, which serves as a proxy for the developmental aspect of language use, indicating the maturity of the individual’s lexicon. These features were chosen for their empirical relevance to language proficiency and their established correlation with expressive communication abilities in the literature15,16,17,18,19,20,21. For each feature, we calculated the mean value across all conversations to result in a single value for each participant. For the WpS and UD features, we used their logarithmic transform. Because these features were calculated for each conversation and then averaged, we compared them with the Single-Event Assessment method for GPT-4.
Partial correlation analysis
We employed a partial correlation analysis to calculate the unique contribution of each predictor variable on the variance in the VABS scores, whilst controlling for the potential confounding effects of other covariates. This statistical technique allows for the isolation of the relationship between two variables by removing the influence of one or more additional variables. For the analysis, we used the Python package pingouin48. Each predictor-covariate pair was analysed in turn, with the partial correlation coefficient being calculated to determine the strength and direction of the association between the predictor and the VABS scores, independent of the covariate.
Multivariate linear regression analysis
GPT-4 is almost certainly taking into account multiple factors to make its determination. Comparing this multiple factor approach to a univariate approach could perhaps be biased in favor of GPT-4. Therefore, we trained linear regression models using both univariate and multivariate approaches; i.e. for each feature, we predicted the VABS score using that feature alone (univariate), or all other features combined (multivariate). All features were z-scored before modelling. Due to the high colinearity of the features, ridge regression was applied in the multivariate case (selected to be a value of 10 through cross-validation). The data were split into 60% training and 40% testing sets, and this process was repeated 100 times to obtain an average result.