
Structural characterization of (La,Y)H10
Prior to laser heating, the La0.9Y0.1 alloy compressed together with ammonia borane (NH3BH3) to high pressure adopted a distorted-cubic \({Fmmm}\) structure32. At 158 GPa (DAC #1, Fig. 1), the X-ray diffraction (XRD) pattern showed spotty diffraction rings, a narrower accessible 2θ range at the longer wavelength, and additional peaks from Pt electrodes and the sample environment, which obscured weaker La-Y reflections. By contrast, at 172 GPa (DAC #2, Fig. S1), the shorter wavelength, absence of electrode and gasket contributions, and improved powder averaging yielded well-resolved La-Y reflections. A direct comparison of La0.9Y0.1 at 158 and 172 GPa is provided in Fig. S2, showing that the observed differences in the number and shape of peaks arise from experimental factors rather than intrinsic structural changes. In addition, the broader and asymmetric (002) profile at 172 GPa reflects pressure-induced lattice distortions and deviatoric stress, consistent with prior observations in elemental La under compression32.
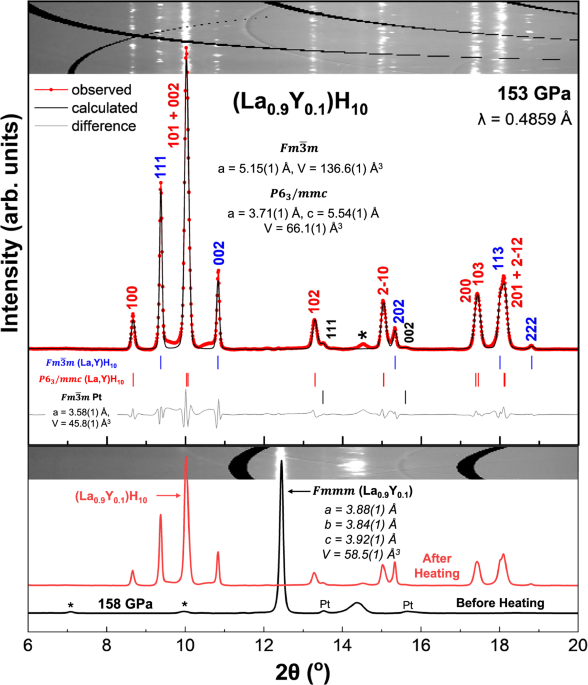
Fig. 1: XRD patterns and structural refinement of coexisting (La,Y)H10 phases.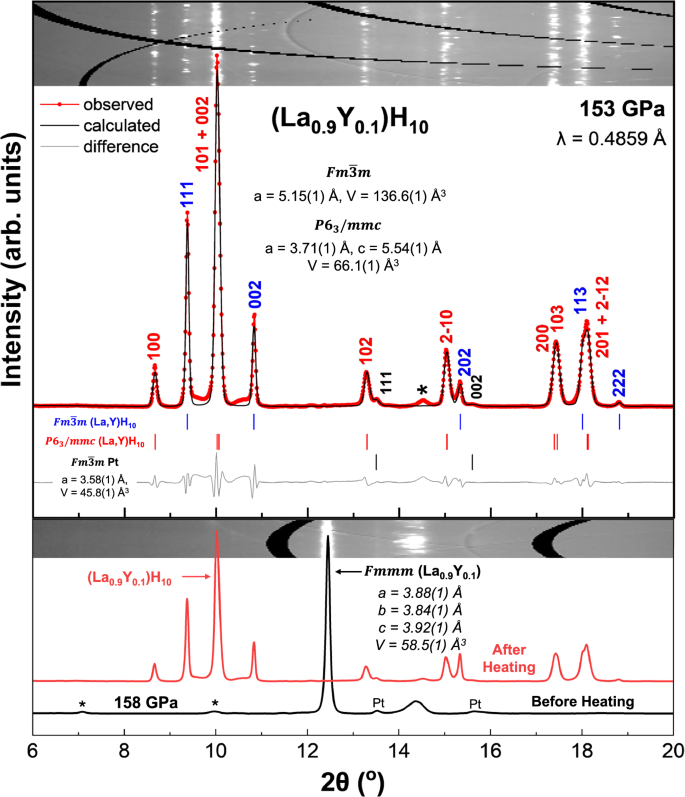
Top: Experimental synchrotron XRD patterns and Le Bail refinements of the \({Fm}\bar{3}m\) and \(P{6}_{3}/{mmc}\) (La,Y)H10 phases at 153 GPa. The experimental data, fit, and residuals are shown in red, black, and gray, respectively. Refined lattice parameters for both phases are indicated. Bottom: Experimental XRD patterns of La0.9Y0.1 at 158 GPa before and after laser heating. The pre-heating pattern corresponds to the distorted-cubic \({Fmmm}\) phase. After laser heating, the diffraction pattern shows the formation of (La,Y)H10 phases, consistent with the refined structures shown above. Reflections from Pt electrodes are explicitly labeled, while peaks marked with “*” correspond to unidentified or sample-environment contributions. Insets show representative 2D diffraction images for reference.
Following laser heating, the diffraction pattern changed significantly, with alloy peaks disappearing and new reflections emerging from hydrogen-rich phases (Figs. 1 and S1), confirming successful hydrogenation. At 158 GPa (Fig. 1), the pressure relaxed to 153 GPa after laser heating, and the diffraction pattern revealed the formation of two clathrate structures: cubic \({Fm}\bar{3}m\) and hexagonal \(P{6}_{3}/{mmc}\), both of which have been previously reported in La–H and La–Y–H systems10,22. Optical images of the sample before and after laser heating are provided in Fig. S3. A second synthesis performed at 172 GPa (Fig. S1) produced the same two phases, demonstrating reproducibility across independent runs.
Le Bail refinements of the hydrogenated sample at 153 GPa yielded lattice parameters of a = 5.15(1) Å for the \({Fm}\bar{3}m\) phase and a = 3.71(1) Å, c = 5.54(1) Å for the \(P{6}_{3}/{mmc}\) phase, corresponding to unit cell volumes of 136.6(1) ų and 66.1(1) ų, respectively (Fig. 1, top panel). These values are comparable to those reported for undoped LaH10 at similar pressures6, with slight reductions in volume consistent with the expected lattice contraction from yttrium substitution14,22. As shown in Fig. S4, this systematic reduction provides direct structural evidence that ~10% Y is incorporated into the clathrate framework. Notably, no diffraction peaks from secondary LaHn or YHn phases were observed, indicating that Y substitution remains within the solubility limit for forming a single-phase clathrate or a mixed-phase clathrate solid solution13,22. Volume-based stoichiometry analysis yielded ~10 H per metal atom for both the cubic and hexagonal phases, consistent with the nominal (La0.9Y0.1)H10 composition (Supplementary Note 1).
To assess the stability of the observed phases during decompression, additional XRD measurements were performed on both samples. In DAC #1, the sample was gradually decompressed from 153 GPa, and an XRD was collected at 136 GPa from the sample center, with Fig. S5 illustrating the collection positions corresponding to the patterns in Figs. 1 and S6. At 136 GPa, both the cubic and hexagonal phases were still observed (Figs. S6 and S7). Fig. S7 presents XRD patterns of (La,Y)H10 at 153 and 136 GPa in DAC #1, collected from comparable positions in the sample chamber to confirm the persistence of both phases across this pressure range. At 136 GPa, minor distortions in the \({Fm}\bar{3}m\) phase were also evident across different regions of the sample (Fig. S8), likely reflecting local pressure gradients and lattice relaxation. This pressure lies near the known structural phase boundary of undoped LaH10, where transitions to lower-symmetry structures such as \(R\bar{3}m\) or \(C2/m\) typically occur6,12. The persistence of both clathrate phases at 136 GPa suggests that Y substitution extends the structural stability of LaH10-type phases to lower pressures than observed in the undoped system6,12.
In DAC #2, after initial synthesis at 172 GPa and characterization at 168 GPa, the sample was decompressed to 161 GPa. At this pressure, both the \({Fm}\bar{3}m\) and \(P{6}_{3}/{mmc}\) phases are clearly present (Fig. S4), in contrast to binary La hydrides where the cubic phase typically dominates6,10. The coexistence of both clathrate phases at this stage of decompression underscores the role of Y substitution in stabilizing structural polymorphism beyond that observed in undoped LaH106,9,10,12. The repeated observation of both phases across the 168−136 GPa range demonstrates persistent coexistence rather than distinct, pressure-stabilized states. Their simultaneous presence indicates that ~10% Y substitution promotes polymorphic coexistence under our synthesis and decompression conditions, rather than favoring a single dominant structure. This contrasts with LaH10, which transforms to lower-symmetry structures upon decompression6,9,10,11,12. The spatial variation and distribution of the cubic and hexagonal domains, further examined through diffraction imaging, highlight the complexity of phase coexistence near the clathrate stability boundary.
The pressure–volume (P–V) behavior of (La0.9Y0.1)H10, shown in Fig. S4, generally follows the trend reported for undoped LaH10, with modest phase-specific deviations that point to non-uniform compressibility and local strain effects. Similar trends were reported for (La0.8Y0.2)H10 synthesized at higher pressures22, where clathrate structures remained stable without decomposition. These results demonstrate that partial Y substitution preserves the hydrogen cage framework of LaH10 while extending phase coexistence across a broader pressure range22,23. Such structural robustness provides the basis for linking local phase heterogeneity to superconducting behavior, as discussed in the following sections.
Spatial mapping of structural domains via SXDM and XDI
Spatial phase mapping at 153 GPa revealed μm-scale coexistence of \({Fm}\bar{3}m\) and \(P{6}_{3}/{mmc}\) clathrate domains. Using SXDM at HPCAT-U, diffraction patterns were collected across a 30 × 30 μm2 region with ~3 μm steps. XDI-based analysis identified phase-specific intensity distributions by integrating the first two Bragg reflections unique to each structure, producing two-dimensional maps of local phase domains. Figure 2 shows XDI maps at 153 GPa resolving the FCC and HCP phases, correlated with the 2D X-ray scan and the optical image of the sample after laser heating. Image analysis of the domain maps indicates that the cubic phase covers approximately 42% of the mapped region, while the hexagonal phase accounts for 58%.
Fig. 2: Spatially resolved XRD imaging of phase domains in (La0.9Y0.1)H10 at high pressure.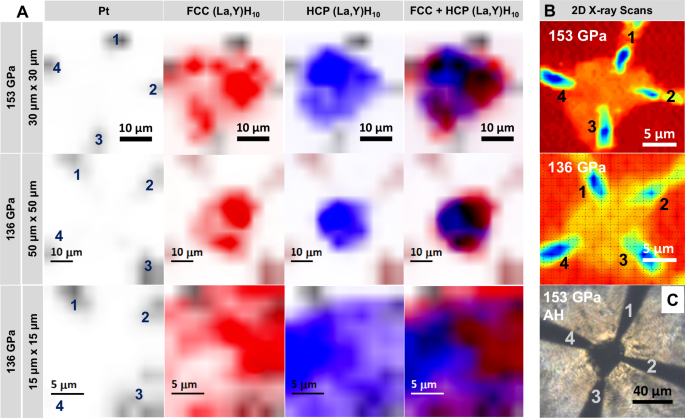
A XDI maps of the laser-heated (La,Y)H10 sample at 153 GPa (top) and 136 GPa (middle and bottom), obtained via raster scanning with a ~1 μm focused synchrotron beam. The 30 × 30 μm2 scan at 153 GPa resolves spatial distributions of cubic \({Fm}\bar{3}m\) (red) and hexagonal \(P{6}_{3}/{mmc}\) (blue) domains, with Pt leads mapped in dark gray or brown. Electrode positions are annotated directly on the Pt to enable spatial correlation with electrical transport measurements. The rightmost column overlays all phases to show the composite spatial distribution. At 136 GPa, a 50 × 50 μm2 scan (middle) and a higher-resolution 15 × 15 μm2 scan (bottom) show continued coexistence of FCC and HCP domains with spatial variation. B 2D X-ray scan overview of the sample at respective pressures. C Optical image of the sample at 153 GPa after laser heating.
The \({Fm}\bar{3}m\) phase is localized in discrete clusters near Pt leads #2, #3, and #4, with the largest fraction around lead #2 where excess ammonia borane was present (Fig. 2A). By correlating optical images before and after laser heating (Fig. S3) with the XDI maps, the interface between the sample and ammonia borane is identified between leads #2 and #3, consistent with regions of higher temperature and greater hydrogen availability favoring the \({Fm}\bar{3}m\) phase, while regions farther from this interface exhibit a higher fraction of the \(P{6}_{3}/{mmc}\) phase, forming a continuous matrix between leads #1 and #4 (Fig. 2A). These correlations indicate that the observed structural inhomogeneity most likely arises from variations in hydrogen content and laser heating geometry9,10,12. As shown in Fig. S9, the local pressure gradient does not correlate with FCC/HCP boundaries, indicating that pressure is not the dominant factor in domain arrangement at synthesis conditions. While phase coexistence is common in multiphase hydride systems10,22, the ability to directly image μm-scale domain structure at this resolution provides a valuable framework for linking local structural environments with superconducting behavior, as discussed in the following sections.
Additional raster scans were performed at 136 GPa after decompression (Fig. 2A). Two maps, a broader 50 × 50 μm2 grid and a focused 15 × 15 μm2 grid, were collected from the same central region and are shown in Fig. 2. In the larger scan, the \({Fm}\bar{3}m\) phase exhibits reduced intensity near Pt lead #4 compared to the 153 GPa map, while the \(P{6}_{3}/{mmc}\) phase remains more uniformly distributed across the sample chamber. The composite map again shows dominance of the hexagonal phase between leads #1 and #4, and clustering of the cubic phase around leads #2 and #3. The smaller scan offers a higher-resolution view of the local phase distribution and confirms the persistence of structural heterogeneity upon decompression.
The use of a micro-focused beam combined with SXDM enabled spatial mapping of phase-separated regions within the sample that may be challenging to resolve using conventional bulk XRD techniques. The spatial resolution in this study was chiefly governed by the ~1 μm beam size of APS-U and the small raster step size used during SXDM. Together, these parameters enabled fine spatial sampling across the sample chamber, allowing detection of μm-scale structural variations. Prior applications of XDI have demonstrated its effectiveness in visualizing structural gradients and preferred nucleation patterns in FeHx33, H3S34, H235, and La–Y–Ce–H36 systems. However, earlier studies often had overlapping grids or had limited phase assignment capability due to reduced flux or detector sensitivity. The ability to resolve discrete \({Fm}\bar{3}m\) and \(P{6}_{3}/{mmc}\) domains across the sample provides unique insight into structural heterogeneity. These spatially resolved maps form the foundation for linking local phase composition with superconducting behavior, as discussed below.
Superconductivity in coexisting phases
Four-probe DC resistance measurements were carried out on the (La0.9Y0.1)H10 sample in DAC #1 following structural characterization. As shown in Fig. 3A, resistance vs. temperature curves collected during warming cycles at four pressures between 153 and 136 GPa consistently display two distinct superconducting transitions. At 153 GPa, the first resistance drop begins at Tc,onset = 244 K, followed by a second transition near Tc,onset = 220 K (Fig. S10). The total transition width of ΔT ≈ 28 K is unusually broad for DC transport measurement and is characteristic of phase coexistence and electronic heterogeneity37.
Fig. 3: Superconducting behavior of (La,Y)H10 during decompression and comparison with literature.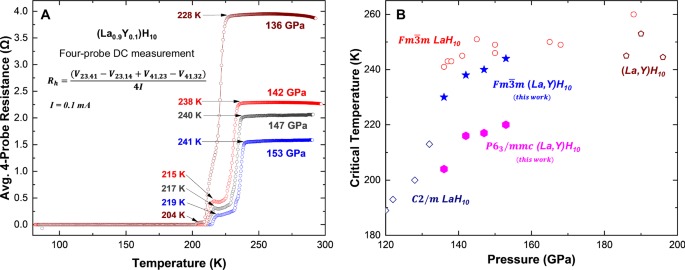
A Temperature-dependent four-probe DC resistance measurements of (La,Y)H10 collected at multiple pressures during decompression from 153 to 136 GPa, using an excitation current of 0.1 mA. The curves represent the average four-probe resistance, calculated as shown in the inset to eliminate thermoelectric offsets. Distinct drops in resistance indicate superconducting transitions that persist across the entire pressure range. B Critical temperature (Tc) as a function of pressure for LaH10 and (La,Y)H10 hydrides. Open symbols represent Tc values of LaH10 and (La,Y)H10 reported in the literature9,10,11,12,22. Solid symbols indicate Tc values of (La,Y)H10 obtained in this work.
To further investigate the origin of these transitions, the temperature dependence of eight partial resistance traces [Rab,cd(T)] were collected using the standard VDP permutations, involving four voltage pairs and two current paths, as shown in Fig. 4. Each measurement configuration was overlaid onto the composite XDI phase map, enabling direct spatial correlation between structural domains and electronic behavior. Notably, configurations such as R34,12, R34,21, R41,23, and R41,32 (Fig. 4B, D) exhibited a sharp superconducting drop near 240 K, with a narrow transition width of ΔT < 10 K. These measurements probed regions between electrodes #3 and #4 and between #4 and #1, with voltage recorded across electrodes #1 and #2 or #2 and #3. Based on the spatial maps shown in Fig. 2, these current–voltage pathways intersected domains where the \({Fm}\bar{3}m\) phase was concentrated, particularly near electrode #2. This spatial correlation supports the assignment of the higher-temperature superconducting transition to the \({Fm}\bar{3}m\) clathrate phase.
Fig. 4: Spatial correlation between superconducting transitions and structural domains in (La0.9Y0.1)H10 at 153 GPa.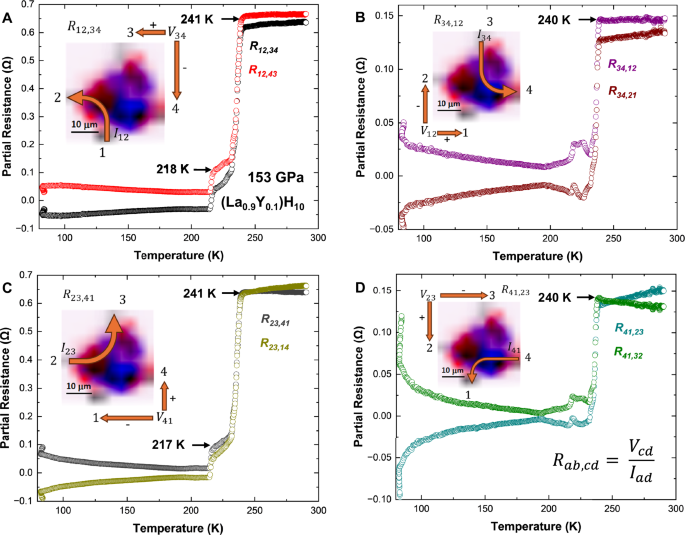
A–D Temperature-dependent four-probe partial resistance traces (Rab,cd) measured using eight current–voltage configurations are grouped into four panels corresponding to distinct current paths: A R12,34 and R12,43; B R34,12 and R43,21; C R23,41 and R23,14; D R41,23 and R41,32. Each plot includes a schematic of the corresponding current path overlaid on the composite XDI map, highlighting the spatial distribution of cubic \({Fm}\bar{3}m\) (red) and hexagonal \(P{6}_{3}/{mmc}\) (blue) phases. Electrode positions and current directions are annotated. Configurations that differ only by voltage polarity (e.g., R34,12 vs. R34,21) are spatially equivalent; for clarity, only one representative XDI map is shown for each pair. Partial resistance traces corresponding to current paths intersecting FCC-enriched domains (e.g., R34,12, R41,23) exhibit sharp superconducting transitions near 240 K with narrow widths (ΔT < 10 K). In contrast, broader or multi-step transitions are observed in configurations that sample mixed-phase or HCP-dominated regions (e.g., R12,34, R23,14), with onsets near 241 and 218 K. We note that due to single permutations inability to account for voltage drops due to the Seebeck effect, partial resistances exhibit negative values below Tc49. Averaging reverse-biased polarities corrects for this instrumental artifact, causing an apparent drop to zero resistance. These observations establish a direct spatial correlation between local structural heterogeneity and superconducting behavior.
In contrast, other partial resistance configurations, such as R12,34, R12,43, R23,41, and R23,14 (Fig. 4A, C), exhibited broader, two-step transitions, with onsets near 241 K and 218 K, respectively. These configurations passed through regions where both \({Fm}\bar{3}m\) and \(P{6}_{3}/{mmc}\) phases were present, with a higher fraction of the hexagonal phase observed between electrodes #1 and #4. The lower-temperature transition was thus attributed to the \(P{6}_{3}/{mmc}\) clathrate phase. This interpretation is consistent with previously reported superconducting transition temperatures in undoped and Y-substituted LaH10 systems (Fig. 3B)9,10,22. Notably, both transitions occurred at lower onset temperatures than in pure LaH10, where Tc typically exceeds 250 K under similar pressures9,10,11. The observed Tc suppression provides complementary evidence of successful Y incorporation and its influence on the electronic structure, particularly through added intermediate-frequency phonon modes15,22. Furthermore, the direct correlation between partial resistances and spatial phase distribution underscores the utility of structural mapping for interpreting superconducting transport behavior in mixed-phase systems.
To evaluate the pressure dependence of superconductivity in the coexisting clathrate phases of (La0.9Y0.1)H10, resistance measurements were performed during decompression from 153 to 136 GPa (Fig. 3A). Across this pressure range, the resistance–temperature profiles consistently displayed two distinct superconducting transitions, indicative of phase coexistence. Additional support for superconductivity comes from current–voltage (I–V) curve measurements at 146 and 136 GPa (Fig. S11), which exhibit nonlinear behavior below ~230 K at 146 GPa. Notably, the overall resistance behavior and partial resistance traces remained similar down to 142 GPa (Fig. S12). Consistent with measurements at higher pressure, all transition temperatures at each pressure during decompression occurred within experimental uncertainty across the eight configurations, confirming that the observed features are intrinsic to the sample. At 136 GPa, a marked departure from the previous Rh–T profiles were observed (Fig. 3). The two-step superconducting features became less distinct, and the transition width narrowed (ΔT ~20 K), particularly in partial resistances such as R12,34, R12,43, R23,41, and R23,14 (Fig. S13). These current paths intersect regions where the spatial phase map (Fig. 2) indicated reduced \({Fm}\bar{3}m\) intensity near Pt lead #4, consistent with diminished cubic phase contributions at lower pressures.
Meanwhile, traces such as R34,12, R34,21, R41,23, and R41,32 still exhibited sharp resistance drops, with more pronounced secondary features. These traces traverse regions around Pt leads #2 and #3, where the \({Fm}\bar{3}m\) phase remained spatially concentrated even after decompression. The persistence of sharp transitions in these configurations suggests that residual cubic domains retain superconductivity near 228 K, albeit with reduced volume fraction. Structural data at 136 GPa revealed minor distortions in Bragg peak positions of the \({Fm}\bar{3}m\) phase (Fig. S8), as previously discussed in the structural characterization section. These distortions likely reflect lattice relaxation and non-uniform pressure gradients, and correlate with the observed suppression of the higher-Tc onset from 238 K at 142 GPa to 228 K at 136 GPa, a more rapid decline than typically reported in binary LaH10 systems9,10,12. While pure LaH10 transitions to lower-symmetry \(C2/m\) or \(R\bar{3}m\) phases near this pressure, no such transformations were evident here6,12, suggesting that the observed Tc suppression arises from phase dilution, lattice strain, and microstructural inhomogeneity, mechanisms known to influence superconductivity in clathrate hydrides9,10,12,38.