
The precision of protein identification is the cornerstone of modern proteomics, serving as the critical link between raw mass spectrometry (MS) data and biological insight. As liquid chromatography-tandem mass spectrometry (LC-MS/MS) continues to evolve, the complexity of the resulting datasets requires a rigorous, multi-faceted approach to data interpretation. For laboratory professionals, understanding the transition from peptide-spectrum matches (PSMs) to confident protein assignments is essential for ensuring reproducibility and biological relevance. This article examines the technological principles and statistical frameworks necessary to validate protein identification results within high-throughput workflows, providing a roadmap for navigating the nuances of modern analytical proteomics.
The analytical foundations of peptide-spectrum matching
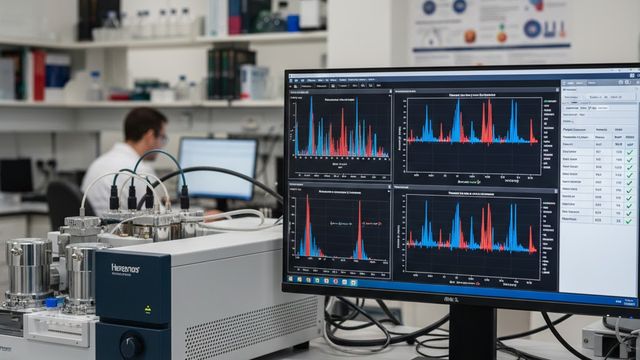
The process of protein identification typically begins with a bottom-up approach, where proteins are enzymatically digested—most commonly with trypsin—into smaller peptides. These peptides are separated by liquid chromatography and introduced into the mass spectrometer, where they undergo fragmentation. The resulting tandem mass spectra (MS/MS) serve as the fundamental unit of evidence, representing a “fingerprint” of the peptide sequence based on the mass-to-charge (m/z) ratios of its fragment ions.
Search engines utilize various algorithms to compare these experimental spectra against theoretical spectra derived from a protein sequence database, such as UniProt or RefSeq. The identification process relies on calculating a match score, often based on cross-correlation or probability-based modeling. This score indicates how well the observed peaks align with the predicted b-ion and y-ion series of a theoretical peptide.
However, a high score does not inherently guarantee a correct identification. Factors such as chemical noise, incomplete fragmentation, or unexpected post-translational modifications (PTMs) can lead to false positives. To mitigate these risks, researchers must evaluate the quality of the PSMs. This includes verifying that the major fragment ions are accounted for and that the mass accuracy remains within the specified tolerance of the instrument. For high-resolution systems, this tolerance is often set to less than 5 to 10 parts per million (ppm).
Key components of spectral quality
Signal-to-noise ratio: Higher ratios increase the likelihood that low-intensity fragment ions represent true sequence information rather than background noise. Fragment ion coverage: A confident match typically requires a contiguous series of ions that cover a significant portion of the peptide backbone. Precursor mass accuracy: The deviation between the observed and theoretical mass of the intact peptide must fall within a narrow, statistically defined window. Enzymatic specificity: Adherence to the cleavage rules of the enzyme used (e.g., trypsin cleaving at lysine and arginine) provides additional confidence in the match.
Statistical validation through the target-decoy search strategy
In large-scale proteomics, the volume of data generated makes manual validation of every spectrum impossible. Consequently, the field has adopted the target-decoy approach to estimate and control the false discovery rate (FDR) (Table 1). This involves searching the MS/MS spectra against a combined database containing both target (real) sequences and decoy (reversed or shuffled) sequences.
The fundamental assumption of this approach is that matches to decoy sequences represent random, incorrect identifications. By counting the number of decoy hits that pass a certain score threshold, the FDR can be calculated. The standard formula used is: FDR = (2 * Decoy Hits) / (Target Hits + Decoy Hits). This provides a global estimate of the error within the dataset.
Table 1. Comparison of statistical metrics for validation
Metric
Description
Application in workflow
q-value
The minimum false discovery rate at which a specific match is accepted.
Used to threshold individual peptide identifications across a dataset.
Posterior error probability
The probability that a specific, individual identification is a false positive.
Useful for evaluating the confidence of specific assignments in a single sample.
Protein-level false discovery rate
A global estimate of error calculated at the level of protein groups rather than peptides.
The standard reporting metric for final published protein lists.
Score thresholding
The application of a minimum search engine score based on statistical distribution.
Initial filter used to remove low-confidence data before higher-level processing.
Applying a 1% FDR at both the peptide and protein levels is the current industry standard for peer-reviewed research. However, researchers must be cautious of FDR inflation. This phenomenon can occur when the decoy database is inadequately constructed or when the dataset is too small to provide a stable statistical distribution.
Navigating the complexities of the protein inference problem
One of the most significant challenges in protein identification is the protein inference problem. Because bottom-up proteomics analyzes peptides rather than intact proteins, a single peptide sequence may be shared across multiple protein isoforms or members of a homologous protein family. These are referred to as shared or degenerate peptides.
To resolve this ambiguity, bioinformatic pipelines typically employ the principle of parsimony, also known as Occam’s razor. The software attempts to generate the smallest list of proteins that can account for all the observed peptides in the sample. In many cases, these proteins are reported as “protein groups” to acknowledge that the data cannot definitively distinguish between certain closely related sequences.
Strategies for resolving protein ambiguity
Utilization of proteotypic peptides: These are peptide sequences unique to a single protein or isoform. Confident identification requires at least one, and preferably two, of these unique peptides. The two-peptide rule: Most laboratories require a minimum of two peptides per protein to consider the identification valid, which significantly reduces the impact of random PSM errors. Weighting schemes: Some algorithms assign higher weight to unique peptides when calculating the overall protein confidence score. Integration of transcriptomic data: Using sample-specific genomic data can help refine the search database and identify specific isoforms present in the biological system.
Identifications based on a single peptide, often called “one-hit wonders,” are subject to higher scrutiny. These results often require manual spectral validation or targeted follow-up via multiple reaction monitoring (MRM) to confirm their presence.
The impact of post-translational modifications on identification accuracy
The identification of PTMs, such as phosphorylation, ubiquitination, or acetylation, introduces another layer of complexity to data interpretation. Interpreting these results requires not only identifying the peptide sequence but also accurately localizing the modification to a specific amino acid residue.
Localization scores, such as the A-score or PTM-score, are used to determine the probability that a modification is correctly placed on the sequence. If the fragment ions that distinguish two potential sites (site-determining ions) are missing from the spectrum, the modification site remains ambiguous. In such cases, the result should be reported as a modified peptide region rather than a specific site.
Furthermore, the mass shift associated with the PTM must be precisely measured. Some modifications have nearly identical masses; for example, trimethylation and acetylation both result in a mass shift of approximately 42 Daltons. Distinguishing between these requires high-resolution mass spectrometry and an analysis of the immonium ions or specific fragment patterns associated with each modification.
Enhancing identification confidence with data quality control
Modern proteomics workflows incorporate several layers of quality control (QC) beyond simple score thresholding. One critical aspect is the evaluation of retention time (RT) stability. Peptides should elute in a predictable order based on their hydrophobicity. If a peptide identification occurs far outside its predicted RT window, it may indicate a false positive match.
Additionally, the distribution of mass errors across the entire dataset should be centered around zero. A systematic shift or “drift” in mass accuracy suggests that the instrument requires recalibration. Many software packages now include automated “lock mass” correction or post-acquisition recalibration tools that adjust the data based on the most confident identifications, further refining the accuracy of the final results.
Future directions in computational proteomics and identification
The future of protein identification lies in the integration of machine learning and deeper library-based approaches. Deep learning models are now being used to predict peptide fragmentation patterns and retention times with remarkable accuracy. This allows for spectral library searching, where experimental spectra are compared against a library of previously identified or predicted spectra, often outperforming traditional database searching in terms of sensitivity and speed.
Additionally, the rise of data-independent acquisition (DIA) is shifting the focus from identifying discrete precursor ions to capturing a comprehensive digital record of the entire sample. DIA requires new computational strategies for spectral deconvolution, as multiple peptides are fragmented simultaneously. As these technologies advance, the necessity for standardized reporting and rigorous statistical frameworks remains unchanged. The ability to distinguish true biological signals from analytical noise will continue to define the success of proteomic research in clinical and academic settings.
This content includes text that has been created with the assistance of generative AI and has undergone editorial review before publishing. Technology Networks’ AI policy can be found here.