
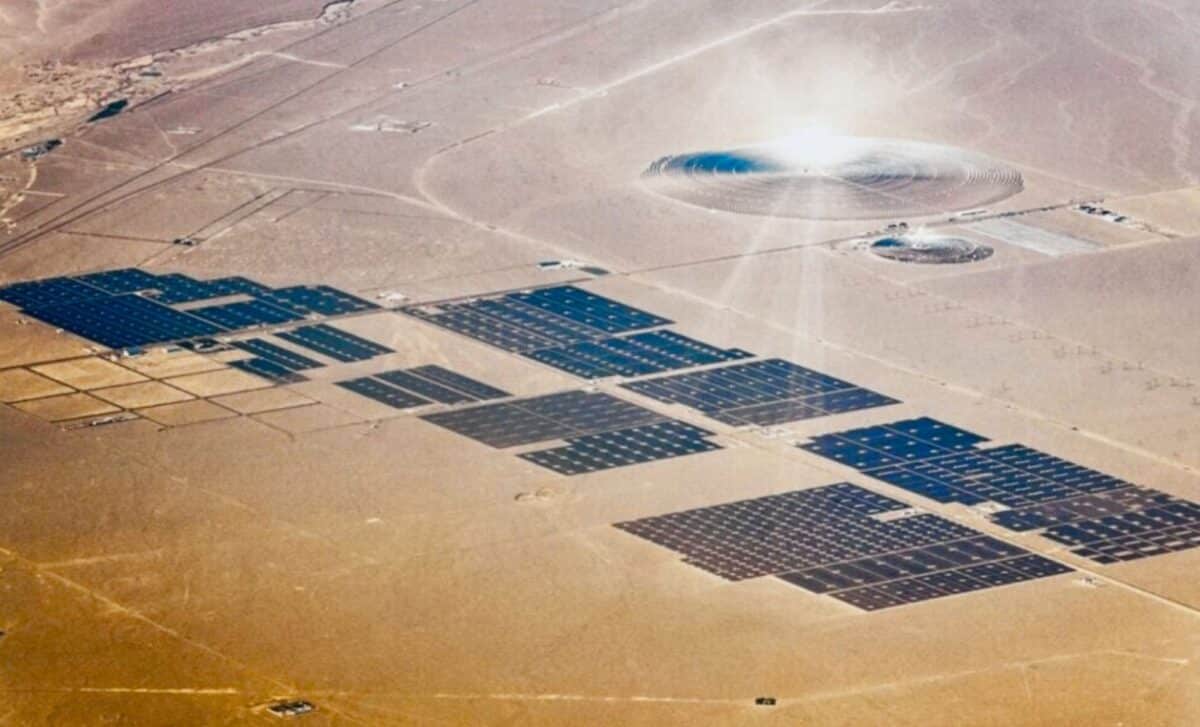
The 1-gigawatt photovoltaic array spreads across the Talatan plateau in China’s Qinghai Province like a mechanical forest, its panels angled uniformly toward the southern sky. Engineers installed them there beginning in 2012 with a straightforward objective: generate electricity from one of the most sun-baked landscapes in the upper Yellow River watershed. What they did not anticipate was that the infrastructure would begin rewriting the rules of the local ecology.
Seven years after construction completed, a team from Xi’an University of Technology arrived to conduct something no one had attempted at this scale: a systematic, quantitative assessment of how desert photovoltaic development actually changes the environment it occupies.
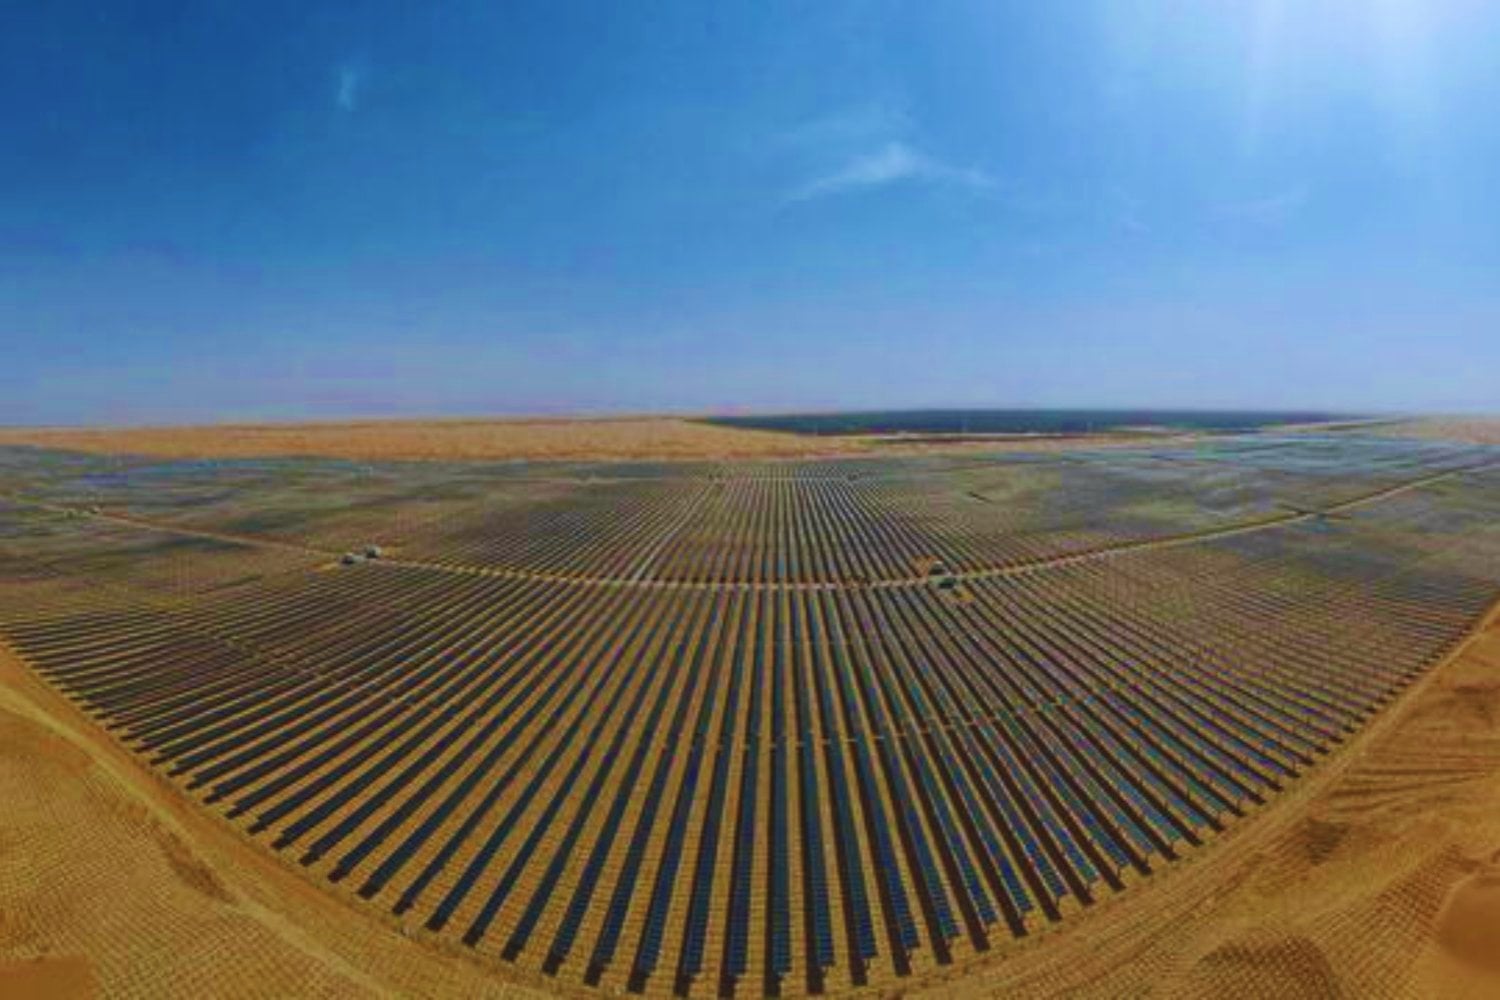
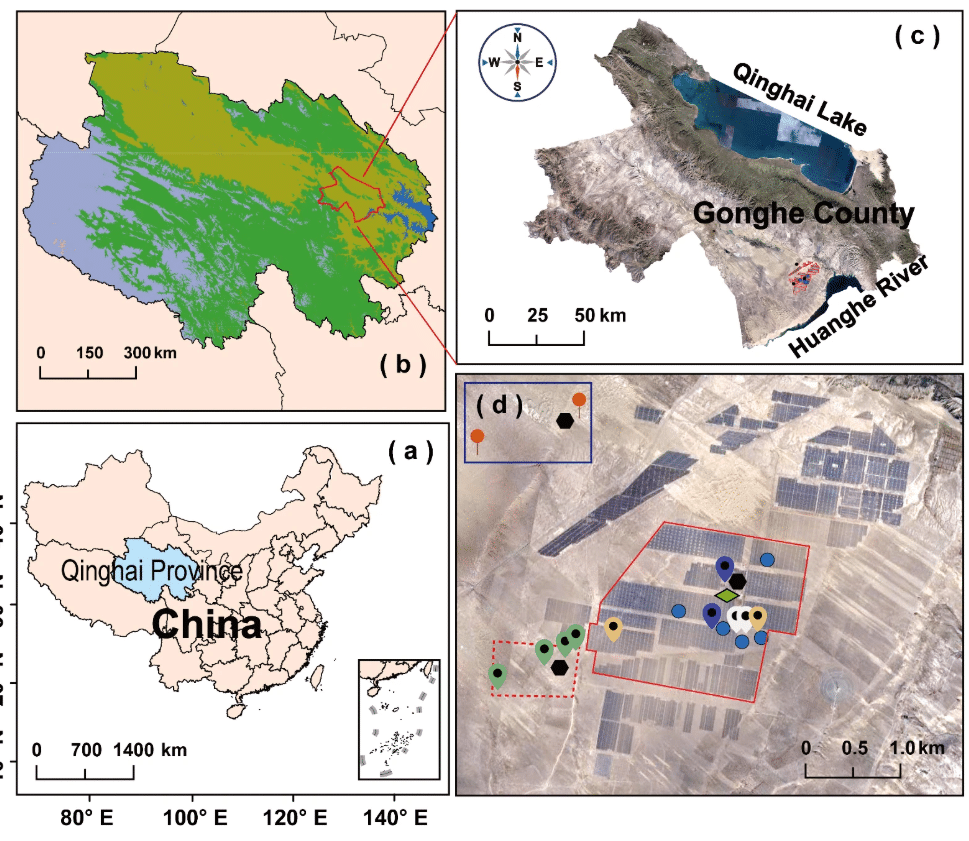 Geographical location of the Gonghe Photovoltaic Park and distribution of observation points. © ArcGIS 10.8/NASA
The researchers established monitoring stations, dug soil samples, counted plant species, and tracked microclimate data every 30 minutes for more than a year. Their findings, published in the journal Scientific Reports, suggest that solar farms in arid regions do not simply sit atop existing ecosystems—they actively generate new ones.
Where the Panels End, the Divide Begins
The research team divided the landscape around the Qinghai Gonghe Photovoltaic Industrial Park into three categories for comparison. Inside the facility boundaries, they designated on-site areas for intensive study. Just beyond the panels, they established transitional zones at distances of 200, 600, and 1,500 meters from the installation’s edge. Further removed, they selected off-site reference locations representing baseline desert conditions.
Using the Driving-Pressure-State-Impact-Response framework recommended by the European Environment Agency, the researchers evaluated 57 distinct indicators spanning vegetation, soil chemistry, microbial communities, and microclimate variables. Data collection combined real-time monitoring from stations installed between June 2019 and July 2020, vegetation surveys conducted across 36 sample plots, and official statistical records.
 © Unsplash – Antonio Garcia.
The standardized scores that emerged told a clear story. On-site areas registered 0.439 on the evaluation scale, placing them in the “general” category. The transitional zone scored 0.286, and off-site areas scored 0.28, with both falling into the “poor” classification.
The study states explicitly: “The WPS had better ecological and environmental conditions than did the TPS and OPS, and the ecological and environmental evaluation levels of the WPS were categorized as ‘general’ (0.439), while the ecological and environmental effect evaluation levels of the TPS (0.286) and OPS (0.28) were both ‘poor’.”
What 1.65 Meters of Silicon Does to the Soil
The physical configuration of the solar installation explains much of what the researchers observed. Each panel measures 1.65 meters in length and 1 meter in width, with a 2-centimeter gap between adjacent units. Mounted on fixed, semi-tracking, and tracking brackets, the panels sit with their lower edges 0.5 meters above ground and upper edges reaching 3.03 meters. The 39-degree tilt angle and 6.87-meter north-south spacing create a patterned environment where ground surfaces receive intermittent shade throughout daylight hours.
This arrangement modifies conditions at the soil surface in ways that matter for biological processes. The panels intercept incoming solar radiation before it reaches the ground, reduce wind speeds near the surface, and lower evaporation rates. In a location where annual precipitation averages 246.3 millimeters while potential evaporation reaches 1,716.7 millimeters, even modest reductions in moisture loss can shift the threshold for plant establishment and survival.
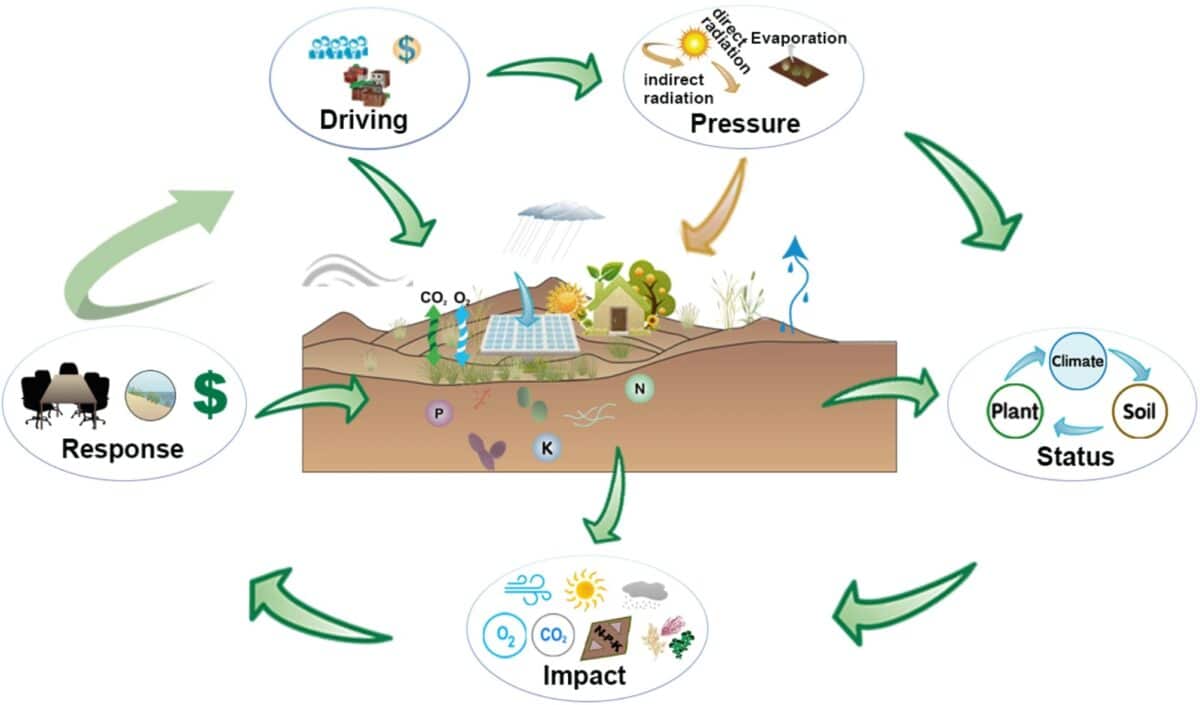 The logical relationships within the Driving-Force-Pressure-Status-Impact-Response (DPSIR) model. In this model, the driving force (D) associated with human activities results in fluctuations in ecosystem pressure (P), which in turn alters the state of the ecosystem (S) and subsequently impacts the ecosystem (I). This dynamic also prompts governmental or societal responses (R) to address the driving forces. ©
The study area sits within the Gonghe Basin, described in the research as “the region most affected by salinization in the upper part of the Yellow River” and characterized by “semifixed and mobile sand dunes.” Native vegetation includes annual herbaceous plants such as Achnatherum splendens, Stipa breviflora, and Leymus chinensis. Independent analysis published on Medium has highlighted how these findings challenge conventional assumptions about solar development in sensitive environments.
Fifty-Seven Ways to Measure a Transformation
Determining which factors most influenced environmental conditions required a method for assigning relative importance to different measurements. The researchers employed the entropy weight method, a statistical technique that gives greater weight to indicators showing less variability across measurement points.
The resulting framework organized indicators across five categories corresponding to the DPSIR model components. Driving forces encompassed demographic and economic data drawn from official publications.
 © Mokun Renewables
Pressure indicators captured natural factors such as surface effective radiation. State indicators tracked changes in soil and climate conditions. Impact indicators measured effects on soil nutrient content and biodiversity. Response indicators documented ecological remediation efforts.
For indicators where administrative boundaries made direct comparison difficult, the researchers converted relevant metrics based on population differences between areas inside and outside the photovoltaic field.
Why This Desert Isn’t All Deserts
The Qinghai Gonghe facility represents a specific set of conditions that may not translate directly to other desert environments. Located at an average altitude of 2,910 meters, the site experiences what the study describes as a “typical alpine arid desert and semiarid grassland” climate with an average annual temperature of 4.1 degrees Celsius.
Whether similar ecological effects would emerge in low-altitude hot deserts remains undetermined. The study examined a single facility with approximately five to six years of operational history at the time of data collection, a fraction of the 20-to-30-year expected service life of photovoltaic systems.
The research notes that the photovoltaic park “employs non-transparent monocrystalline silicon or polycrystalline silicon materials as the core components of the photovoltaic panels” but does not assess whether different panel technologies would produce different environmental outcomes.
The authors acknowledge that prior research has “primarily focused on qualitatively evaluating the ecological and environmental impacts of photovoltaic development” with “a noticeable gap in research regarding the quantitative assessment.” Science writers covering renewable energy infrastructure have noted the significance of this quantitative approach for future environmental impact assessments