
Principle: prethermal DTC lifetime extension by a.c. fields
The system consists of a diamond crystal with 13C nuclear spins hyperpolarized by optically pumped nitrogen-vacancy (NV) centres (Fig. 1a). The 13C nuclei, at natural abundance, are randomly distributed and influenced by fluctuating fields from lattice NV and P1 centres44,45. Spins interact via magnetic dipole interactions, \({{\mathcal{H}}}_{dd}={\sum }_{k < l}{J}_{kl}(3{I}_{k}^{z}{I}_{l}^{z}-{{\bf{I}}}_{k}\cdot {{\bf{I}}}_{l})\), with spin–spin coupling strengths Jkl, and median coupling strength J ≈ 0.6 kHz (ref. 46) determined via free induction decay; \({I}_{k}^{\alpha }\) are spin-1/2 operators for 13C nuclear spin k and the total polarization is \({I}^{\alpha }={\sum }_{k}{I}_{k}^{\alpha }\), α = x, y, z.
Fig. 1: System and principle.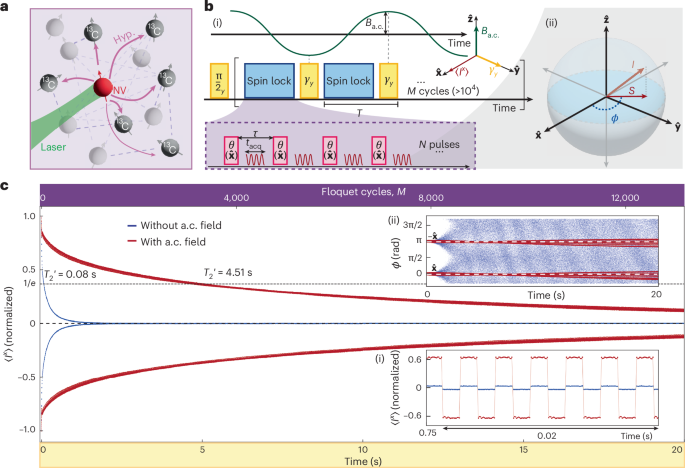
a, System consists of dipolar interacting 13C nuclear spins, hyperpolarized by NV centres using optical and chirped microwave excitation. b, Protocol. (i) Evolution under native dipole–dipole interactions, \({{\mathcal{H}}}_{dd}\) (see the main text) is interrupted by a concatenated two-tone drive with N spin-lock (pink) \(\theta (\widehat{{\bf{x}}})\) pulses separated by τ, interspersed with spin-flip\(\gamma (\widehat{{\bf{y}}})\) pulses (yellow). This time block (total period, T) is repeated M times. The protocol causes switching between \(\widehat{{\bf{x}}}\leftrightarrow -\widehat{{\bf{x}}}\) every t = Nτ, remaining robust against deviations γy = π + ϵ, forming a PDTC. Additionally, a \(\widehat{{\bf{z}}}\)-oriented a.c. field (green) with amplitude Ba.c. and frequency fa.c. is applied; the resonant case \({f}_{AC}={f}_{res}=1/(2T)\) is shown. (ii) Net spin magnetization I is monitored during acquisition time tacq ≈ 13.6 μs between the θx pulses. Projection S onto the 13C nuclear spin’s rotating frame \(\widehat{{\bf{x}}}-\widehat{{\bf{y}}}\) plane and its phase ϕ are measured. c, Main result. Magnetization 〈Ix〉 for the PDTC protocol without (blue) and with (red) applied resonant a.c. field. Here N = 16; pulse separation τ (36 μs); (π/2)y and θx pulses (~50.25 μs); γy pulse (~98.5 μs); Ba.c. = 82.4 μT with \({f}_{res}=330\) Hz. The top axis indicates the number of flips M. The dashed line indicates the 1/e intercept, yielding lifetimes of \({T}_{2}^{{\prime} }=80\,ms\) without an a.c. field and \({T}_{2}^{{\prime} }=4.51\,s\) with an a.c. field. Data show M > 13,000 〈Ix〉 flips sustained over t = 20 s. (i) Zoomed-in view of the data in a small 20-ms window at t = 0.76 s, displaying magnetization switching from \(-\widehat{{\bf{x}}}\) to \(\widehat{{\bf{x}}}\). Lifetime extension under a.c. field is evident from the increased amplitude of the red data points. (ii) Tracked phase ϕ for data from the main panel, displaying a coherent signal far beyond the 1/e decay time. \(\widehat{{\bf{x}}}\,(-\widehat{{\bf{x}}})\) rails correspond to phases 0 (π), respectively. Decoherence in the non-a.c. case leads to ϕ spread uniformly in [−π, π] (blue data points). The a.c. field leads to a notable lifetime increase (red).
A U(1) prethermal DTC (PDTC) is created using the two-tone drive protocol from ref. 10 (Fig. 1b(i)). Hyperpolarization initializes the 13C nuclear spins in the \(\widehat{{\bf{x}}}\)-polarized state ρ0 ∝ Ix, after which the two-tone drive is activated. The first spin-lock drive, consisting of \(\widehat{{\bf{x}}}\)-oriented θ pulses separated by period τ, realizes an effective Hamiltonian Heff with emergent U(1) symmetry: [Heff, Ix] = 0.
The second drive (period T) establishes the PDTC order via superimposed \(\widehat{{\bf{y}}}\) pulses of angle γy (~π), applied after every Nth spin-lock pulse. The 13C nuclear spins are inductively interrogated between pulses via a radio-frequency cavity; a downsampling technique47 (Methods) enables the quasi-continuous monitoring of their projection onto the \(\widehat{{\bf{x}}}\,-\,\widehat{{\bf{y}}}\) plane directly in the rotating frame (Fig. 1b(ii)). Net projection is denoted as S, and the phase in the \(\widehat{{\bf{x}}}\,-\,\widehat{{\bf{y}}}\) plane is ϕ (Fig. 1b(ii)). Continuous interrogation with the two-tone drive allows full time-trace read-out in a single shot (key for quantum sensing) and distinguishes it from single-tone drives commonly used in other systems4,8,12 (Supplementary Section IIC).
PDTC order, arising from emergent U(1) symmetry, is characterized by robust period doubling, seen in the long-lived oscillation of polarization 〈Ix〉 with period 2T (ref. 10). This is shown in Fig. 1c (blue data points), with the number of cycles M of the DTC γy drive on the top axes. The decay of 〈Ix〉 has a characteristic 1/e time, \({T}_{2}^{{\prime} }=79\,ms\), which is much longer than \({T}_{2}^{* }=1.5\,ms\) (ref. 46). The purple data points in Fig. 1c(i) (inset) provide a zoomed-in view at t = 0.75 s.
The PDTC decay can be understood by noting that the initial state (\({\rho }_{0} \sim {\mathbb{1}}+\mu {I}^{x}\)) corresponds to a zero-energy state with respect to the effective Hamiltonian, \({\langle {H}_{e\mathrm{ff}}\rangle }_{{\rho }_{0}}=0\). The eigenstate thermalization hypothesis (ETH)48,49,50,51 implies that without conservation laws, the system prethermalizes to a featureless infinite-temperature (\({\mathcal{T}}=\infty\)) state, \({\rho }_{{\mathcal{T}}=\infty } \sim {\mathbb{1}}\). For U(1) quasi-conservation, prethermalization is restricted to states with the same polarization. However, small symmetry-breaking perturbations restore prethermalization to an infinite temperature. In particular, higher-order corrections to Heff in the two-tone drive break U(1) conservation, leading to an inverse decay time (heating rate) Γe = 1/Te ∝ (JT)2 (refs. 10,46; Supplementary Section 6).
We now consider the effect of a resonant a.c. magnetic field, Ba.c.(t)Iz, with frequency \({f}_{res}\), aligned along \(\widehat{{\bf{z}}}\) and locked to the DTC γy kicks (Fig. 1b(i), green line). We show (Supplementary Section 6) that it exponentially extends the lifetime of the U(1) PDTC order by the Floquet engineering of a finite energy density40, forming the basis for the sensor operation.
To understand this, note that the a.c. field induces an effective coupling to the PDTC order parameter (−1)ℓIx, that is, Heff → Heff,ℓ,a.c. = Heff + (−1)ℓBIx, which, like the DTC response, alternates in sign for each T-period ℓ, where the the coupling B ∝ Ba.c. is proportional to the a.c. field strength. Considering the effective Hamiltonian every even period, Heff,a.c. = Heff + BIx, the DTC-ordered initial state, \({\rho }_{0} \sim {\mathbb{1}}+\mu {I}^{x}\), acquires a finite energy density, \({\langle {H}_{{\rm{e}}\mathrm{ff},{\rm{a}}.{\rm{c}}}\rangle }_{{\rho }_{0}}={\langle {H}_{{\rm{e}}\mathrm{ff}}\rangle }_{{\rho }_{0}}+{\langle {I}^{x}\rangle }_{{\rho }_{0}}\propto \mu B\), controlled by the a.c. field (Supplementary Section 6).
Thus, the a.c. field creates a finite energy density from the PDTC order, leading the PDTC to prethermalize to a finite-temperature state, \({\rho }_{{\mathcal{T}}}\propto \exp (-{H}_{e\mathrm{ff},AC}/{\mathcal{T}})\), even with symmetry-breaking perturbations (we set Boltzmann’s constant to unity). This enhances its robustness, energetically protecting the PDTC state from prethermalization to an infinite temperature, and results in a Floquet heating rate that is now exponentially suppressed in the driving period T, \({\varGamma }_{{\rm{e}}}^{\,\text{a.c}}\propto \exp (-1/JT)\). Note that experimentally observing this exponential extension of the lifetime is challenging due to technical limitations (Supplementary Section 6C).
Figure 1c (red data points) shows the PDTC under an a.c. field with Ba.c. = 82.4 μT and \({f}_{{\rm{a}}.{\rm{c}}}={f}_{{\rm{r}}{\rm{e}}{\rm{s}}}=330.023\) Hz. The 1/e lifetime is extended more than 50 fold to \({T}_{2}^{{\prime} }=4.51\,s\), and corresponding to over \(M=2,900\,\widehat{{\bf{x}}}\leftrightarrow -\widehat{{\bf{x}}}\) spin flips. This manifests also in the larger signal in the zoomed-in view (Fig. 1c(i)). In particular, lifetime extension is not limited to the specific case of γy = π but applies throughout the stability regime of the DTC order (Supplementary Section 3 and Supplementary Fig. 2).
Spin evolution remains observable far beyond the value naively suggested by the 1/e time, as shown by the phase signal ϕ remaining coherent for several seconds (Fig. 1c(ii)). The \(\widehat{{\bf{x}}}\) and \(-\widehat{{\bf{x}}}\) rails correspond to phase values ϕ = 0, π, with each point tracking ϕ after every θ pulse (total, >500,000). Heating of the conventional PDTC (blue data points) towards the infinite-temperature state, \({\rho }_{{\mathcal{T}}=\infty }={\mathbb{1}}\), is evident as ϕ disperses across the [−π, π] phase space within ~2 s. By contrast, under the a.c. field (Fig. 1c(ii), red data points), the PDTC signal remains stable for over 20 s and 544,000 pulses (spin lock plus γ kick). We also note that with the a.c. field applied, micromotion among the interpulse spacings within a single period of the DTC sequence causes an apparent splitting of the signal into multiple strands. As described in ref. 52, this is due to the distinct prethermal plateaus corresponding to each stroboscopic frame within the period of the Floquet cycle. Similar micromotion is also evident in the signal shown in Supplementary Fig. 4.
Robust, high-resolution a.c. magnetic field sensing
Lifetime enhancement (Fig. 1c(i)) also yields a change in the measured signal at every fixed time t compared with the case without an additional a.c. field and, hence, enables a means to sense the a.c. field. We now consider how this extension applies to the a.c. field characteristics (Fig. 2a(i)), \({B}_{{\rm{a}}.{\rm{c}}}(t)={B}_{{\rm{a}}.{\rm{c}}}\sin (2\pi {f}_{{\rm{a}}.{\rm{c}}}t+{\Phi }_{{\rm{a}}.{\rm{c}}})\), that is, its (1) phase Φa.c., (2) amplitude Ba.c. and (3) frequency fa.c..
Fig. 2: PDTC lifetime extension under resonant a.c. fields.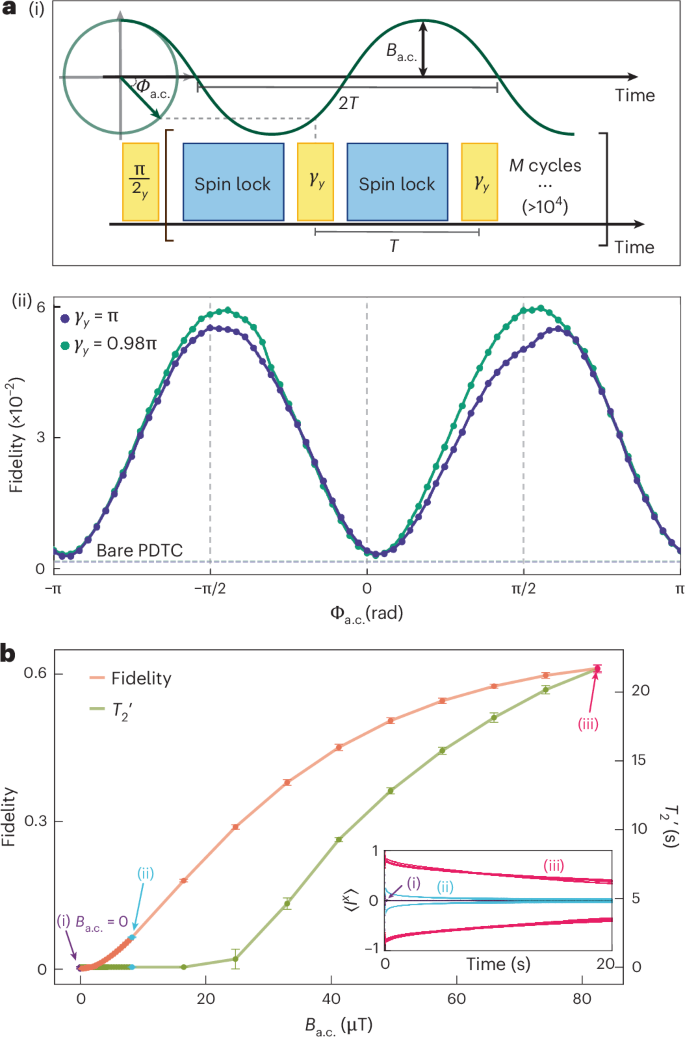
a, Effect of a.c. field phase Φa.c.. (i) Schematic: a.c. field phase Φa.c. is measured relative to the application of γy pulses, with Φa.c. = ±π/2 indicating that the troughs and peaks of the a.c. field align with the centre of γy kicks. (ii) Lifetime extension fidelity F (equation (1)) as a function of the a.c. field phase Φa.c. at a fixed amplitude of Ba.c. = 8.24 μT on resonance. Signal increase is the strongest at Φa.c. = π/2; for Φa.c. = 0, there is minimal lifetime increase over bare PDTC (dashed line). Blue (green) data points show cases for γy pulses on (ϵ = 2% away from) the γy = π PDTC stable point. Qualitatively, the same behaviour is observed, indicating PDTC robustness. (π/2)y and θx pulses (~50.25 μs), π pulse (~100.5 μs), τ (~36 μs) and 0.98π pulse (~98.5 μs). b, Effect of a.c. field amplitude Ba.c.. Resonant a.c. amplitude Ba.c. versus fidelity F at Φa.c. = π/2. Points show the mean of n = 5 independent measurements, where each measurement corresponds to the diamond being separately rehyperpolarized and run through the full pulse sequence. Error bars denote mean ± s.d. The solid line is a spline-fit guide to the eye. The right axis shows a normalized lifetime extension (>3,500-fold \({T}_{2}^{{\prime} }\) increase for 82.4 μT). Inset: time-domain profiles of the representative points in b: (i) no a.c. field, (ii) intermediate field Ba.c. = 8.24 μT and (iii) Ba.c. = 82.4 μT.
To quantify the signal enhancement, we devise a fidelity metric that remains accurate even when the signal approaches the noise floor:
$$F=\frac{1}{{N}^{{\prime} }}\mathop{\sum }\limits_{i=1}^{{N}^{{\prime} }}\langle {I}^{x}({t}_{i})\rangle P({t}_{i}),$$
(1)
where P(t) represents the ideal DTC toggling response, alternating between ±1 as spins flip between the \(\pm \widehat{{\bf{x}}}\) axes, and the normalized sum is carried out over all \({N}^{{\prime} }\) time points \({t}_{i}\in [{t}_{1},{t}_{{N}^{{\prime} }}]\); F yields the largest value when the DTC oscillations are the strongest and most stable. Formally, F corresponds to a weighted summation over the Fourier harmonics \(\ell {f}_{res}\) (\(\ell \in {{\mathbb{N}}}_{\, > \,0}\)); when approaching the noise floor, it is more robust than the standard approach of estimating the PDTC response from only the period-doubling (that is, \({f}_{res}\)) component. Lacking an analytical model for the DTC decay, the fidelity metric provides a simple, profile-agnostic measure of stability by integrating the observed magnetization. A more detailed understanding of the form of the DTC decay and its response to external magnetic field could provide a more optimized metric to improve the sensitivity of our approach.
Using this metric, Fig. 2a(ii) examines the impact of the a.c. field phase Φa.c. on resonance \({f}_{{\rm{a}}.{\rm{c}}}={f}_{{\rm{r}}{\rm{e}}{\rm{s}}}\) and γy = π (blue data points). Maximum lifetime extension occurs at Φa.c. = π/2, where the a.c. field peaks align with the centre of the γy pulses, as predicted theoretically (Supplementary Section 7). When the a.c. field nodes coincide with the γy pulses, there is a minimal effect on the PDTC lifetime. Optimal sensing, therefore, occurs when Φa.c. = π/2. We observe a slight phase shift in the response from the expected maximum at Φa.c. = π/2, due to unaccounted pulse transients when setting the a.c. field phase based on the pulse length (Fig. 2a(i)). This apparent shift arises because the actual pulse applied to the probe is slightly longer than the one generated by the arbitrary waveform transceiver53.
Additionally, the blue data points in Fig. 2a(ii) show the response to slight deviations from the small point, here γy = 0.98π. The data confirm the robustness of the PDTC order. In Supplementary Fig. 2, we display the entire experimentally mapped PDTC phase diagram for all γy values, demonstrating a large stable region around γy = π, independent of t.
Figure 2b studies the effect of the a.c. field strength Ba.c., set at resonance with Φa.c. = π/2. The fidelity profile shows a gradual increase, followed by a linear rise and eventually plateaus at higher field strengths when Ba.c. becomes comparable with the Rabi field of the θx Floquet pulses. The right vertical axis shows the corresponding \({T}_{2}^{{\prime} }\) lifetimes; the maximum extension, corresponding to \({T}_{2}^{{\prime} }=21.3\,s\), is >3,000 fold. Here data are for N = 4; Supplementary Section 4A discusses the extensions obtained as a function of N. Figure 2b illustrates the time profiles of \(\langle {I}^{x}\rangle\) for three cases: (i) no field Ba.c. = 0, (ii) Ba.c. = 8.24 μT and (iii) Ba.c. = 82.4 μT. Figure 2b indicates that this can be used for sensing at appropriately chosen bias points. The sensitivity is determined by comparing the response of the fidelity F to perturbation in the a.c. field amplitude Ba.c. (Fig. 2b), with the fluctuations in F obtained for multiple initializations at fixed Ba.c. (Methods and Supplementary Section 4D). We obtain a sensitivity of 880 pT Hz−1/2 with an optimum bias field of Ba.c. = 415 nT.
A distinguishing feature of the a.c.-field-mediated lifetime extension is its strongly resonant nature. Figure 3a examines the fidelity F across a range of a.c. field frequencies fa.c. under identical conditions. Off-resonant frequencies have a negligible impact on the DTC lifetime, matching the bare PDTC (Ba.c. = 0, F ≈ 0). By contrast, a notable lifetime increase is observed on resonance \({f}_{res}\) (Fig. 3a). A zoomed-in view (Fig. 3a(i)) reveals a narrow linewidth of Δf ≈ 70 mHz set by the maximum integration time (\({t}_{{N}^{{\prime} }}\) in equation (1)), positively correlated with the inverse of the PDTC lifetime \({({T}_{2}^{{\prime} })}^{-1}\). We also note a weak additional response at subharmonics, especially \({f}_{res}/2\), at large Ba.c.. This is discussed in Supplementary Section 4C (Supplementary Fig. 5).
Fig. 3: PDTC-based a.c. magnetic field sensing.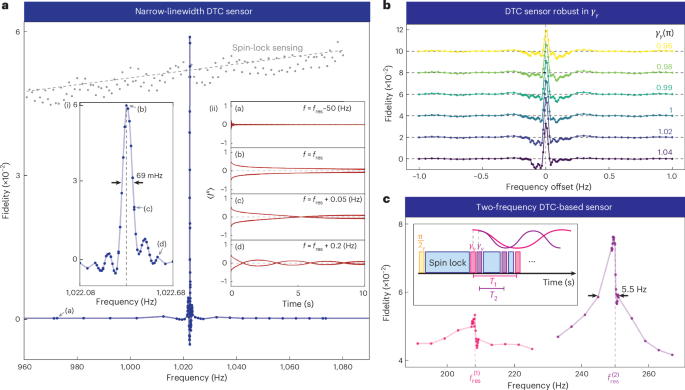
a, Narrow-linewidth a.c. sensing: fidelity F (blue data points) is measured by sweeping the frequency fa.c. with Ba.c. = 8.24 μT and N = 4, keeping other parameters consistent with those in Fig. 1c. A sharp increase in the PDTC lifetime (and hence, fidelity) occurs at the resonance condition \({f}_{AC}={f}_{res}\). By contrast, the spin-lock sensing scheme introduced in ref. 54 (grey data points) lacks frequency selectivity. (i) Zoomed-in view into the resonance feature, showing a narrow linewidth Δℓ ≈ 70 mHz, determined by \({({T}_{2}^{{\prime} })}^{-1}\). Points (b)–(d) are marked on the spectral wing. (ii) Time-domain PDTC profiles of \(\langle {I}^{x}\rangle\) at points (a)–(d) in a and (i) at various offset frequencies from resonance. (a) Far off-resonance: fast signal decay, similar to bare PDTC case. (b) On resonance: substantially extended PDTC lifetime. (c) and (d) Slightly off-resonance, showing long lifetimes with beat pattern at frequency \(\delta f={f}_{AC}-{f}_{res}\), resulting in \({T}_{2}^{{\prime} }\)-limited a.c. sensing. Supplementary Section 4E discusses exploiting this for noise-rejected sensing: (π/2)y and θx pulses (~51.5 μs); γy pulse (~103 μs); τ (~36 μs). b, Robustness of the resonance feature to deviations in γy kick angle, γy = π − ϵ (colour bar). The fidelity baselines for different γy kick angles were offset by 2 × 10⁻² to prevent overlap. Data show that the spectral width Δℓ remains independent of ϵ. Similar experimental mapping of the PDTC phase diagram with respect to γy is shown in Supplementary Fig. 2. (π/2)y and θx pulses (~52.25 μs); τ (~36 μs); γy pulse length scales linearly with its angle, with a π pulse (~104.5 μs). c, Tunable sensor profile for two-frequency sensing. Inset: sequence with two interspersed γy pulse blocks, leading to two resonance conditions: \({f}_{res}^{(1)}\) and \({f}_{res}^{(2)}\). Ba.c. = 32.96 μT. Main panel: measured frequency response (similar to a), showing a two-tone response centred at 208 Hz and 250 Hz, with a narrow linewidth Δℓ ≈ 5.5 Hz. (π/2)y and θx pulses (~50.25 μs); γy pulse (~100.5 μs). tacq ≈ 13.6 μs for c.
The sharp \({f}_{res}\) response is further clarified using the representative points marked in Fig. 3a(i). The corresponding time-domain PDTC profiles are shown in Fig. 3a(ii). Far off-resonance (point (a)), the dynamics remain unaffected by the a.c. field. Exactly on resonance (point (b)), a notable lifetime increase is observed. Slightly off-resonance (points (c) and (d)), a distinctive beating in the fidelity F appears, reflecting the frequency offset \(\delta f={f}_{{\rm{a}}.{\rm{c}}}-{f}_{{\rm{r}}{\rm{e}}{\rm{s}}}\). The integration of this beating pattern over time leads to the \({({t}_{N}^{{\prime} })}^{-1}\) linewidth. In sensing applications, this can enable a precise reconstruction of unknown signals within the narrow resonance band Δf via a Fourier transform of the DTC temporal dynamics. The sensor bandwidth itself is determined by the shortest possible pulse lengths, and could span the 0.5–50-kHz range (Supplementary Fig. 1).
The dynamics of the tracked phase ϕ corresponding to Fig. 3a(ii) is presented in Supplementary Section 4B. The data (Supplementary Fig. 4) reveal intricate micromotion dynamics and demonstrate the ability to measure it for periods well beyond the 1/e lifetimes, exceeding 60,000 γ kicks, with high clarity.
We emphasize that the lifetime-limited linewidth is a feature of DTC-based sensing, distinguishing it from other methods such as magnetometry using spin-locked prethermal states introduced in ref. 54. Figure 3a (grey data points) illustrates the response of the spin-lock sensing scheme over the same frequency range in which we measured the DTC’s response. Unlike DTC-based sensing, the spin-lock sensing scheme can detect multiple frequencies without modifying the pulse sequence parameters, but as indicated by the data, it exhibits monotonically increasing response with frequency, lacking frequency selectivity. Even on resonance, the linewidth of the spin-lock sensing scheme can extend to several hundred hertz—at least four orders of magnitude broader—primarily dominated by interspin couplings, and largely independent of \({T}_{2}^{{\prime} }\). A detailed analysis of the spin-lock sensing data is provided in Supplementary Section 4H. By contrast, the narrow linewidth of the DTC sensing scheme enables tuning into specific fields that meet the resonance condition, effectively rejecting non-resonant fields (Supplementary Fig. 7). More broadly, compared with conventional quantum sensors based on electronic spins55, the two-tone cavity-interrogated nuclear PDTC allows single-shot, quasi-continuous sensing for \(> 5{T}_{2\,}^{{\prime} \,}( > 100\,{\rm{s}})\) (Fig. 1c(ii) and Supplementary Fig. 4) without sensor reinitialization, with the resonant lifetime extension enhancing the sensor precision.
Another consequence of the PDTC order is that the narrow sensing linewidth remains highly robust to pulse errors ϵ in the γy pulses away from γy = π. This is shown in Fig. 3b with γy denoted by the colour bar. The sensor linewidth (zoomed-in view shown in Fig. 3a(i)) remains unaffected by these errors. Additionally, the system exhibits a remarkable tolerance to on-site disorder (Supplementary Section 7D) and fluctuations in the spin-lock θx drive, evidenced in the capacity of reliably applying >106 θx pulses even with realistic imperfections (due to Rabi frequency heterogeneity) in these experiments.
The two-tone PDTC discussed so far (Fig. 1b(i)) hosts a single resonance frequency \({f}_{res}\), tunable via the sequence parameter T. However, it is possible to expand the number of resonance frequencies and adjust the DTC sensing spectrum by modifying the PDTC sequence. For instance, Fig. 3c(i) introduces a three-tone PDTC, establishing two resonance conditions at \({f}_{res}^{(1)}\) and \({f}_{res}^{(2)}\), achieved through two different interleaved periods for the γy pulses, interspersed with spin-lock θx pulses. The experimental response in Fig. 3c shows two distinct frequencies separated by ~42 Hz. We observe asymmetric spectra with a stronger x component when the period T is decreased, leading to a more frequent overlap between the a.c. field antinodes and the γy pulses. This increased overlap enhances the x-component response (Supplementary Section 6B). The two-frequency linewidths, around 5 Hz, remain appreciably narrower than the sensor’s linewidth without DTC order (~223 Hz)54, although single-frequency linewidths (Fig. 3a) are narrower due to longer \({T}_{2}^{{\prime} }\) lifetimes in the two-tone case.
a.c.-field-mediated lifetime extension for single-tone PDTC
Lifetime enhancement from a.c. field-mediated finite energy density applies broadly to all U(1) PDTCs, not just the two-tone PDTC. To demonstrate this, we consider a conventional single-tone DTC that alternates between the \(+\widehat{{\bf{z}}}\) and \(-\widehat{{\bf{z}}}\) states on the Bloch sphere. This approach is widely used across platforms, including superconducting qubits8,11, cold atoms56 and nuclear magnetic resonance (NMR)4,5,12. Unlike the two-tone DTC, which enables non-destructive inductive read-out in the \(\widehat{{\bf{x}}}\)–\(\widehat{{\bf{y}}}\) plane to monitor the decay dynamics in a single shot, the single-tone DTC requires restarting the experiment for each data point.
The sequence is shown in Fig. 4a(i), and consists of M spin-flip γy pulses along \(\widehat{{\bf{y}}}\) (Fig. 4a(ii) describes this using a schematic). We utilize the exact U(1) symmetry of the dipole–dipole Hamiltonian Hdd, which conserves \(\widehat{{\bf{z}}}\) magnetization: \([{H}_{dd},{I}^{z}]=0\). For efficient read-out, spins are tipped onto the \(\widehat{{\bf{x}}}\,-\,\widehat{{\bf{y}}}\) plane and spin locked using a train of θx pulses along \(\widehat{{\bf{x}}}\). Unlike the two-tone case shown in Fig. 1, the data here are collected point by point for different values of M.
Fig. 4: Single-axis PDTC extension under a.c. field.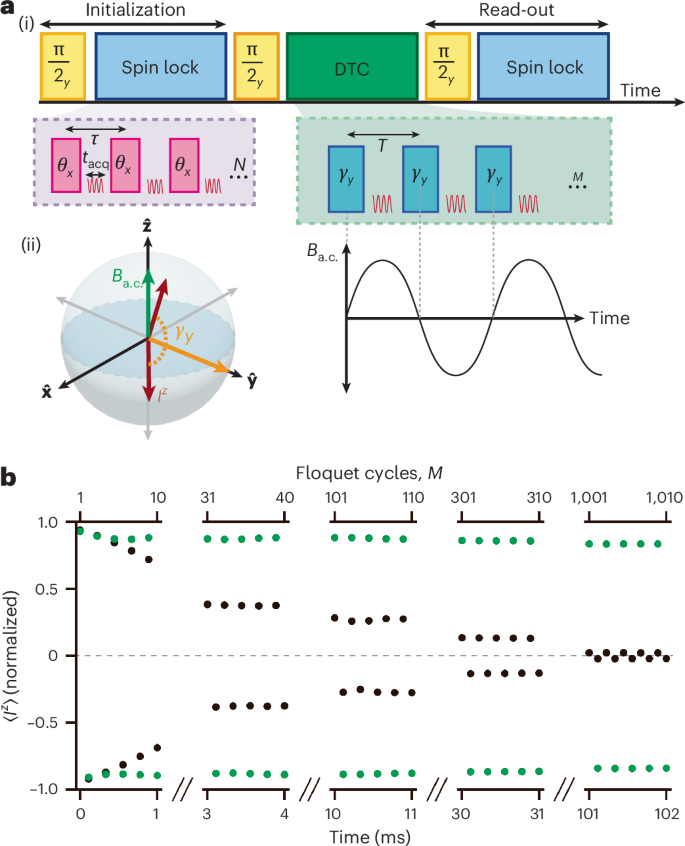
a, (i) Protocol: PDTC sequence (green) consists of a train of M 100.5-μs γy = π pulses along \(\widehat{{\bf{y}}}\), spaced by 300 μs, flipping the spins between \(+\widehat{{\bf{z}}}\) and \(-\widehat{{\bf{z}}}\), robust to deviations from γy = π (ref. 10). Spin-lock trains before and after the DTC sequence read the initial and final spin population \(\langle {I}_{z}\rangle\), enhancing the signal-to-noise ratio. (ii) Spin motion on a Bloch sphere. PDTC oscillates along the same axis as the applied a.c. field (\(\widehat{{\bf{z}}}\)), unlike the two-tone case in which the axes are orthogonal. b, PDTC lifetime extension. Black data points: normalized single-axis PDTC signal \(\langle {I}_{z}\rangle\) without an a.c. field, decaying with \({T}_{2}^{{\prime} }=0.01\,s\) or M = 35 flips. Green data points: DTC under a resonant a.c. field with Ba.c. = 1 μT, showing a substantially extended lifetime of \({T}_{2}^{{\prime} }=20\,s\), or M = 70,000 spin flips—a 2,000-fold increase. Each data point requires restarting the experiment.
The results are shown in Fig. 4b. Without an a.c. field (black data points), we observe robust period-doubling dynamics with a 1/e decay time \(T{\prime} \approx 0.01\,s\) and \(M=40\,\widehat{{\bf{z}}}\leftrightarrow -\widehat{{\bf{z}}}\) flips. With a resonant a.c. field of Ba.c. = 40 μT (green data points), the lifetime is markedly prolonged, extended by more than three orders of magnitude to M = 70,000 and \({T}_{1}^{{\prime} }=20\,s\). The phase response to Φa.c. is opposite to that shown in Fig. 2a(ii), as the a.c. field direction aligns with the PDTC oscillation axis; here it is the maximum near Φa.c. = 0 (Supplementary Fig. 11). Although the quasi-continuous measurement from the two-tone drive is more suitable for sensing applications, the data in Fig. 4b demonstrate that this lifetime extension mechanism applies broadly to U(1) PDTCs.