
WorldView2 analysis
Satellite imagery has been routinely used for estimating emperor penguin numbers for over a decade11,12,33,34. In WorldView2 images, individual penguins could clearly be seen. The area of penguins classified by the binary threshold method in the three VHR images amounted to ~76,000 m2 in the southern sector in 2022 and 4000 m2 in the eastern image in 2024. This was the area of the penguins themselves, rather than their guano. These figures are approximate and probably a slight underestimate, as the binary classification sometimes missed isolated individual penguins that could be identified visually. Overestimation is also possible and can be caused by dense guano or low sun angle (excessive shadows), which this image did not have.
Sentinel-2/Worldview2 comparison results
In the 45.5 km2 area for which synchronous satellite imagery was available, there were 16 brown patches in Sentinel-2 compared to 18 groups in the comparable WorldView2 imagery. Of these, 15 were in the same positions (Fig. 5). Statistically, these equate to a precision of 0.9375, a recall of 0.8333 and an F1 score of 0.8823. The three groups missed in the Sentinel-2 imagery were small aggregations of penguins, the largest of which was very close to a crack in the sea ice, which made identification difficult. The one false positive was a brown patch that may have been an area of old guano/feathers that penguins had probably previously occupied earlier in the season, and was misclassified in the Sentinel-2 data. Several other paler brown patches could also be seen, but these were not classified as penguins in either image. The results show that Sentinel-2 can be used effectively to search for moulting emperor penguins over a wide scale on fast ice and that the majority can be found in the freely available medium resolution imagery.
Sentinel-2 search results
Generally, brown clusters of pixels in Sentinel-2 imagery could be clearly seen over the search area in all years (2019–2025). They often extended over the whole area of interest, but were almost always located on land-fast sea ice. The only time that groups of penguins were seen in pack ice was in 2022 and 2019, when several groups (n = 14 in 2022 and n = 6 in 2019) were located on fast ice that broke up in late January. On both occasions, the ice floes stayed near their original location for 1–2 weeks after breakup, and penguin groups could be seen on the pack ice. However, by mid-February in 2022 and late February in 2019, these ice floes had disintegrated, and penguins could no longer be seen in the pack ice.
Over the seven study years, the position, distribution pattern, number of groups, and timing of the moult varied (Fig. 6 and Table 1). The main driver of the penguin distribution was the sea ice extent. In years with low sea ice, especially in 2019, 2022, 2023 and 2024, the distribution and the position of the penguin groups was generally constrained by areas of fast ice near the coast (Fig. 6). In these years the groups were more concentrated (mean distance apart in 2023 =231 m, compared to 2019 = 1690 m) and the size of the clusters tended to be larger. Some groups probably contained several thousand individuals. In these low sea ice years, the groups were often clustered near the coast, probably because of the more stable, or longer-lasting nature of the ice there. In some instances, they had moved into rifts in the ice shelf or up onto the ice shelf. In years with more extensive sea ice, the pattern was more varied, and groups were generally smaller and more widely distributed (for more details of individual years, see Supplemental Table 1 “Observations from individual years”).
Fig. 6: Results of the Sentinel-2 survey.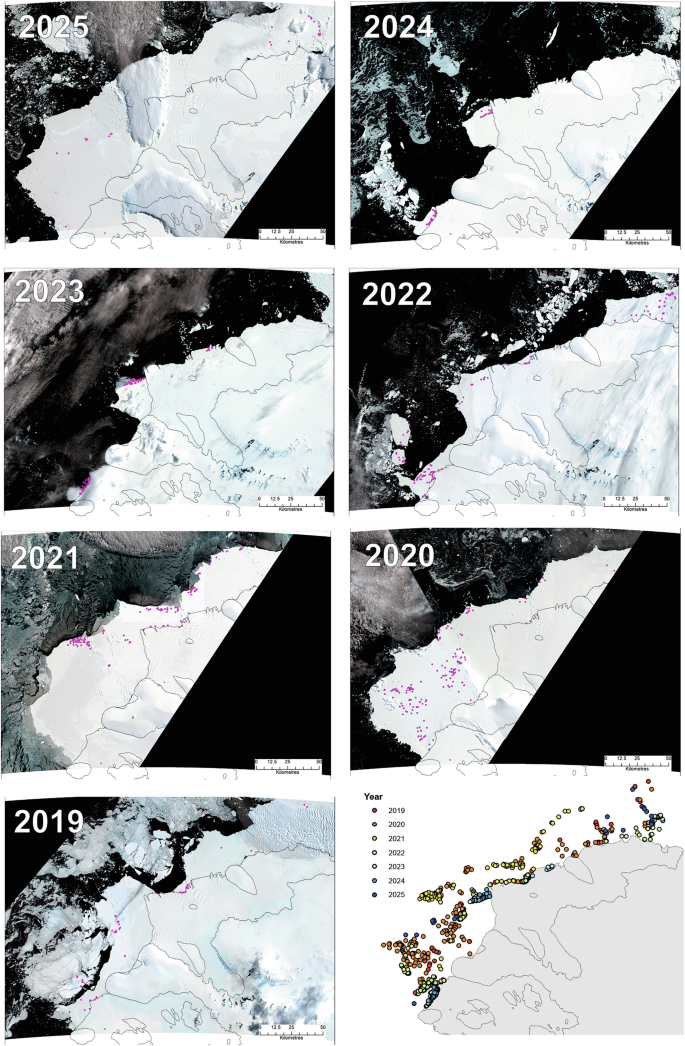
Pink dots represent identified moulting groups over seven years of Sentinel-2 imagery from 2019 to 2025. The underlying imagery in each tile is a snapshot of the ice conditions in each year, although the timing varies. Dates of underlying imagery are: 15 Feb 2025, 11 Feb 2024, 3 Feb 2023, 5 Feb 2022, 11 March 2021, 15th and 25 Feb 2020 combined, 1st Feb 2019 (note that these were not the only images used to find moulting groups). The bottom right panel shows the combined annual points, colour-coded by year.
Table 1 Maximal number of penguin groups identified per year in Sentinel-2 imagery
In 2020, the penguin groups (n = 224) were distributed across the fast ice, which at that time was extensive throughout the season (Fig. 6 and Supplemental Table 1 “Observations from individual years”) with a width of up to 80 km and an area of over 10,000 km2. But one year later, although the ice conditions were similar, most groups (n = 95 of 132) were within 5–10 km of the sea ice-edge. However, the 2021 image was taken on 11 March at a time when most of the groups were departing, which may be why they were at the ice edge. In comparison, in 2020, by 16 March, all moulting groups had left, and there was no sign of any penguins on the ice. This pattern was typical: groups gathered throughout January, reached a peak in early February and departed in early March.
Numbers of moulting groups varied (Table 1); the largest number was identified in 2023 when 247 groups were recorded. The lowest number of groups (n = 25) was recorded in 2025. All groups sighted in 2025 were small, just a few pixels, and the majority occurred further east on extensive fast ice off the Land Glacier (75.25° S, 142.50° W), north of Grant Island. This area was also occasionally used in other years, particularly in 2022. However, only in 2025 were most of the groups found in the area.
The penguin groups mainly concentrated in four distinct areas of fast ice: 1. between Vollmer Island (76.7° S, 150.7° W), and the western part of Guest Peninsula (76.4° S, 149.7° W): 2. between the western edge of the Guest Peninsula (76.4° S, 149.7° W) and the northwestern point of the ice shelf in Block Bay surrounding Driscol Island (75.75° S, 148.5° W): 3. the northwestern point of the ice shelf surrounding Driscol Island and Newman Island (75.5° S, 146.1° W) (including Stephen Island), and 4: the area between Newman Island (75.5° S, 146.1° W) and the ice coast between Newman Island and Groves Island (75.35° S, 143.0° W) (Table 1).
In 2022, the fast ice extent in the region was low, and by 23rd Feb, only one patch of less than 1000 km2 remained (Table 1). In 2023 and 2024, all fast ice broke out during the moulting period throughout the area. In 2023, this happened between 30 January and 2 February, and in 2024, around 9 February. In both instances, penguin groups were on the fast when it broke up. In 2023, almost all pack ice disintegrated into bergy bits and brash and open water within the next week. In 2024, the eastern pack ice area disintegrated, but in the west of the area, the fast ice broke into pack ice, which persisted until the end of February. In both years, by the end of February, no fast ice existed along this stretch of coastline west of the Land Glacier.